javascript debug terminal
테스트 코드나 디버깅 설정 파일 없이 파일을 실행해서 바로 디버깅하는 방법이 있다.
기존에는 .vscode 디렉토리에 launch.json 파일을 만들고 디버깅 설정을 해줬다.
{
  "configurations": [
    {
      "type": "pwa-node",
      "args": [
        "--ui",
        "bdd",
        "--require",
        "ts-node/register",
        "--timeout",
        "999999",
        "--colors",
        "--bail",
        "${workspaceFolder}/test/**"
      ],
      "internalConsoleOptions": "openOnSessionStart",
      "name": "Mocha Tests",
      "program": "${workspaceFolder}/node_modules/mocha/bin/_mocha",
      "request": "launch",
      "env": {
        "NODE_ENV": "test"
      },
      "resolveSourceMapLocations": [
        "${workspaceFolder}/**",
        "!**/node_modules/**"
      ],
      "runtimeExecutable": "/Users/mh/.nvm/versions/node/v12.22.8/bin/node"
    }
  ]
}
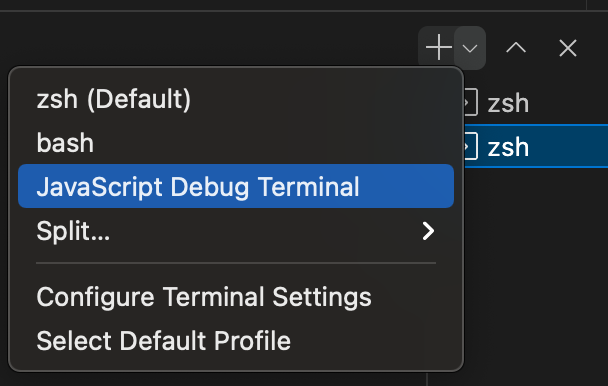
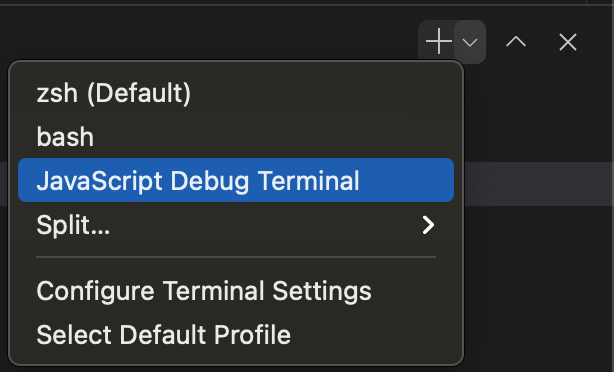
가끔 테스트 코드 없이 바로바로 디버깅하고 싶을 때가 있을 수 있는데 vscode에서 terminal을 켜고 다음과 같이 JavaScript Debug Terminal을 열어준다.
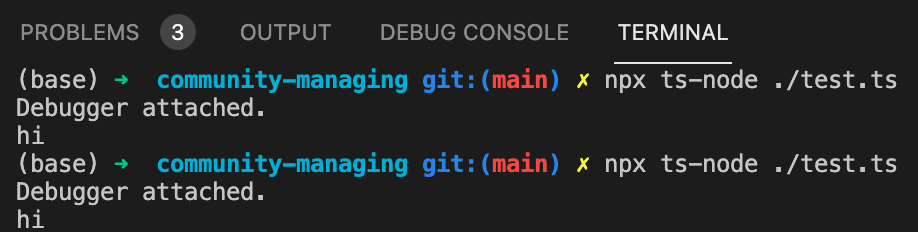
디버깅하고 싶은 라인에 브레이크포인트를 찍고 파일을 실행해준다.
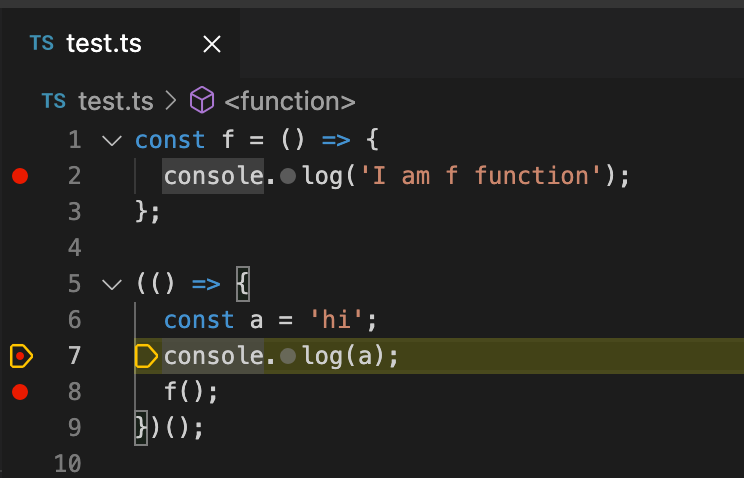
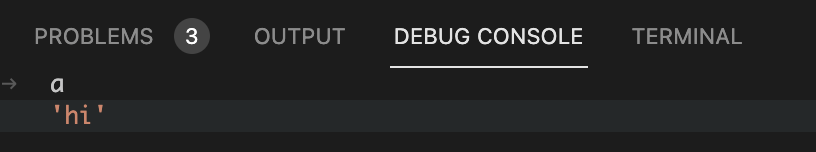
변수를 확인할 수 있다.
debug actions의 step over로 한 줄씩 실행도 된다.
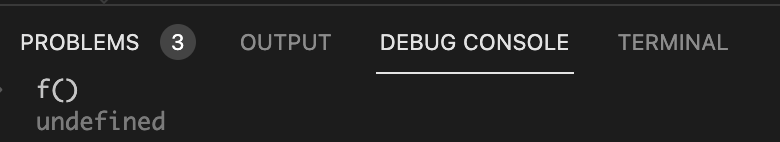
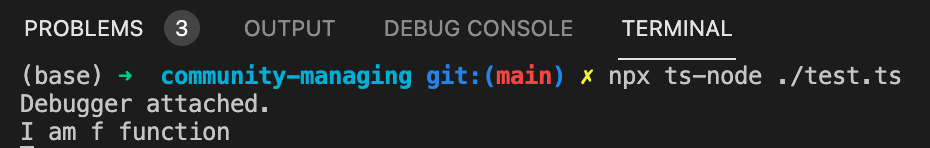
debug console에서 함수를 실행한 뒤 terminal에서 확인할 수 있다. 다만 창을 왔다갔다 하는 게 불편하다.
프론트엔드에서도 활용할 수 있다.
https://www.youtube.com/watch?v=EXxbDVJ01wM
