
1. ElasticSearch
open source analytics & search engine
- Search
- Application Performance Management
- Send events
- Analyze data (ex. predict sale, anomality detection)
2. How ElasticSearch Works
-
data stored as documents
-
document : json object = row in RDB
{
    "field name": "field value"
}- query through REST api
- written in java
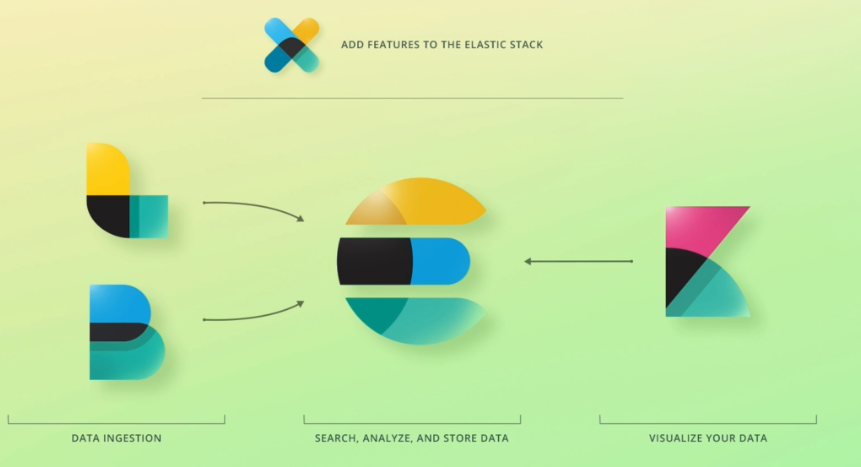
3. Elastic Stack Overview
3-1. Kibana : analytics & visualization platform
- also with machine learning
- web interface for elasticsearch
- provides dashboards
3-2. Logstash : data processing pipeline
- data received as events, process and send to others
- input plugins : files, http, sql, etc
- filter plugins : csv, xml, json, data enrichment, etc
- output plugins : elasticsearch, email, http, etc
ex) process access log from web server
-
Logstash reads logs as events
-
process logs w/ something like regular expression
-
send processed logs to ElasticSearch
3-3. X-Pack : additional features to elasticsearch & kibana
- Security : authentication and authorization
- Monitoring : CPU usage, disk space
- Alerting : configurable using other features
- Reporting : export Kibana visualizations to pdf, csv, etc
- Machine Learning : for Elasticsearch & Kibana
- Graph : analyze relationships in data
- SQL : query elasticsearch with sql
3-4. Beats : collect data and send to ElasticSearch & Logstash
-
Filebeat : collect log files
-
Metricbeat : collect system and service metrics
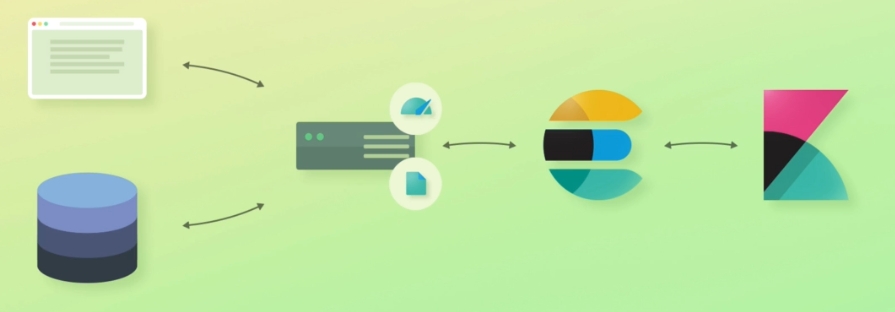
4. Common ElasticSearch Architectures
4-1. E-commerce Application
Data in a RDB, wants to Improve search to be full-text search
- Send user search to elasticsearch through web app server
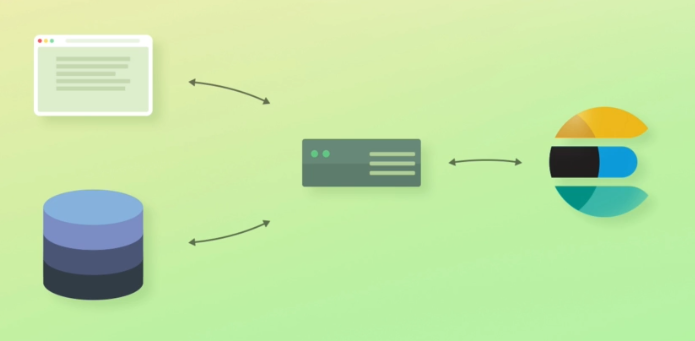
- Duplicate data on RDB and ElasticSearch
- Simplest architecture of elasticsearch
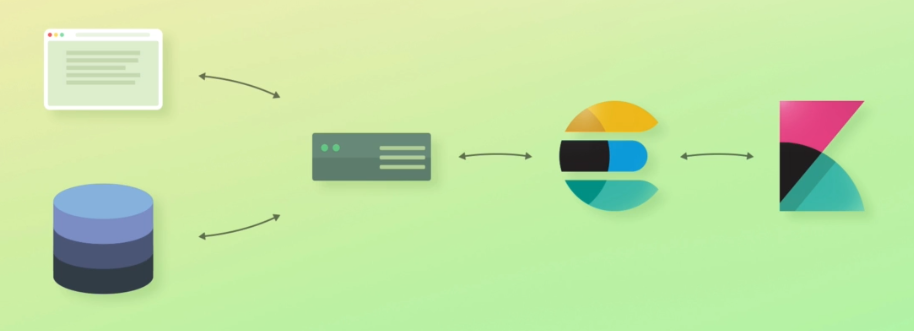
4-2. Visualize Data
- add Kibana to communicate with ElasticSearch
4-3. Monitor Server Metrics
- install metircbeats on web app server
- Kibana config is stored within ElasticSearch, so metricbeats data sent to ElasticSearch can easily be put on dashboard

4-4. Monitor Acess and Error Logs
-
how long it takes to process each input? (monitor endpoints)
-
how to keep bugs to minimum?
--> use Filebeat
4-5. More Advanced Event Processing
-
Doing it within web app decreases maintainability
--> use Logstash
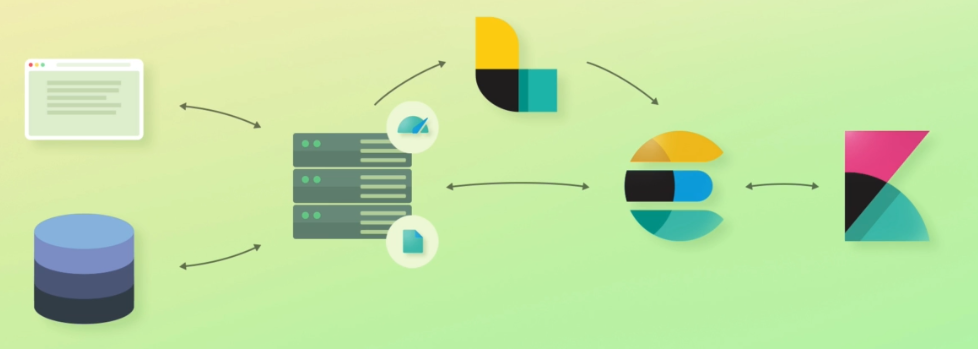
- In a perfect world, all events go through Logstash

편하게 읽기 좋은 단위의 포스트를 추구하는 개발자입니다