[ML] 2. Descending into ML
Linear Regression
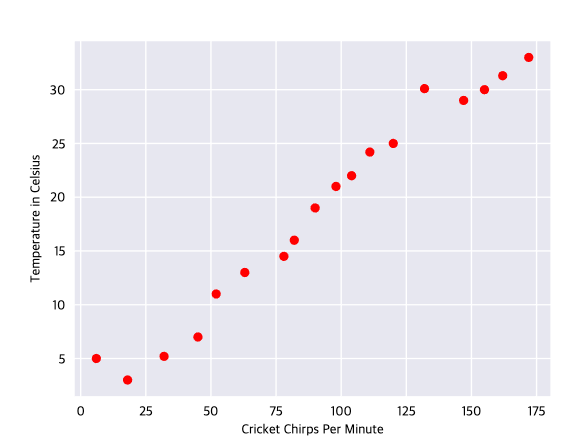
Figure 1. Chirps per Minute vs Temperature in Celsius
The plot shows the temperature rising with the number of chirps. Is this relationship between chirps and temperature linear? Yes, you could draw a single straight line like thw following approximate this relationship:
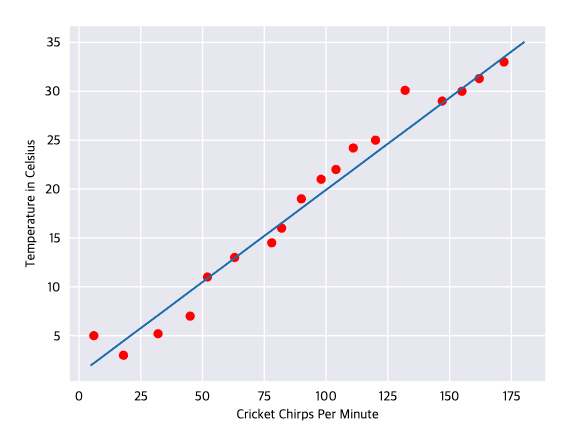
Figure 2. A linear relationship
True, the line doesn't pass through every dot, but the line does clearly show the relationship between chirps and temperature. Usint the equation for a line, you could write down the relationship as follows:
where:
- y is the temperature in Celsius-the value we're trying to predict
- m is the slope of the line.
- x is the number of chirps per minute - the value of our input feature
- b is the y-intercept
By convention in machine learning, you'll write the equation for a model slightly differently:
where:
- is the predicted label (a desired output)
- is the bias (the y-intercept), sometimes referred to as .
- is the weight of feature 1. Weight is the same concept as the "slope" m in the traditional equation of a line.
- is a feature (a known input).
To infer(predict) the temperature for a new chirps-per-minute value , just subsititue the value into this model
Although this model uses only one feature, a more sophisticated model might rely on multiple features, each having a seerate weight. For example, a model that relies on three features might look as follows:
Training and Loss
Training a model means learning (determining) good values for all the weights and the bias from labled examples.
Loss is the penalty for a bad prediction. That is, loss is a number indicating how bad the model's prediction was on a single example.
Loss Function
Squared Loss (also know as Loss)
= the square of the difference between the label and the prediction
= (obaservation - prediction(x))^2
= (y-y')^2
Mean squre error (MSE)
the everate squared loss per example over the whole datasheet. To calculate MSE, sum up all the squared losses for individual examples and then divide by the number of examples:
where:
- is an example in which
- is the set of features (for example, chirps/minute, age, gender) that the model uses to make predictions.
- is the example's label (for example, temperature).
- is a function of the weights and bias in combination with the set of features .
- is a data set containing many labeled examples, which are pairs.
- is the number of examples in .