가시다(gasida) 님이 진행하는 Istio Hands-on Study 1기 과정을 참여하여 정리한 글입니다.
6주차는 DataPlane 트러블슈팅과 튜닝 주제로 학습을 하였습니다.
1. 실습환경 구성
1.1 [실습 환경 구성] k8s(1.23.17) 배포
- NodePort(30000 HTTP, 30005 HTTPS)
#
git clone https://github.com/AcornPublishing/istio-in-action
cd istio-in-action/book-source-code-master
pwd # 각자 자신의 pwd 경로
code .

# 아래 extramounts 생략 시, myk8s-control-plane 컨테이너 sh/bash 진입 후 직접 git clone 가능
kind create cluster --name myk8s --image kindest/node:v1.23.17 --config - <<EOF
kind: Cluster
apiVersion: kind.x-k8s.io/v1alpha4
nodes:
- role: control-plane
  extraPortMappings:
  - containerPort: 30000 # Sample Application (istio-ingrssgateway) HTTP
    hostPort: 30000
  - containerPort: 30001 # Prometheus
    hostPort: 30001
  - containerPort: 30002 # Grafana
    hostPort: 30002
  - containerPort: 30003 # Kiali
    hostPort: 30003
  - containerPort: 30004 # Tracing
    hostPort: 30004
  - containerPort: 30005 # Sample Application (istio-ingrssgateway) HTTPS
    hostPort: 30005
  - containerPort: 30006 # TCP Route
    hostPort: 30006
  - containerPort: 30007 # kube-ops-view
    hostPort: 30007
  extraMounts: # 해당 부분 생략 가능
  - hostPath: /Users/sjkim/Labs/CloudNeta/istio/book-source-code-master # 각자 자신의 pwd 경로로 설정
    containerPath: /istiobook
networking:
  podSubnet: 10.10.0.0/16
  serviceSubnet: 10.200.0.0/22
EOF

Creating cluster "myk8s" ...
 ✓ Ensuring node image (kindest/node:v1.23.17) 🖼
 ✓ Preparing nodes 📦
 ✓ Writing configuration 📜
 ✓ Starting control-plane 🕹️
 ✓ Installing CNI 🔌
 ✓ Installing StorageClass 💾
Set kubectl context to "kind-myk8s"

# 설치 확인
docker ps

# 노드에 기본 툴 설치
docker exec -it myk8s-control-plane sh -c 'apt update && apt install tree psmisc lsof wget bridge-utils net-tools dnsutils tcpdump ngrep iputils-ping git vim -y'

# (옵션) kube-ops-view
helm repo add geek-cookbook https://geek-cookbook.github.io/charts/
helm install kube-ops-view geek-cookbook/kube-ops-view --version 1.2.2 --set service.main.type=NodePort,service.main.ports.http.nodePort=30007 --set env.TZ="Asia/Seoul" --namespace kube-system
kubectl get deploy,pod,svc,ep -n kube-system -l app.kubernetes.io/instance=kube-ops-view

## kube-ops-view 접속 URL 확인
open "http://localhost:30007/#scale=1.5"
open "http://localhost:30007/#scale=1.3"

# (옵션) metrics-server
helm repo add metrics-server https://kubernetes-sigs.github.io/metrics-server/
helm install metrics-server metrics-server/metrics-server --set 'args[0]=--kubelet-insecure-tls' -n kube-system
kubectl get all -n kube-system -l app.kubernetes.io/instance=metrics-server
1.2 [실습 환경 구성] istio 1.17.8 설치
# myk8s-control-plane 진입 후 설치 진행
docker exec -it myk8s-control-plane bash
-----------------------------------
# (옵션) 코드 파일들 마운트 확인
tree /istiobook/ -L 1
혹은
git clone ... /istiobook

# istioctl 설치
export ISTIOV=1.17.8
echo 'export ISTIOV=1.17.8' >> /root/.bashrc

curl -s -L https://istio.io/downloadIstio | ISTIO_VERSION=$ISTIOV sh -
cp istio-$ISTIOV/bin/istioctl /usr/local/bin/istioctl
istioctl version --remote=false

# demo 프로파일 컨트롤 플레인 배포
istioctl install --set profile=demo --set values.global.proxy.privileged=true -y
✔ Istio core installed                                                           ✔ Istiod installed                                                               ✔ Egress gateways installed                                                     ✔ Ingress gateways installed                                                     ✔ Installation complete                                                         Making this installation the default for injection and validation.

# 보조 도구 설치
kubectl apply -f istio-$ISTIOV/samples/addons

# 빠져나오기
exit
-----------------------------------

# 설치 확인 : istiod, istio-ingressgateway, crd 등
kubectl get istiooperators -n istio-system -o yaml
kubectl get all,svc,ep,sa,cm,secret,pdb -n istio-system
kubectl get cm -n istio-system istio -o yaml
kubectl get crd | grep istio.io | sort

# 실습을 위한 네임스페이스 설정
kubectl create ns istioinaction
kubectl label namespace istioinaction istio-injection=enabled
kubectl get ns --show-labels

# istio-ingressgateway 서비스 : NodePort 변경 및 nodeport 지정 변경 , externalTrafficPolicy 설정 (ClientIP 수집)
kubectl patch svc -n istio-system istio-ingressgateway -p '{"spec": {"type": "NodePort", "ports": [{"port": 80, "targetPort": 8080, "nodePort": 30000}]}}'
kubectl patch svc -n istio-system istio-ingressgateway -p '{"spec": {"type": "NodePort", "ports": [{"port": 443, "targetPort": 8443, "nodePort": 30005}]}}'
kubectl patch svc -n istio-system istio-ingressgateway -p '{"spec":{"externalTrafficPolicy": "Local"}}'
kubectl describe svc -n istio-system istio-ingressgateway

# NodePort 변경 및 nodeport 30001~30003으로 변경 : prometheus(30001), grafana(30002), kiali(30003), tracing(30004)
kubectl patch svc -n istio-system prometheus -p '{"spec": {"type": "NodePort", "ports": [{"port": 9090, "targetPort": 9090, "nodePort": 30001}]}}'
kubectl patch svc -n istio-system grafana -p '{"spec": {"type": "NodePort", "ports": [{"port": 3000, "targetPort": 3000, "nodePort": 30002}]}}'
kubectl patch svc -n istio-system kiali -p '{"spec": {"type": "NodePort", "ports": [{"port": 20001, "targetPort": 20001, "nodePort": 30003}]}}'
kubectl patch svc -n istio-system tracing -p '{"spec": {"type": "NodePort", "ports": [{"port": 80, "targetPort": 16686, "nodePort": 30004}]}}'

# Prometheus 접속 : envoy, istio 메트릭 확인
open http://127.0.0.1:30001

# Grafana 접속
open http://127.0.0.1:30002

# Kiali 접속 1 : NodePort
open http://127.0.0.1:30003

# (옵션) Kiali 접속 2 : Port forward
kubectl port-forward deployment/kiali -n istio-system 20001:20001 &
open http://127.0.0.1:20001

# tracing 접속 : 예거 트레이싱 대시보드
open http://127.0.0.1:30004
2. DataPlane 트러블슈팅하기
Istio 환경에서는 문제가 단순히 애플리케이션 코드가 아니라 프록시, 설정, 네트워크 정책, 보안 정책, 텔레메트리 시스템 등 다양한 구성 요소와 얽혀 있기 때문에, 적절한 도구를 사용한 빠른 진단이 중요하다.
🔎 들어가며: 데이터 플레인 문제 해결
네트워크 통신은 다양한 요소로 인해 쉽게 문제가 발생할 수 있다.
Istio의 핵심 목적은 이러한 문제 상황에서 트래픽 흐름을 시각화하고, 복원 기능(타임아웃, 재시도, 서킷 브레이커 등)을 제공함으로써 앱이 자동으로 대응할 수 있도록 돕는 것이다.
하지만 네트워크의 핵심 구성 요소인 서비스 프록시(Envoy) 자체가 잘못 동작하면 문제가 복잡해진다.
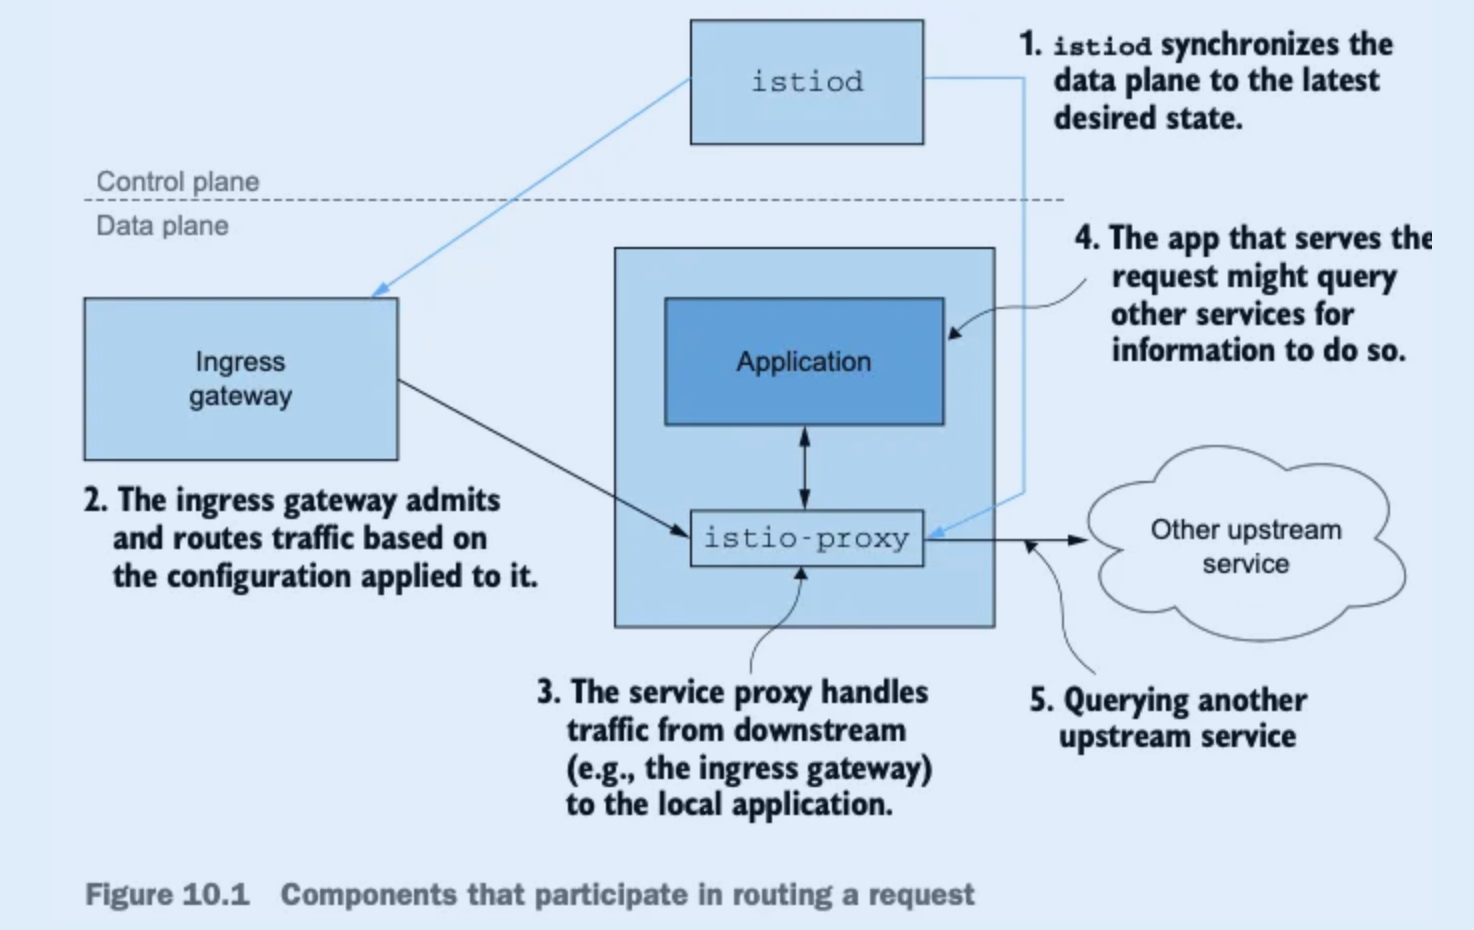
🔗 요청 처리에 참여하는 구성 요소들 (그림 10.1 기준)
- istiod: 데이터 플레인이 '원하는 상태(desired state)'를 유지하도록 조율.
- 인그레스 게이트웨이: 외부 트래픽을 클러스터 내부로 유입시킴.
- 서비스 프록시(Envoy): 접근 제어, 로컬 앱으로의 트래픽 처리.
- 애플리케이션: 실제로 요청을 처리하거나 다른 서비스로 요청을 전달.
⚠️ 이 중 어느 하나라도 잘못 설정되면 문제가 발생할 수 있고, 전체 시스템에 영향을 줄 수 있음.
🛠 주요 트러블슈팅 도구 및 주제
-
잘못 설정한 워크로드 트러블슈팅하기
→ 설정 오류가 있는 워크로드를 식별하고 수정하는 방법. -
istioctl 및 Kiali를 사용한 설정 감지/방지
→ istioctl analyze, Kiali UI를 통해 정책/리소스 충돌 및 누락 감지. -
istioctl을 통한 프록시 설정 분석
→ istioctl proxy-config, istioctl proxy-status 등으로 프록시 내부 상태 확인. -
Envoy 로그 이해하기
→ Envoy 로그를 통해 트래픽 흐름, 오류, 필터 체인 문제 파악. -
텔레메트리를 통한 앱 인사이트 확보
→ Prometheus, Grafana, Kiali, Jaeger 등을 활용한 모니터링 및 추적.
2.1 가장 흔한 실수: 잘못 설정한 데이터 플레인
📌 배경
Istio는 사람이 이해하기 쉬운 CRD (예: VirtualService, DestinationRule)를 통해 서비스 프록시 설정을 표현한다.
이 CRD들은 Envoy 설정으로 변환되어 데이터 플레인에 적용된다.
설정을 적용한 뒤 동작이 예상과 다르면, 대부분 설정 실수가 원인이다.
⚠️ 예제 시나리오
트래픽을 Istio 인그레스 게이트웨이를 통해 유입.
VirtualService 리소스로 요청을 다음처럼 분할 라우팅:
- 20% → version-v1
- 80% → version-v2
→ 보기에는 설정이 좋아 보이지만, DestinationRule이 누락된 상태!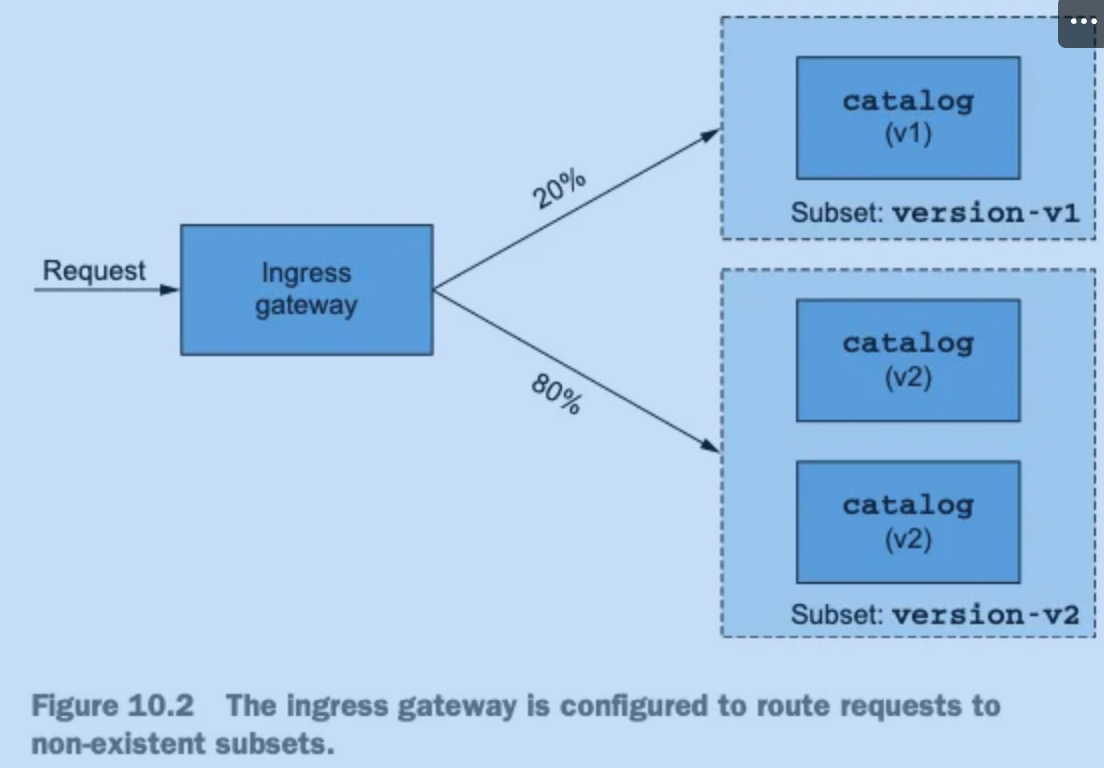
🧨 발생하는 문제
DestinationRule이 없으면 부분집합(version-v1, version-v2) 정의가 없어 라우팅 실패 발생.
결과적으로 모든 요청이 실패함.
🧪 실습 준비
Istio는 배포된 상태이며, 애플리케이션 구성 요소는 아직 없음.
앞서 진행한 실습이 있다면, 기존의 Deployment, Service, Gateway, VirtualService 정리 후 샘플 앱을 새로 배포해야 함.
# 샘플 애플리케이션 배포
kubectl apply -f services/catalog/kubernetes/catalog.yaml -n istioinaction # catalog v1 배포
serviceaccount/catalog created
service/catalog created
deployment.apps/catalog created

kubectl apply -f ch10/catalog-deployment-v2.yaml -n istioinaction # catalog v2 배포
deployment.apps/catalog-v2 created

kubectl apply -f ch10/catalog-gateway.yaml -n istioinaction # catalog-gateway 배포
gateway.networking.istio.io/catalog-gateway created

kubectl apply -f ch10/catalog-virtualservice-subsets-v1-v2.yaml -n istioinaction
virtualservice.networking.istio.io/catalog-v1-v2 created

# Gateway
cat ch10/catalog-gateway.yaml
apiVersion: networking.istio.io/v1alpha3
kind: Gateway
metadata:
  name: catalog-gateway
  namespace: istioinaction
spec:
  selector:
    istio: ingressgateway
  servers:
  - hosts:
    - "catalog.istioinaction.io"
    port:
      number: 80
      name: http
      protocol: HTTP

# VirtualService
cat ch10/catalog-virtualservice-subsets-v1-v2.yaml
apiVersion: networking.istio.io/v1alpha3
kind: VirtualService
metadata:
  name: catalog-v1-v2
  namespace: istioinaction
spec:
  hosts:
  - "catalog.istioinaction.io"
  gateways:
  - "catalog-gateway"
  http:
  - route:
    - destination:
        host: catalog.istioinaction.svc.cluster.local
        subset: version-v1
        port:
          number: 80
      weight: 20
    - destination:
        host: catalog.istioinaction.svc.cluster.local
        subset: version-v2
        port:
          number: 80
      weight: 80

# 확인
kubectl get deploy,svc -n istioinaction
NAME                         READY   UP-TO-DATE   AVAILABLE   AGE
deployment.apps/catalog      1/1     1            1           112s
deployment.apps/catalog-v2   2/2     2            2           90s

NAME              TYPE        CLUSTER-IP     EXTERNAL-IP   PORT(S)   AGE
service/catalog   ClusterIP   10.200.2.118   <none>        80/TCP    112s

kubectl get gw,vs -n istioinaction
NAME                                          AGE
gateway.networking.istio.io/catalog-gateway   82s

NAME                                               GATEWAYS              HOSTS                          AGE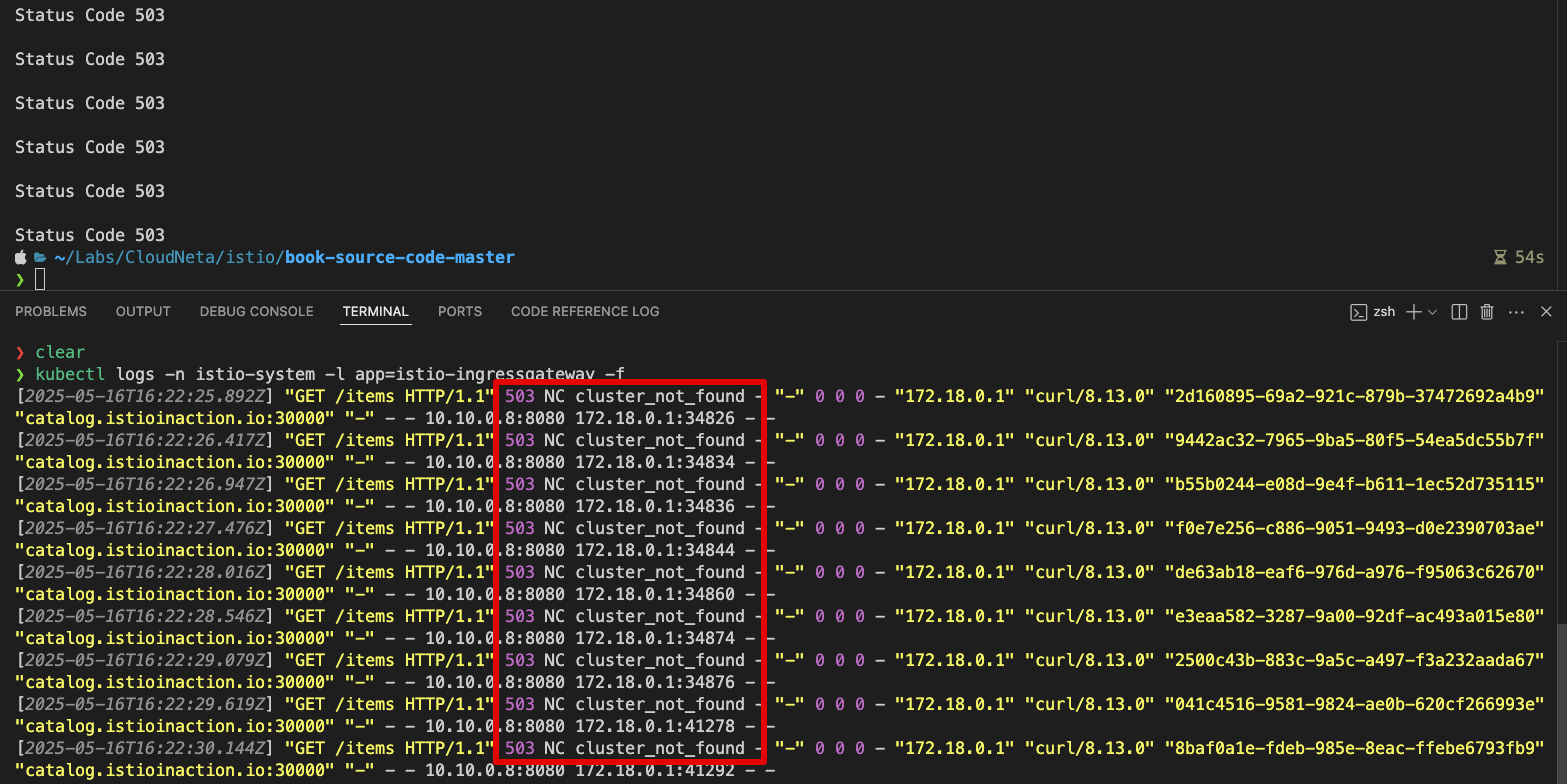
virtualservice.networking.istio.io/catalog-v1-v2 ["catalog-gateway"] ["catalog.istioinaction.io"] 67s- 통신 확인 : 부분집합 설정 누락으로
503 Service Unavailable출력 - Envoy
# 반복 호출 시도
for i in {1..100}; do curl http://catalog.istioinaction.io:30000/items -w "\nStatus Code %{http_code}\n"; sleep .5;  done
Status Code 503
Status Code 503
Status Code 503
...

# 로그 확인 : NC - NoClusterFound : Upstream cluster not found.
kubectl logs -n istio-system -l app=istio-ingressgateway -f
2025-05-16T15:47:52.730785Z     info    ads     XDS: Incremental Pushing:0 ConnectedEndpoints:2 Version:
2025-05-16T15:47:52.730806Z     info    cache   returned workload trust anchor from cache       ttl=23h59m59.269194979s
2025-05-16T15:47:52.730836Z     info    cache   returned workload trust anchor from cache       ttl=23h59m59.269165102s
2025-05-16T15:47:52.730970Z     info    cache   returned workload certificate from cache        ttl=23h59m59.269033426s
2025-05-16T15:47:52.731053Z     info    ads     SDS: PUSH request for node:istio-ingressgateway-6bb8fb6549-ll5cg.istio-system resources:1 size:4.0kB resource:default
2025-05-16T15:47:52.731068Z     info    ads     SDS: PUSH request for node:istio-ingressgateway-6bb8fb6549-ll5cg.istio-system resources:1 size:1.1kB resource:ROOTCA
2025-05-16T15:47:52.731095Z     info    cache   returned workload trust anchor from cache       ttl=23h59m59.268906376s
2025-05-16T15:47:53.916728Z     info    Readiness succeeded in 1.27634745s
2025-05-16T15:47:53.917190Z     info    Envoy proxy is ready
2025-05-16T16:18:55.276837Z     info    xdsproxy        connected to upstream XDS server: istiod.istio-system.svc:15012
...
[2025-05-16T23:23:50.625Z] "GET /items HTTP/1.1" 503 NC cluster_not_found - "-" 0 0 0 - "172.18.0.1" "curl/8.13.0" "4daf218e-c893-9215-b801-546c2b841ec1" "catalog.istioinaction.io:30000" "-" - - 10.10.0.8:8080 172.18.0.1:38442 - -
[2025-05-16T23:23:51.159Z] "GET /items HTTP/1.1" 503 NC cluster_not_found - "-" 0 0 0 - "172.18.0.1" "curl/8.13.0" "ff091611-04aa-9b08-9a62-1c0136b0dbc4" "catalog.istioinaction.io:30000" "-" - - 10.10.0.8:8080 172.18.0.1:38452 - -
[2025-05-16T23:23:51.706Z] "GET /items HTTP/1.1" 503 NC cluster_not_found - "-" 0 0 0 - "172.18.0.1" "curl/8.13.0" "838ab17d-db16-9b83-9b63-7e3322d61f2c" "catalog.istioinaction.io:30000" "-" - - 10.10.0.8:8080 172.18.0.1:38454 - -
...
📋 Envoy의 HTTP 및 TCP 오류 코드와 설명 - 링크
- 🔄 공통 (HTTP & TCP)
| 코드 | 의미 | 비고 |
|---|---|---|
| UH | Upstream 클러스터에 healthy한 호스트 없음 | 503 응답 포함 |
| UF | Upstream 연결 실패 | 503 응답 포함 |
| UO | Upstream overflow (서킷 브레이킹 발생) | 링크 / 503 응답 포함 |
| NR | 라우팅 경로 없음 또는 다운스트림 연결에 맞는 필터 체인 없음 | 링크 / 404 응답 포함 |
| URX | 재시도 횟수 또는 최대 연결 시도 초과 | HTTP 재시도, TCP 최대 연결 시도 |
| NC | Upstream 클러스터를 찾을 수 없음 | - |
| DT | 요청 또는 연결이 최대 지속 시간 초과 | HTTP, TCP |
- 🌐 HTTP 전용
| 코드 | 의미 | 비고 |
|---|---|---|
| DC | 다운스트림 연결 종료 | - |
| LH | 로컬 서비스가 헬스체크 요청 실패 | 링크 / 503 응답 포함 |
| UT | Upstream 요청 타임아웃 | 504 응답 포함 |
| LR | 로컬에서 연결 리셋 | 503 응답 포함 |
| UR | Upstream에서 연결 리셋 | 503 응답 포함 |
| UC | Upstream 연결 종료 | 503 응답 포함 |
| DI | fault injection으로 요청 처리 지연 | 링크 |
| FI | fault injection으로 응답 코드와 함께 요청 중단 | 링크 |
| RL | 로컬 rate limit로 인해 요청 제한 | 링크 / 429 응답 포함 |
| UAEX | 외부 인증 서비스에서 요청 거부 | - |
| RLSE | rate limit 서비스 오류로 요청 거부 | - |
| IH | 잘못된 헤더 값으로 인해 요청 거부 | 링크 / 400 응답 포함 |
| SI | 스트림 유휴로 인해 타임아웃 | 408 응답 포함 |
| DPE | 다운스트림 요청에서 HTTP 프로토콜 오류 발생 | - |
| UPE | Upstream 응답에서 HTTP 프로토콜 오류 발생 | - |
| UMSDR | Upstream 요청이 최대 스트림 지속 시간 초과 | - |
| OM | Overload Manager가 요청 종료 | - |
| DF | DNS 조회 실패로 요청 종료 | - |
2.2 데이터 플레인 문제 식별하기
✅ Istio 트러블슈팅의 시작점: 컨트롤 플레인 상태 확인
운영 중 발생하는 대부분의 문제는 데이터 플레인에서 나타나지만, 바로 데이터 플레인 디버깅부터 시작하는 것은 위험할 수 있습니다.
Istio의 컨트롤 플레인(istiod) 은 다음의 핵심 역할을 담당합니다:
- VirtualService, DestinationRule 같은 사용자 설정을 수집하고,
- 이를 Envoy 프록시가 이해할 수 있는 설정으로 변환한 뒤,
- 데이터 플레인에 동기화(push) 합니다.
따라서 문제가 발생했을 때 첫 번째 확인 포인트는:
❗ 컨트롤 플레인과 데이터 플레인이 정상적으로 동기화되고 있는가?
이를 무시하고 곧장 Envoy 설정이나 로그를 보기 시작하면, 실제로는 컨트롤 플레인 설정 오류나 동기화 실패였던 문제를 뒤늦게 발견해 시간을 낭비하게 될 수 있습니다.
📌 Istio 문제 해결의 첫 걸음은 데이터 플레인 디버깅이 아니라, 컨트롤 플레인과의 설정 동기화 여부를 검증하는 것이다.
2.2.1 데이터 플레인이 최신 상태인지 확인하는 방법
⏳ 데이터 플레인은 궁극적 일관성(Eventual Consistency) 을 따른다
Istio의 데이터 플레인 설정은 즉시 반영되는 것이 아니라, 컨트롤 플레인과의 동기화 이후에야 일관된 상태로 수렴되도록 설계되어 있습니다.
✔️ 주요 요점:
서비스, 파드 상태, 설정 변경 등은 컨트롤 플레인을 거쳐야만 데이터 플레인에 반영됩니다.
예를 들어, 파드 중 하나가 비정상이 되더라도:
- 먼저 쿠버네티스가 이를 감지하고,
- 이후 컨트롤 플레인이 이를 인식한 뒤,
- 해당 엔드포인트(IP)를 프록시 설정에서 제거합니다.
이 전체 과정에는 지연이 발생할 수 있으며, 이로 인해 일시적인 비일관성이 나타날 수 있습니다.
그러나 시간이 지나면 컨트롤 플레인이 최신 상태로 회복되고, 데이터 플레인도 정상적인 라우팅 구성을 갖추게 됩니다.
📌 데이터 플레인의 설정은 항상 최신은 아니지만, 결국 일관된 상태로 수렴한다.
이 점을 이해하고 트러블슈팅 시 고려하는 것이 중요합니다.
- 워크로드가 비정상이 된 후 데이터 플레인 구성 요소의 설정이 업데이트될 때까지 일련의 이벤트
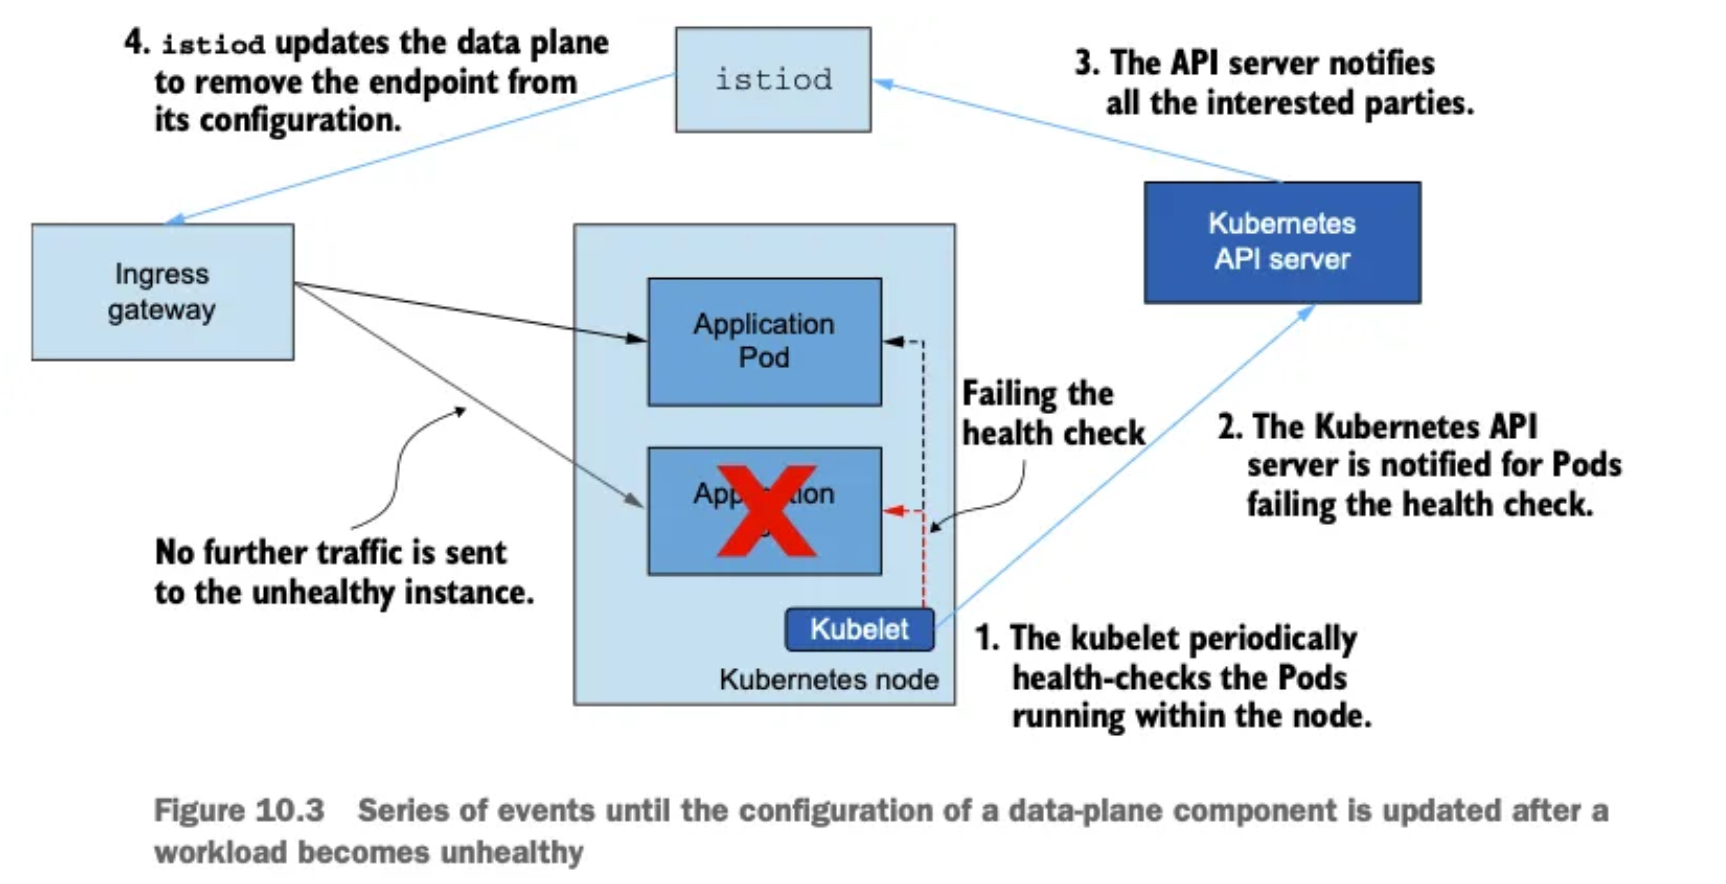
- kubelet은 주기적으로 노드 내에서 실행 중인 파드의 상태를 확인한다.
- 쿠버네티스 API서버는 상태 확인을 실패한 파드를 통보받는다.
- API 서버가 모든 이해 당사자들에게 알린다.
- istiod가 데이터 플레인을 업데이트해 설정에서 엔드포인트를 제거한다.
- 건강하지 않은 인스턴스로 더 이상 트래픽을 전송되지 않는다.
📌 워크로드와 이벤트 개수가 늘어나는 대규모 클러스터에서는 데이터 플레인을 동기화하는 데 필요한 시간도 비례해 늘어난다.
- istioctl proxy-status 로 데이터 플레인이 최신 설정과 동기화했는지 확인하자.
docker exec -it myk8s-control-plane istioctl proxy-status
NAME                                                   CLUSTER        CDS        LDS        EDS        RDS          ECDS         ISTIOD                    VERSION
catalog-6cf4b97d-6n2hz.istioinaction                   Kubernetes     SYNCED     SYNCED     SYNCED     SYNCED       NOT SENT     istiod-8d74787f-b9gv9     1.17.8
catalog-v2-56c97f6db-n5rx8.istioinaction               Kubernetes     SYNCED     SYNCED     SYNCED     SYNCED       NOT SENT     istiod-8d74787f-b9gv9     1.17.8
catalog-v2-56c97f6db-tskb9.istioinaction               Kubernetes     SYNCED     SYNCED     SYNCED     SYNCED       NOT SENT     istiod-8d74787f-b9gv9     1.17.8
istio-egressgateway-85df6b84b7-zsfh9.istio-system      Kubernetes     SYNCED     SYNCED     SYNCED     NOT SENT     NOT SENT     istiod-8d74787f-b9gv9     1.17.8
istio-ingressgateway-6bb8fb6549-ll5cg.istio-system     Kubernetes     SYNCED     SYNCED     SYNCED     SYNCED       NOT SENT     istiod-8d74787f-b9gv9     1.17.8
🍎 아래는 Istio의 컨트롤 플레인(istiod)과 데이터 플레인(Envoy) 간의 동기화 상태(Sync Status) 를 나타내는 상태 코드 요약 표입니다:
| 상태 | 설명 | 가능한 원인 |
|---|---|---|
| SYNCED | Envoy가 istiod가 보낸 마지막 설정을 성공적으로 수신 및 확인함. | 정상 상태. 설정이 동기화됨. |
| NOT SENT | istiod가 Envoy에 아직 아무 설정도 보내지 않음. | 보통 보낼 설정이 없기 때문 (예: 아직 워크로드에 적용할 VirtualService나 Gateway가 없음). |
| STALE | istiod가 Envoy에 설정을 보냈지만 확인을 받지 못함. | - istiod 과부하 - Envoy와 istiod 간 연결 부족 또는 끊김 - Istio 버그 가능성 있음. |
이 테이블은 istioctl proxy-status 명령 출력의 STATUS 컬럼에 표시되는 상태를 해석할 때 유용합니다.
- 그런데 우리의 출력에는 설정을 받지 못한 stale 상태의 워크로드가 없다.
- 따라서 컨트롤 플레인에 문제가 있을 가능성은 낮으므로 데이터 플레인 구성 요소를 조사해야 한다.
- 데이터 플레인 구성 요소에서 가장 일반적인 문제는 잘못된 워크로드 설정이다.
- 키알리를 사용하면 설정을 빠르게 검증할 수 있다.
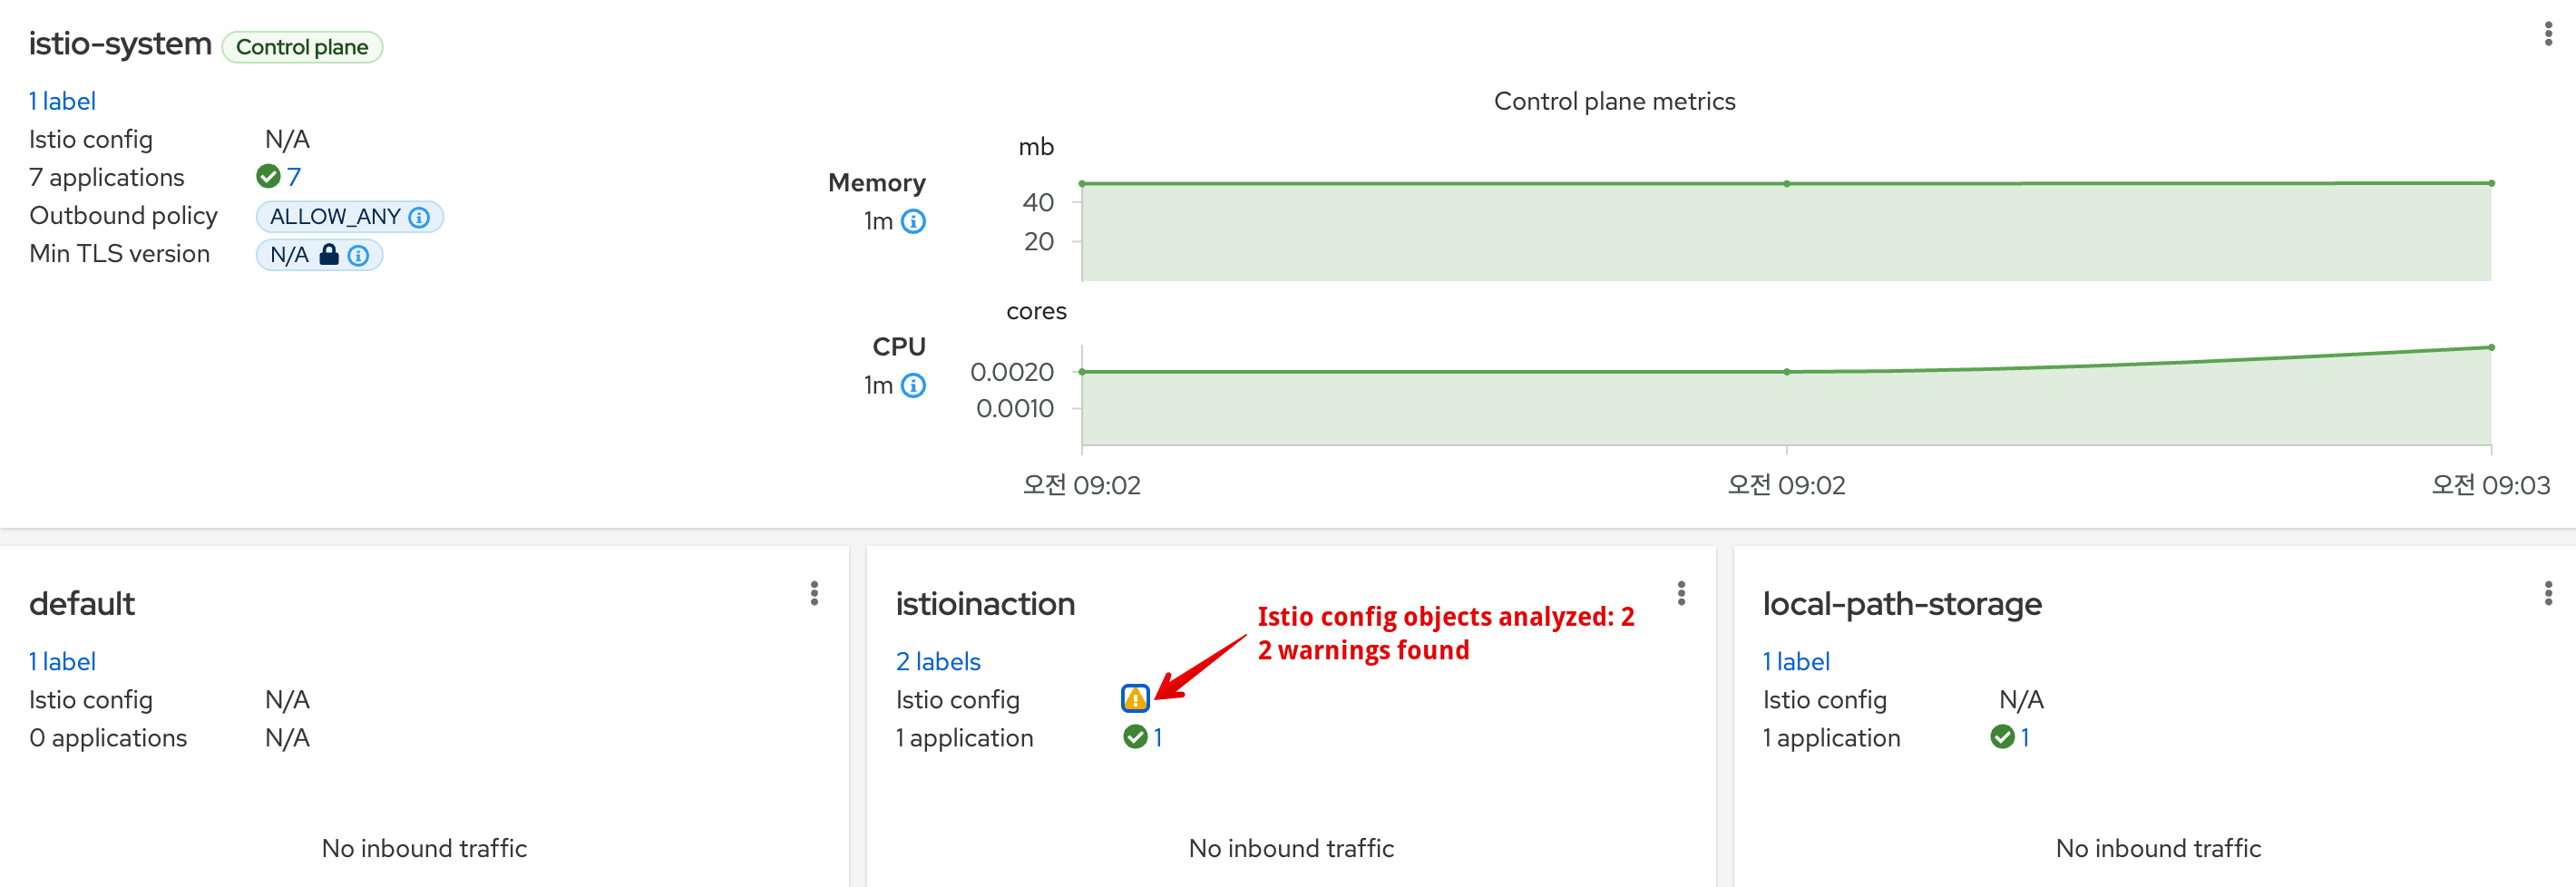
2.2.2 키알리로 잘못된 설정 발견하기
- 대시보드 Overview에 istioinaction 네임스페이스에 경고 표시 확인 → 클릭 시 Istio Config 로 이동 ⇒ 클릭 시 내장 편집기에서 경고 메시지 확인
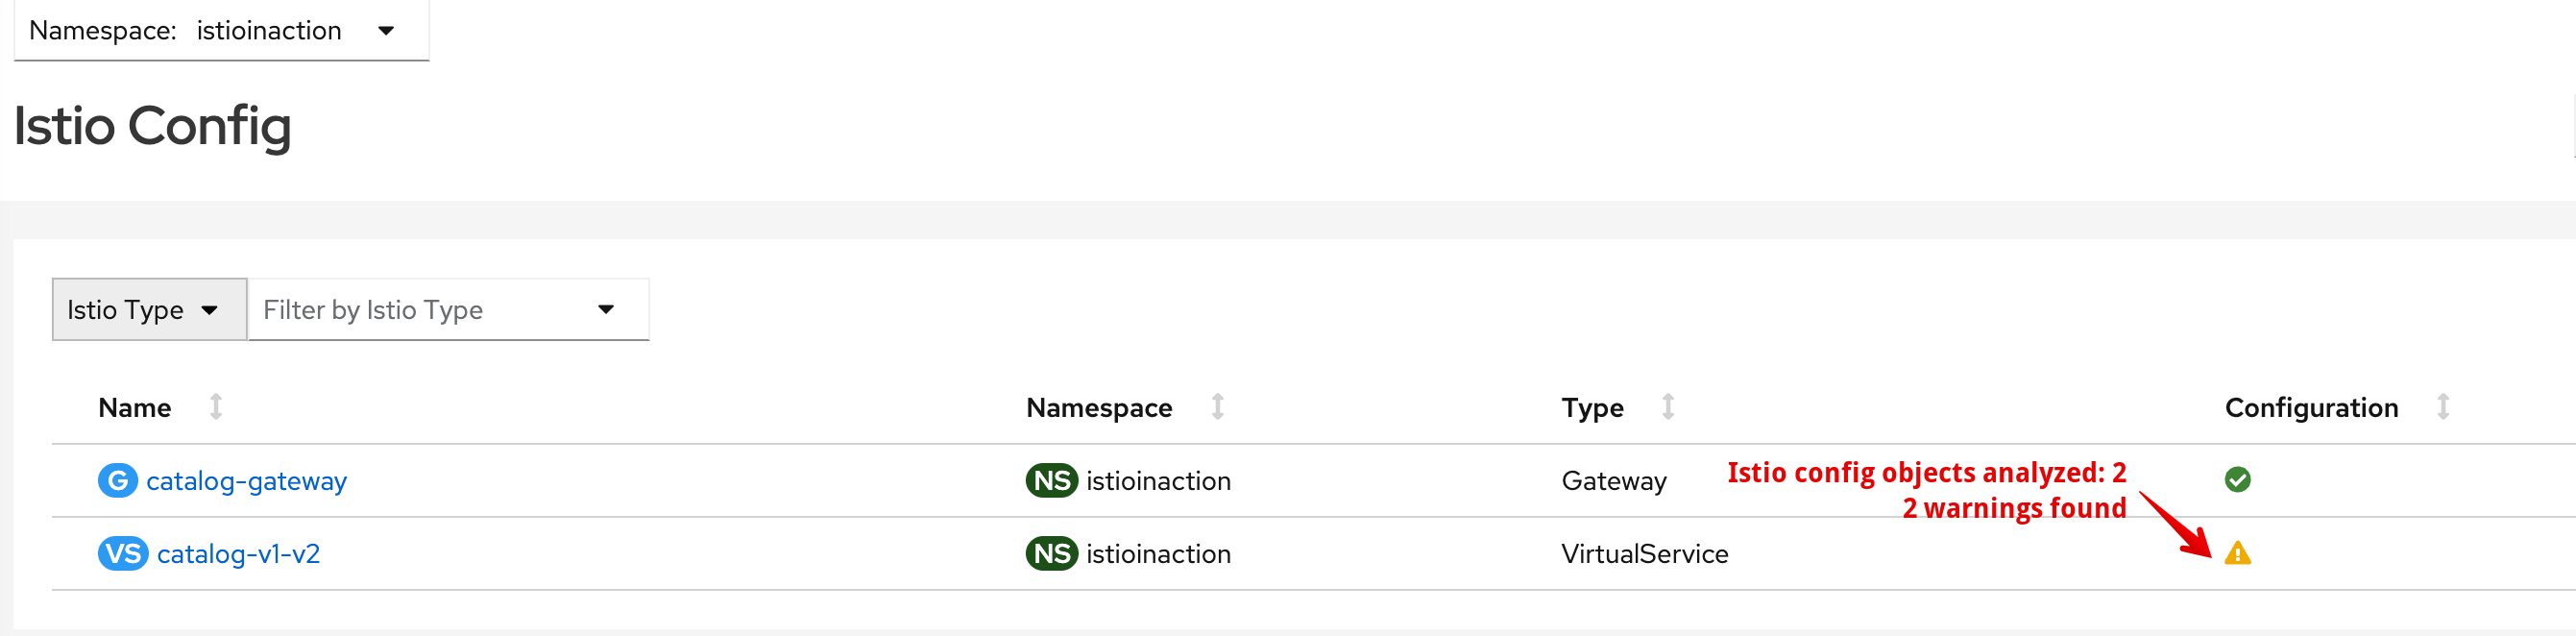
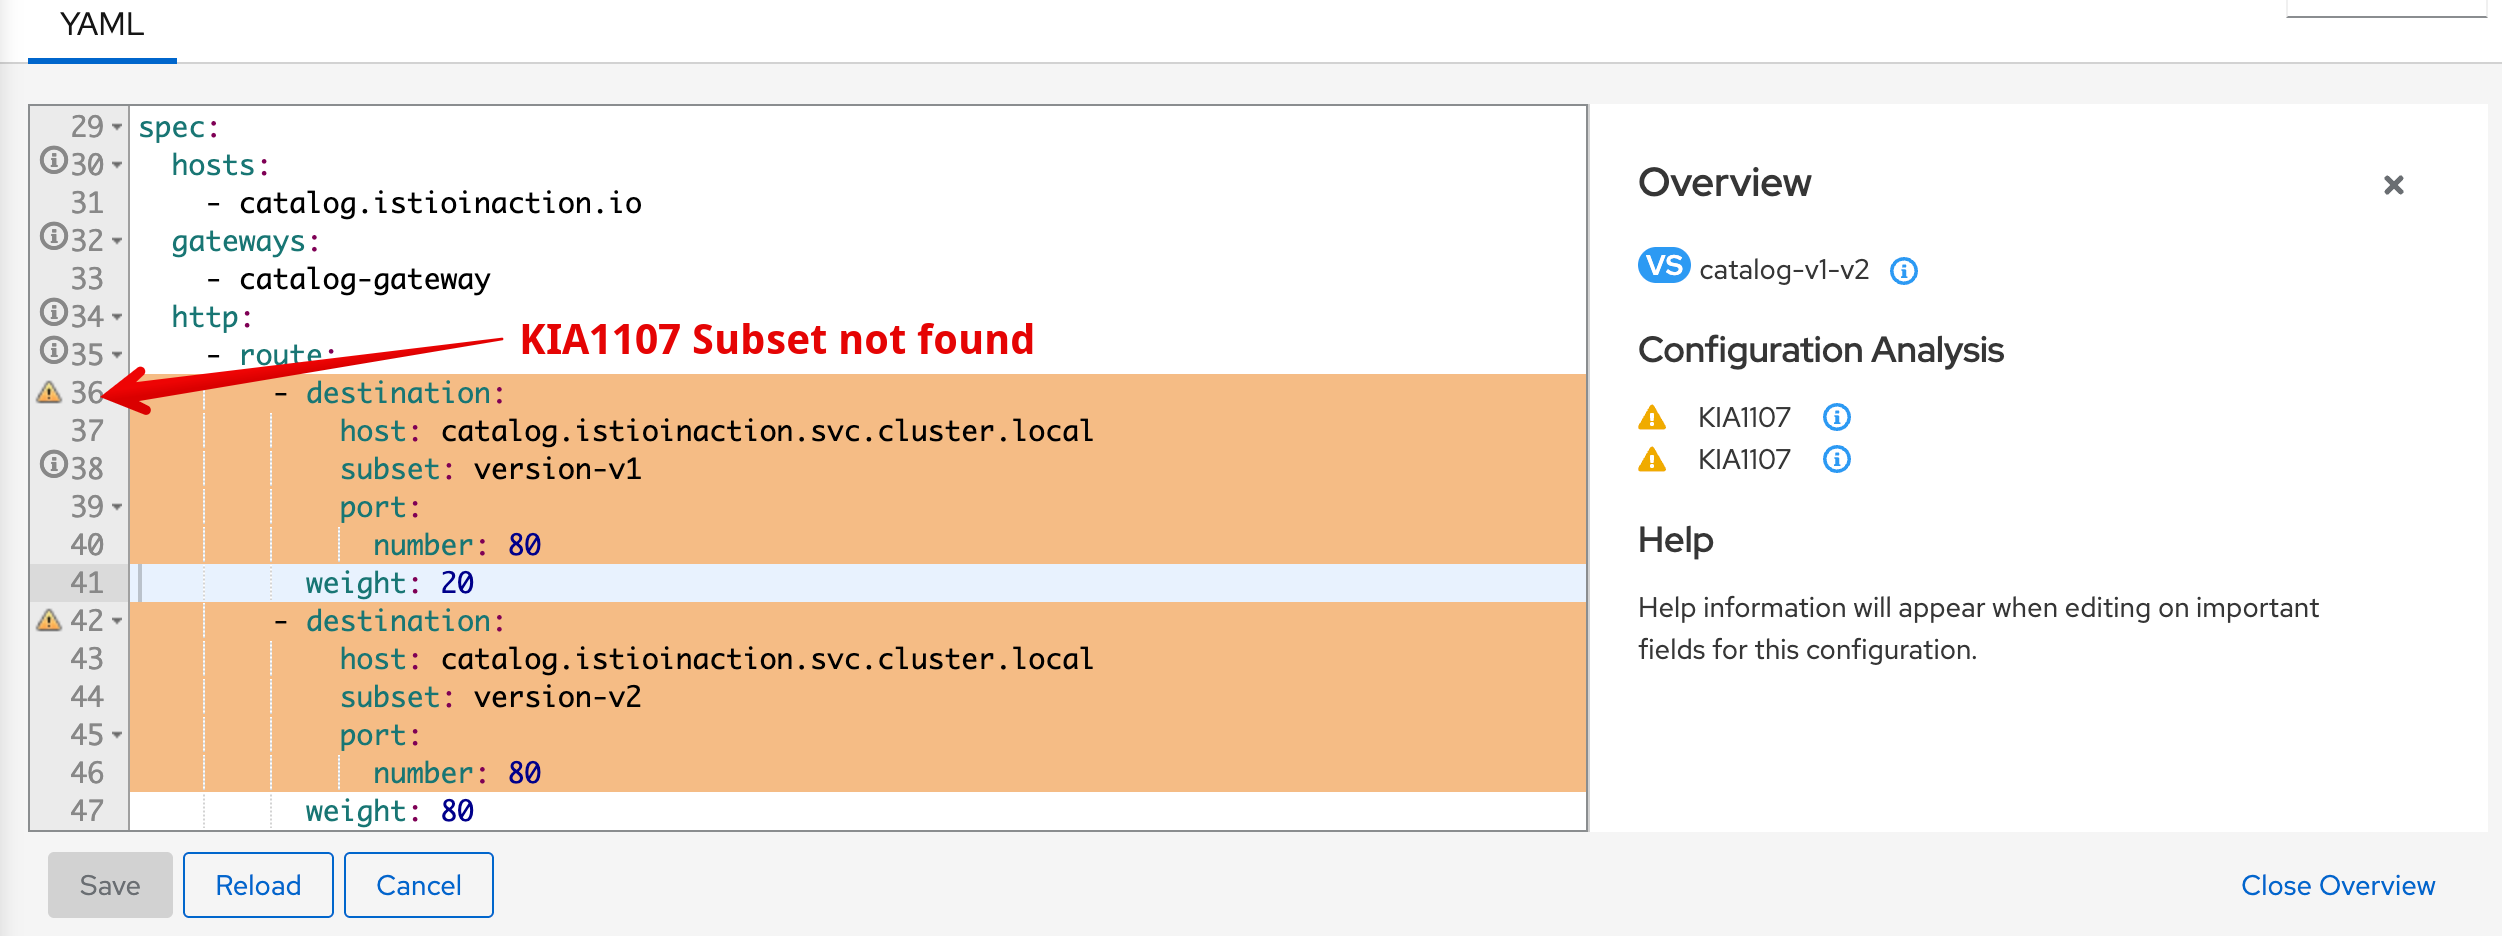
- 경고 아이콘 위로 마우스를 올리면 경고 메시지 ‘KIA1107 Subnet not found’를 보여준다. 자세한 건 키알리 공식 문서 참고 - Docs
- 예를 들어 다음은 KIA1107 경고의 해결책 부분이다.
- 존재하지 않은 부분집합을 가리키는 루트를 수정하자. 아마 부분집합 이름의 오타를 수정하거나 DestinationRule 에서 빠트린 부분집합을 정의하자.
- 예를 들어 다음은 KIA1107 경고의 해결책 부분이다.
- 키알리 검증은 도움이 되므로, 워크로드가 예상대로 동작하지 않을 때 취하는 첫 초지 중 하나여야 한다.
- 다음 조치는 또 다른 검증 모음을 제공하는 istioctl을 사용하는 것이다.
2.2.3 istioctl로 이스티오 설정 분석하기
💁🏻♀️ istioctl analyze는 Istio 설정을 사전에 검증하거나 문제를 진단하는 데 유용한 강력한 분석 도구입니다. 다음과 같은 특징을 가집니다:
- 사전 진단: 리소스를 클러스터에 적용하기 전에 설정 오류를 찾아낼 수 있습니다.
- 사후 분석: 이미 문제가 발생한 실행 중인 클러스터에도 실행할 수 있습니다.
🛠️ 모듈형 분석기 구조: 다양한 분석기(analyzer)가 특정 설정 오류를 감지하며, 쉽게 확장 가능해 Istio의 발전과 함께 지속적으로 개선됩니다.
#
docker exec -it myk8s-control-plane istioctl analyze -h
Analyze Istio configuration and print validation messages

Usage:
  istioctl analyze <file>... [flags]

Examples:
  # Analyze the current live cluster
  istioctl analyze

  # Analyze the current live cluster for a specific revision
  istioctl analyze --revision 1-16

  # Analyze the current live cluster, simulating the effect of applying additional yaml files
  istioctl analyze a.yaml b.yaml my-app-config/

  # Analyze the current live cluster, simulating the effect of applying a directory of config recursively
  istioctl analyze --recursive my-istio-config/

  # Analyze yaml files without connecting to a live cluster
  istioctl analyze --use-kube=false a.yaml b.yaml my-app-config/

  # Analyze the current live cluster and suppress PodMissingProxy for pod mypod in namespace 'testing'.
  istioctl analyze -S "IST0103=Pod mypod.testing"

  # Analyze the current live cluster and suppress PodMissingProxy for all pods in namespace 'testing',
  # and suppress MisplacedAnnotation on deployment foobar in namespace default.
  istioctl analyze -S "IST0103=Pod *.testing" -S "IST0107=Deployment foobar.default"

  # List available analyzers
  istioctl analyze -L

Flags:
  -A, --all-namespaces            Analyze all namespaces
      --color                     Default true.  Disable with '=false' or set $TERM to dumb (default true)
      --failure-threshold Level   The severity level of analysis at which to set a non-zero exit code. Valid values: [Info Warning Error] (default Error)
  -h, --help                      help for analyze
      --ignore-unknown            Don't complain about un-parseable input documents, for cases where analyze should run only on k8s compliant inputs.
  -L, --list-analyzers            List the analyzers available to run. Suppresses normal execution.
      --meshConfigFile string     Overrides the mesh config values to use for analysis.
  -o, --output string             Output format: one of [log json yaml] (default "log")
      --output-threshold Level    The severity level of analysis at which to display messages. Valid values: [Info Warning Error] (default Info)
  -R, --recursive                 Process directory arguments recursively. Useful when you want to analyze related manifests organized within the same directory.
      --revision string           analyze a specific revision deployed. (default "default")
  -S, --suppress stringArray      Suppress reporting a message code on a specific resource. Values are supplied in the form <code>=<resource> (e.g. '--suppress "IST0102=DestinationRule primary-dr.default"'). Can be repeated. You can include the wildcard character '*' to support a partial match (e.g. '--suppress "IST0102=DestinationRule *.default" ).
      --timeout duration          The duration to wait before failing (default 30s)
  -k, --use-kube                  Use live Kubernetes cluster for analysis. Set --use-kube=false to analyze files only. (default true)
  -v, --verbose                   Enable verbose output

Global Flags:
      --context string      The name of the kubeconfig context to use
  -c, --kubeconfig string   Kubernetes configuration file
  -n, --namespace string    Config namespace
      --vklog Level         number for the log level verbosity. Like -v flag. ex: --vklog=9

docker exec -it myk8s-control-plane istioctl analyze --list-analyzers
* annotations.K8sAnalyzer:
    Checks for misplaced and invalid Istio annotations in Kubernetes resources
* applicationUID.Analyzer:
    Checks invalid application UID
* auth.AuthorizationPoliciesAnalyzer:
    Checks the validity of authorization policies
* deployment.MultiServiceAnalyzer:
    Checks association between services and pods
* deprecation.DeprecationAnalyzer:
    Checks for deprecated Istio types and fields
* destinationrule.CaCertificateAnalyzer:
    Checks if caCertificates is set when TLS mode is SIMPLE/MUTUAL
* envoyfilter.EnvoyPatchAnalyzer:
    Checks an envoyFilters
* gateway.CertificateAnalyzer:
    Checks a gateway certificate
* gateway.ConflictingGatewayAnalyzer:
    Checks a gateway's selector, port number and hosts
* gateway.IngressGatewayPortAnalyzer:
    Checks a gateway's ports against the gateway's Kubernetes service ports
* gateway.SecretAnalyzer:
    Checks a gateway's referenced secrets for correctness
* injection.Analyzer:
    Checks conditions related to Istio sidecar injection
* injection.ImageAnalyzer:
    Checks the image of auto-injection configured with the running proxies on pods
* injection.ImageAutoAnalyzer:
    Makes sure that Pods and Deployments with `image: auto` are going to be injected
* meshnetworks.MeshNetworksAnalyzer:
    Check the validity of MeshNetworks in the cluster
* schema.ValidationAnalyzer.AuthorizationPolicy:
    Runs schema validation as an analyzer on 'AuthorizationPolicy' resources
* schema.ValidationAnalyzer.DestinationRule:
    Runs schema validation as an analyzer on 'DestinationRule' resources
* schema.ValidationAnalyzer.EnvoyFilter:
    Runs schema validation as an analyzer on 'EnvoyFilter' resources
* schema.ValidationAnalyzer.Gateway:
    Runs schema validation as an analyzer on 'Gateway' resources
* schema.ValidationAnalyzer.MeshConfig:
    Runs schema validation as an analyzer on 'MeshConfig' resources
* schema.ValidationAnalyzer.MeshNetworks:
    Runs schema validation as an analyzer on 'MeshNetworks' resources
* schema.ValidationAnalyzer.PeerAuthentication:
    Runs schema validation as an analyzer on 'PeerAuthentication' resources
* schema.ValidationAnalyzer.ProxyConfig:
    Runs schema validation as an analyzer on 'ProxyConfig' resources
* schema.ValidationAnalyzer.RequestAuthentication:
    Runs schema validation as an analyzer on 'RequestAuthentication' resources
* schema.ValidationAnalyzer.ServiceEntry:
    Runs schema validation as an analyzer on 'ServiceEntry' resources
* schema.ValidationAnalyzer.Sidecar:
    Runs schema validation as an analyzer on 'Sidecar' resources
* schema.ValidationAnalyzer.Telemetry:
    Runs schema validation as an analyzer on 'Telemetry' resources
* schema.ValidationAnalyzer.VirtualService:
    Runs schema validation as an analyzer on 'VirtualService' resources
* schema.ValidationAnalyzer.WasmPlugin:
    Runs schema validation as an analyzer on 'WasmPlugin' resources
* schema.ValidationAnalyzer.WorkloadEntry:
    Runs schema validation as an analyzer on 'WorkloadEntry' resources
* schema.ValidationAnalyzer.WorkloadGroup:
    Runs schema validation as an analyzer on 'WorkloadGroup' resources
* service.PortNameAnalyzer:
    Checks the port names associated with each service
* serviceentry.Analyzer:
    Checks the validity of ServiceEntry
* sidecar.DefaultSelectorAnalyzer:
    Validates that there aren't multiple sidecar resources that have no selector
* sidecar.SelectorAnalyzer:
    Validates that sidecars that define a workload selector match at least one pod, and that there aren't multiple sidecar resources that select overlapping pods
* telemetry.ProviderAnalyzer:
    Validates that providers in telemery resource is valid
* virtualservice.ConflictingMeshGatewayHostsAnalyzer:
    Checks if multiple virtual services associated with the mesh gateway have conflicting hosts
* virtualservice.DestinationHostAnalyzer:
    Checks the destination hosts associated with each virtual service
* virtualservice.DestinationRuleAnalyzer:
    Checks the destination rules associated with each virtual service
* virtualservice.GatewayAnalyzer:
    Checks the gateways associated with each virtual service
* virtualservice.JWTClaimRouteAnalyzer:
    Checks the VirtualService using JWT claim based routing has corresponding RequestAuthentication
* virtualservice.RegexAnalyzer:
    Checks regex syntax
* webhook.Analyzer:
    Checks the validity of Istio webhooks

docker exec -it myk8s-control-plane istioctl analyze -n istioinaction
Error [IST0101] (VirtualService istioinaction/catalog-v1-v2) Referenced host+subset in destinationrule not found: "catalog.istioinaction.svc.cluster.local+version-v1"
Error [IST0101] (VirtualService istioinaction/catalog-v1-v2) Referenced host+subset in destinationrule not found: "catalog.istioinaction.svc.cluster.local+version-v2"
Error: Analyzers found issues when analyzing namespace: istioinaction.
See https://istio.io/v1.17/docs/reference/config/analysis for more information about causes and resolutions.

# 이전 명령어 종료 코드 확인
echo $? # (참고) 0 성공
79

# 출력은 부분집합을 찾지 못했음을 보여준다. 오류 메시지 외에 istio 오류 코드 IST0101 도 제공- 워크로드별로 설정 오류 찾기
- describe는 워크로드별 설정을 기술하는데 사용한다.
- describe는 워크로드 하나에 직간접적으로 영향을 미치는 이스티오 설정을 분석해 요약 내용을 출력한다.
- 이 요약은 다음과 같은 워크로드 관련 질문에 답변을 제공한다.
- 이 워크로드는 서비스 메시의 일부인가?
- 어떤 VirtualService 와 DestinationRule 이 적용되는가?
- 상호 인증 트래픽을 요구하는가?
- 실행해볼께요
#
kubectl get pod -n istioinaction -l app=catalog -o jsonpath='{.items[0].metadata.name}'
catalog-6cf4b97d-6n2hz

CATALOG_POD1=$(kubectl get pod -n istioinaction -l app=catalog -o jsonpath='{.items[0].metadata.name}')

# 단축키 : experimental(x), describe(des)
docker exec -it myk8s-control-plane istioctl experimental describe -h
Describe resource and related Istio configuration

Usage:
  istioctl experimental describe [flags]
  istioctl experimental describe [command]

Aliases:
  describe, des

Available Commands:
  pod         Describe pods and their Istio configuration [kube-only]
  service     Describe services and their Istio configuration [kube-only]

Flags:
  -h, --help   help for describe

Global Flags:
      --context string          The name of the kubeconfig context to use
  -i, --istioNamespace string   Istio system namespace (default "istio-system")
  -c, --kubeconfig string       Kubernetes configuration file
  -n, --namespace string        Config namespace
      --vklog Level             number for the log level verbosity. Like -v flag. ex: --vklog=9

Use "istioctl experimental describe [command] --help" for more information about a command.

docker exec -it myk8s-control-plane istioctl x des pod -n
istioinaction $CATALOG_POD1
Pod: catalog-6cf4b97d-6n2hz
   Pod Revision: default
   Pod Ports: 3000 (catalog), 15090 (istio-proxy)
--------------------
Service: catalog
   Port: http 80/HTTP targets pod port 3000
--------------------
Effective PeerAuthentication:
   Workload mTLS mode: PERMISSIVE


Exposed on Ingress Gateway http://172.18.0.2
VirtualService: catalog-v1-v2
   WARNING: No destinations match pod subsets (checked 1 HTTP routes)
      Warning: Route to subset version-v1 but NO DESTINATION RULE defining subsets!
      Warning: Route to subset version-v2 but NO DESTINATION RULE defining subsets!

# 문제 해결 후 확인
cat ch10/catalog-destinationrule-v1-v2.yaml
---
apiVersion: networking.istio.io/v1alpha3
kind: DestinationRule
metadata:
  name: catalog
  namespace: istioinaction
spec:
  host: catalog.istioinaction.svc.cluster.local
  subsets:
  - name: version-v1
    labels:
      version: v1
  - name: version-v2
    labels:
      version: v2

kubectl apply -f ch10/catalog-destinationrule-v1-v2.yaml
destinationrule.networking.istio.io/catalog created

docker exec -it myk8s-control-plane istioctl x des pod -n istioinaction $CATALOG_POD1
Pod: catalog-6cf4b97d-6n2hz
   Pod Revision: default
   Pod Ports: 3000 (catalog), 15090 (istio-proxy)
--------------------
Service: catalog
   Port: http 80/HTTP targets pod port 3000
DestinationRule: catalog for "catalog.istioinaction.svc.cluster.local"
   Matching subsets: version-v1  # 일치하는 부분집합
      (Non-matching subsets version-v2)  # 일치하지 않은 부분집합
   No Traffic Policy
--------------------
Effective PeerAuthentication:
   Workload mTLS mode: PERMISSIVE


Exposed on Ingress Gateway http://172.18.0.2
VirtualService: catalog-v1-v2  # 이 파드로 트래픽을 라우팅하는 VirtualService
   Weight 20%

# 다음 점검 방법을 위해 오류 상황으로 원복
kubectl delete -f ch10/catalog-destinationrule-v1-v2.yaml
destinationrule.networking.istio.io "catalog" deleted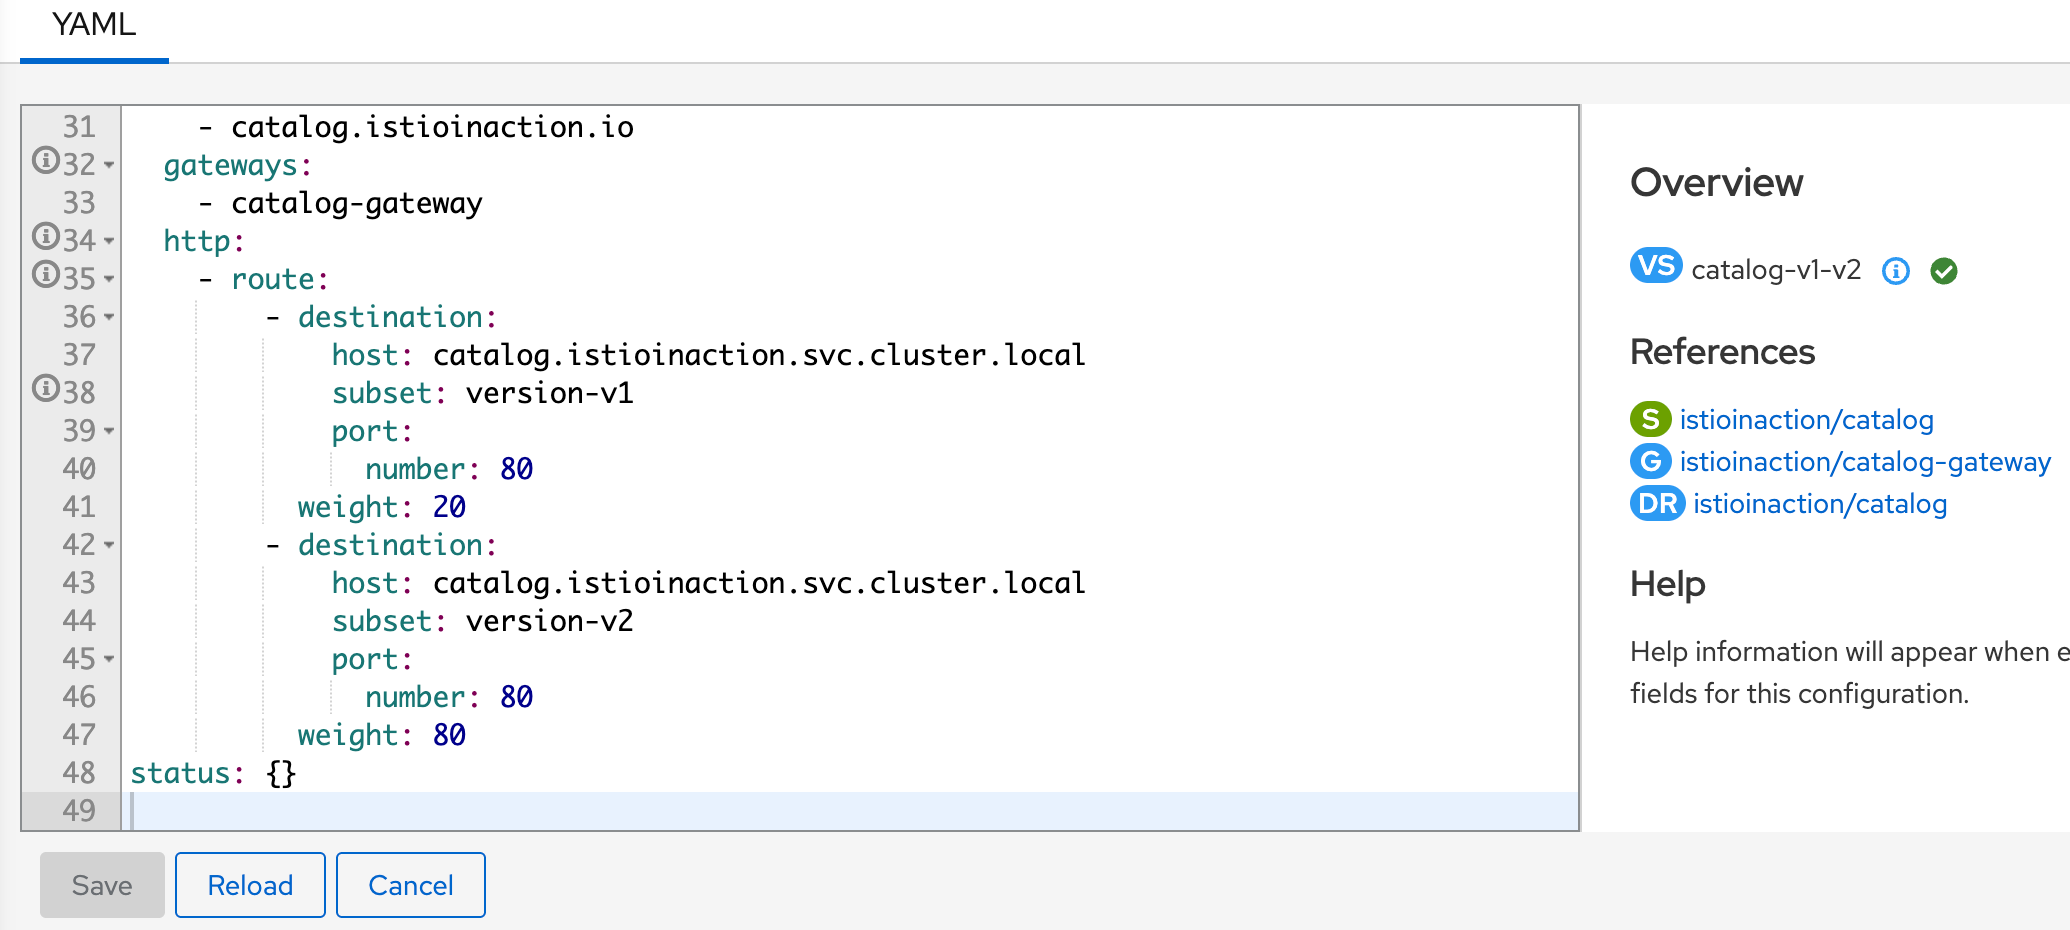
- 하위 명령어 analyze 와 describe 모두 설정에서 흔한 오류를 식별하는 데 도움이 되며, 보통은 해결책을 제시하기에 충분한다.
- 이 명령어로 드러나지 않은 문제나 해결 지침을 충분히 제공하지 않은 문제는 더 깊이 파고들 필요가 있다.
2.3 엔보이 설정에서 수동으로 잘못된 설정 발견하기
2.3.1 엔보이 관리(admin) 인터페이스
- 엔보이 관리 인터페이스는 프록시의 특정 부분(로그 수준 증가 등)을 수정하는 기능과 엔보이 설정을 노출한다.
- 이 인터페이스는 모든 서비스 프록시에서 포트 15000으로 접근 할 수 있다.
#
kubectl port-forward deploy/catalog -n istioinaction 15000:15000
open http://localhost:15000

# 현재 적재한 엔보이 설정 출력 : 데이터양이 많다!
curl -s localhost:15000/config_dump | wc -l
  14168  # 출력은 너무 커서 기본적으로 사람이 읽을 수 없다.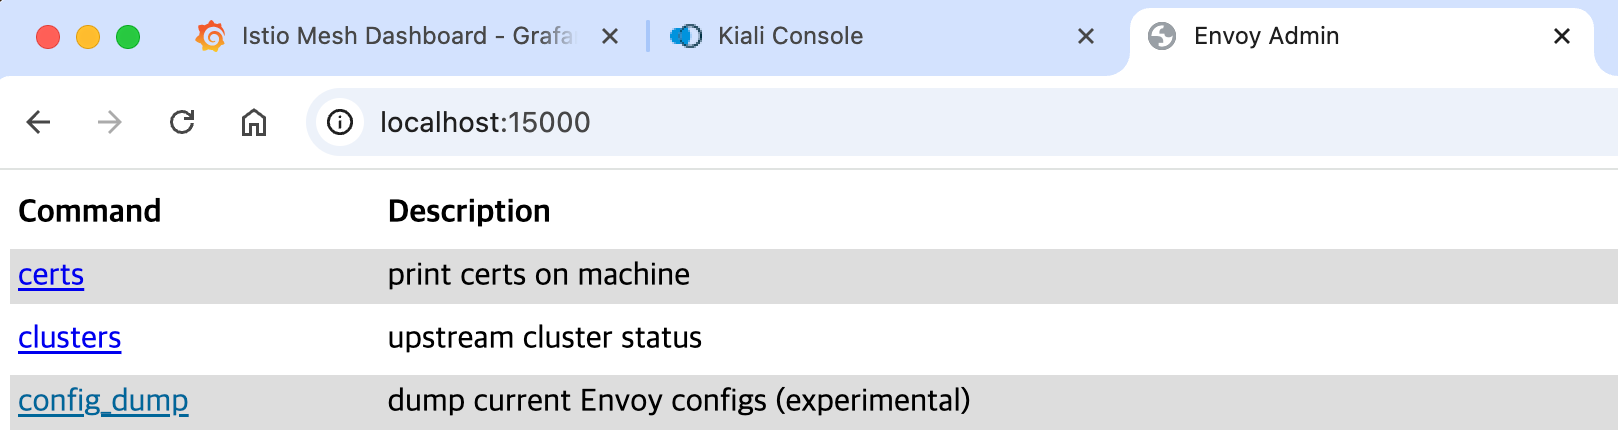
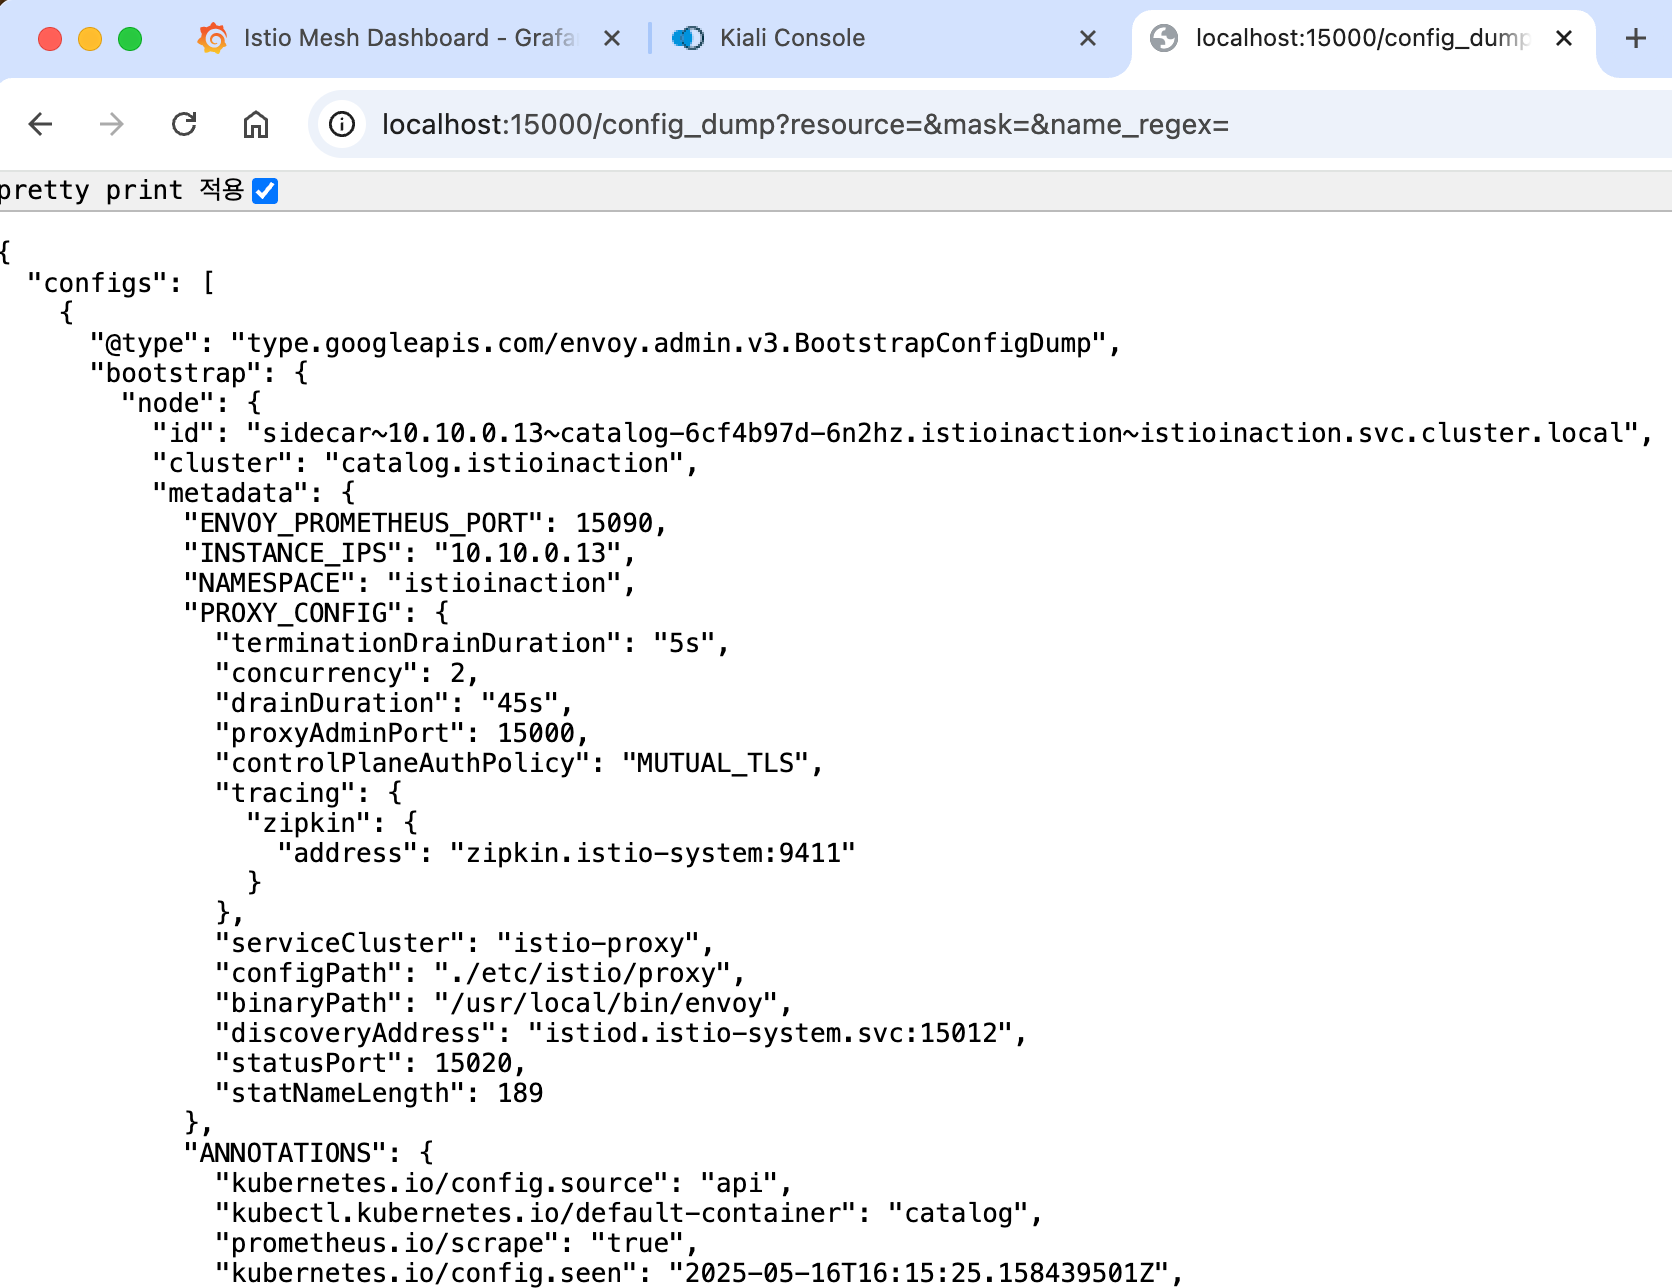
- 이런 이유로 istioctl은 출력을 작은 뭉치로 필터링하는 도구를 제공해 가독성을 높이고 이해를 돕는다.
- 엔보이 관리 인터페이스
2.3.2 istioctl로 프록시 설정 쿼리하기
✅ istioctl proxy-config 명령어를 사용하면 엔보이 xDS API를 기반으로 워크로드의 프록시 설정을 가져오고 필터링할 수 있다. 하위 명령어 참고.
- cluster : 클러스터 설정을 가져온다
- endpoint : 엔드포인트 설정을 가져온다
- listener : 리스너 설정을 가져온다
- route : 루트 설정을 가져온다
- secret : 시크릿 설정을 가져온다
✅ 요청을 라우팅하기 위한 엔보이 API의 상호작용
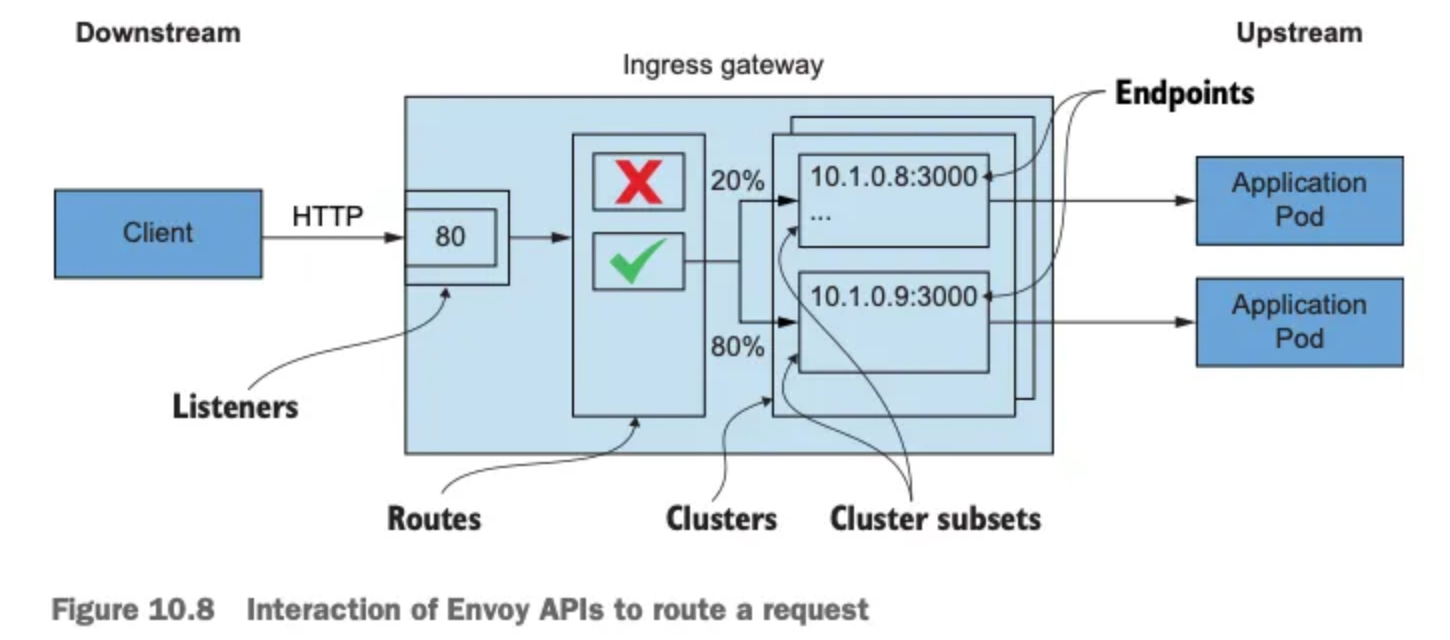
✅ 엔보이 API는 다음과 같은 영향을 미친다.
- 엔보이 리스너 listeners 는 네트워크 설정(다운스트림 트래픽을 프록시로 허용하는 IP 주소 및 포트 등)을 정의한다.
- 허용된 커넥션에 HTTP 필터 filter 체인이 만들어진다. 체인에서 가장 중요한 필터는 라우터 필터로, 고급 라우팅 작업을 수행한다.
- 엔보이 루트 routes 는 가상 호스트를 클러스터에 일치시키는 규칙 집합이다. 루트는 순서대로 처리된다.
- 일치하는 첫 번째 항목이 트래픽을 워크로드 클러스터로 라우팅하는 데 사용된다.
- 루트는 정적으로 설정할 수 도 있지만, 이스티오에서는 RDS를 사용해 동적으로 설정한다.
- 엔보이 클러스터 clusters 에서, 각 클러스터에는 유사한 워크로드에 대한 엔드포인트 그룹이 있다.
- 부분집합 Subsets 은 클러스터 내에서 워크로드를 더 분할하는 데 사용하며 덕분에 정밀한 트래픽 관리가 가능해진다.
- 엔보이 엔드포인트는 요청을 처리하는 워크로드의 IP 주소를 나타낸다.
✅ 엔보이 리스터 설정 쿼리하기
- 먼저 인그레스 게이트웨이 NodePort 30000 포트로 도착하는 트래픽이 클러스터로 허용되는지 부터 확인하자.
- 트래픽을 허용하는 것은 엔보이 리스너의 역할로, 이스티오에서는 Gateway 리소스를 설정한다.
- 게이트웨이의 리스너 설정을 쿼리하고 80 포트에서 트래픽이 허용되는지 확인하자
#
docker exec -it myk8s-control-plane istioctl proxy-config listener deploy/istio-ingressgateway -n istio-system
ADDRESS PORT  MATCH DESTINATION
0.0.0.0 8080  ALL   Route: http.8080 # 8080 포트에 대한 요청은 루트 http.8080에 따라 라우팅하도록 설정된다
0.0.0.0 15021 ALL   Inline Route: /healthz/ready*
0.0.0.0 15090 ALL   Inline Route: /stats/prometheus*
## 리스터는 8080 포트에 설정돼 있다.
## 그 리스너에서 트래픽은 http.8080 이라는 루트에 따라 라우팅된다.- 포트 8080이 올바른 포트인지 확인하자.
- 트래픽이 nodePort 30000 포트에 인입 시, istio-ingressgateway 서비스는 인그레스 게이트웨이(파드)에 tcp 8080 포트로 전달(도달)하게 됨.
- 만약 k8s 클러스터 내부에서 clusterIP 혹은 서비스명으로 tcp 80 요청 시 → 인그레스 게이트웨이(파드)에 tcp 8080 포트로 전달(도달)하게 됨.
- 그 트래픽을 인그레스 게이트웨이로 허용하는 리스너가 존재함을 확인했다.
- 또한 이 리스너의 라우팅은 루트 http.8080이 수행한다는 사실도 확인했다.
- 트래픽이 nodePort 30000 포트에 인입 시, istio-ingressgateway 서비스는 인그레스 게이트웨이(파드)에 tcp 8080 포트로 전달(도달)하게 됨.
#
kubectl get svc -n istio-system  istio-ingressgateway -o yaml | grep "ports:" -A10
  ports:
  - name: status-port
    nodePort: 30840
    port: 15021
    protocol: TCP
    targetPort: 15021
  - name: http2
    nodePort: 30000
    port: 80
    protocol: TCP
    targetPort: 8080
✅ 엔보이 루트 설정 쿼리하기
- 엔보이 루트 설정은 트래픽을 라우팅할 클러스터를 결정하는 규칙 집합을 정의한다.
- 이스티오는 엔보이 루트를 VirtualService 리소스로 설정한다. 한편, 클러스터는 디스커비리로 자동 설정되거나 DestinationRule 리소스로 정의된다.
- http.8080 루트의 트래픽을 어느 클러스터로 라우팅할지 알아내기 위해 설정을 쿼리해보자.
- 이 요약은 호스트
catalog.istioinaction.io의 트래픽 중 URL이 경로 접두사/*과 일치하는 것이 istioinaction 네임스페이스의 catalog 서비스에 있는 catalog VirtualService 로 라우팅됨을 보여준다.
- 이 요약은 호스트
# http.8080 루트의 트래픽을 어느 클러스터로 라우팅할지 알아내기 위해 설정을 쿼리
docker exec -it myk8s-control-plane istioctl proxy-config routes deploy/istio-ingressgateway -n istio-system --name http.8080
NAME          DOMAINS                      MATCH     VIRTUAL SERVICE
http.8080     catalog.istioinaction.io     /*        catalog-v1-v2.istioinaction

## 호스트 catalog.istioinaction.io 의 트래픽 중 URL이 경로 접두사 /*과 일치하는 것이 istioinaction 네임스페이스의 catalog 서비스에 있는 catalog VirtualService 로 라우팅됨을 보여준다.

# 세부 정보 확인
docker exec -it myk8s-control-plane istioctl proxy-config routes deploy/istio-ingressgateway -n istio-system --name http.8080 -o json
...
                "routes": [
                    {
                        "match": {
                            "prefix": "/" # 일치해야 하는 라우팅 규칙
                        },
                        "route": {
                            "weightedClusters": {
                                "clusters": [ # 규칙이 일치할 때 트래픽을 라우팅하는 클러스터
                                    {
                                        "name": "outbound|80|version-v1|catalog.istioinaction.svc.cluster.local",
                                        "weight": 20
                                    },
                                    {
                                        "name": "outbound|80|version-v2|catalog.istioinaction.svc.cluster.local",
                                        "weight": 80
                                    }
                                ],
                                "totalWeight": 100
                            },
...- 클러스터 출력 :
{DIRECTION} | {PORT} | {SUBSET} | {FQDN}⇒ 루트가 일치할 때 트래픽을 수신하는 클러스터가 둘임을 보여줌.- outbound|80|version-v1|catalog.istioinaction.svc.cluster.local
- outbound|80|version-v2|catalog.istioinaction.svc.cluster.local
✅ 엔보이 클러스터 설정 쿼리하기
- 엔보이 클러스터 설정은 요청을 라우팅할 수 있는 백엔드 서비스를 정의한다.
- 클러스터는 부하를 여러 인스턴스나 엔드포인트에 분산한다.
- 이 엔드포인트(보통 IP 주소)는 최종 사용자 트래픽을 처리하는 개별 워크로드 인스턴스를 나타낸다.
- istioctl을 사용하면 인그레스 게이트웨이가 알고 있는 클러스터를 쿼리할 수 있지만, 클러스터가 많다.
- 라우팅할 수 있는 모든 백엔드 서비스마다 하나씩 설정되기 때문이다.
istioctl proxy-config clusters의 플래그 direction, fqdn, port, subent 을 사용하면 특정 클러스터만 출력할 수 있다.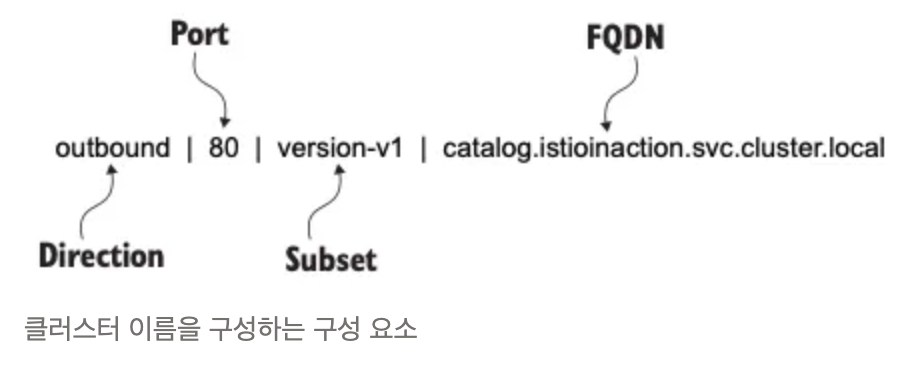
- 클러스터 중 하나를 쿼리해보자.
#
docker exec -it myk8s-control-plane istioctl proxy-config clusters deploy/istio-ingressgateway -n istio-system \
--fqdn catalog.istioinaction.svc.cluster.local --port 80
SERVICE FQDN                                PORT     SUBSET     DIRECTION     TYPE     DESTINATION RULE
catalog.istioinaction.svc.cluster.local     80       -          outbound      EDS

#
docker exec -it myk8s-control-plane istioctl proxy-config clusters deploy/istio-ingressgateway -n istio-system \
--fqdn catalog.istioinaction.svc.cluster.local --port 80 --subset version-v1
SERVICE FQDN     PORT     SUBSET     DIRECTION     TYPE     DESTINATION RULE
## 부분 집합 subset version-v1 이나 version-v2 용 클러스터는 없었다! ⇒ 이 부분 집합에 대한 클러스터가 없으면 요청은 실패한다.- 정상 설정 전에 istioctl analyze 명령어를 사용해서, 설정할 yaml 파일이 식별한 서비스 메시 오류를 고칠 수 있는지 확인해보자.
# 해당 파일이 없을 경우 'copy & paste'로 작성 후 진행 하자
docker exec -it myk8s-control-plane cat /istiobook/ch10/catalog-destinationrule-v1-v2.yaml
apiVersion: networking.istio.io/v1alpha3
kind: DestinationRule
metadata:
  name: catalog
  namespace: istioinaction
spec:
  host: catalog.istioinaction.svc.cluster.local
  subsets:
  - name: version-v1
    labels:
      version: v1
  - name: version-v2
    labels:
      version: v2

# istioctl analyze 명령어를 사용해서, 설정할 yaml 파일이 식별한 서비스 메시 오류를 고칠 수 있는지 확인
docker exec -it myk8s-control-plane istioctl analyze /istiobook/ch10/catalog-destinationrule-v1-v2.yaml -n istioinaction
✔ No validation issues found when analyzing /istiobook/ch10/catalog-destinationrule-v1-v2.yaml.

## 리소스 적용의 영향을 시뮬레이션해보니 클러스터에 검증 오류가 없어진다.
## 즉, 이 DestinationRule을 적용하면 클러스터 설정의 문제가 고쳐진다는 것이다.- 이제 문제를 해결해보자.
# 문제 해결
cat ch10/catalog-destinationrule-v1-v2.yaml
kubectl apply -f ch10/catalog-destinationrule-v1-v2.yaml
destinationrule.networking.istio.io/catalog created

# 확인
docker exec -it myk8s-control-plane istioctl proxy-config clusters deploy/istio-ingressgateway -n istio-system \
--fqdn catalog.istioinaction.svc.cluster.local --port 80
SERVICE FQDN                                PORT     SUBSET         DIRECTION     TYPE     DESTINATION RULE
catalog.istioinaction.svc.cluster.local     80       -              outbound      EDS      catalog.istioinaction
catalog.istioinaction.svc.cluster.local     80       version-v1     outbound      EDS      catalog.istioinaction
catalog.istioinaction.svc.cluster.local     80       version-v2     outbound      EDS      catalog.istioinaction

CATALOG_POD1=$(kubectl get pod -n istioinaction -l app=catalog -o jsonpath='{.items[0].metadata.name}')
docker exec -it myk8s-control-plane istioctl x des pod -n istioinaction $CATALOG_POD1
Pod: catalog-6cf4b97d-6n2hz
   Pod Revision: default
   Pod Ports: 3000 (catalog), 15090 (istio-proxy)
--------------------
Service: catalog
   Port: http 80/HTTP targets pod port 3000
DestinationRule: catalog for "catalog.istioinaction.svc.cluster.local"
   Matching subsets: version-v1
      (Non-matching subsets version-v2)
   No Traffic Policy
--------------------
Effective PeerAuthentication:
   Workload mTLS mode: PERMISSIVE


Exposed on Ingress Gateway http://172.18.0.2
VirtualService: catalog-v1-v2
   Weight 20%

docker exec -it myk8s-control-plane istioctl analyze -n istioinaction
✔ No validation issues found when analyzing namespace: istioinaction.

# 호출 확인
curl http://catalog.istioinaction.io:30000/items
[
  {
    "id": 1,
    "color": "amber",
    "department": "Eyewear",
    "name": "Elinor Glasses",
    "price": "282.00"
  },
  {
    "id": 2,
    "color": "cyan",
    "department": "Clothing",
    "name": "Atlas Shirt",
    "price": "127.00"
  },
  {
    "id": 3,
    "color": "teal",
    "department": "Clothing",
    "name": "Small Metal Shoes",
    "price": "232.00"
  },
  {
    "id": 4,
    "color": "red",
    "department": "Watches",
    "name": "Red Dragon Watch",
    "price": "232.00"
  }
]
✅ 클러스터는 어떻게 설정되는가?
- 엔보이 프록시에는 클러스터 엔드포인트를 발견하기 위한 여러 가지 방법이 있다.
- 사용 중인 방법은 istioctl에서 version-v1 클러스터를 JSON 형식으로 출력해보면 알 수 있다.
#
docker exec -it myk8s-control-plane istioctl proxy-config clusters deploy/istio-ingressgateway -n istio-system \
--fqdn catalog.istioinaction.svc.cluster.local --port 80 --subset version-v1 -o json
...
        "name": "outbound|80|version-v1|catalog.istioinaction.svc.cluster.local",
        "type": "EDS",
        "edsClusterConfig": {
            "edsConfig": {
                "ads": {},
                "initialFetchTimeout": "0s",
                "resourceApiVersion": "V3"
            },
            "serviceName": "outbound|80|version-v1|catalog.istioinaction.svc.cluster.local"
        },
...- 이 출력 내용은 edsClusterConfig 가 엔드포인트를 쿼리하는 데 ADS Aggregated Discovery Service 를 사용하도록 설정됐음을 보여준다.
- 서비스 이름
outbound|80|version-v1|catalog.istioinaction.svc.cluster.local은 ADS를 쿼리할 때 엔드포인트용 필터로 사용한다.
✅ 엔보이 클러스터 엔드포인트 쿼리하기
- 이제 엔보이 프록시가 서비스 이름으로 ADS를 쿼리하도록 설정된 것을 알았으니, 인그레스 게이트웨이에서 클러스터의 엔드포인트를 istioctl proxy-config endpoints 명령어로 수동으로 쿼리하는데 이 정보를 사용할 수 있다.
# 엔드포인트 정보 확인 : IP 정보
docker exec -it myk8s-control-plane istioctl proxy-config endpoints deploy/istio-ingressgateway -n istio-system \
--cluster "outbound|80|version-v1|catalog.istioinaction.svc.cluster.local"
ENDPOINT            STATUS      OUTLIER CHECK     CLUSTER
10.10.0.13:3000     HEALTHY     OK                outbound|80|version-v1|catalog.istioinaction.svc.cluster.local

# 해당 IP 쿼리로 실제 워크로드가 있는지 확인
kubectl get pod -n istioinaction --field-selector status.podIP=10.10.0.13 -owide --show-labels
NAME                     READY   STATUS    RESTARTS   AGE   IP           NODE                  NOMINATED NODE   READINESS GATES   LABELS
catalog-6cf4b97d-6n2hz   2/2     Running   0          10h   10.10.0.13   myk8s-control-plane   <none>           <none>            app=catalog,pod-template-hash=6cf4b97d,security.istio.io/tlsMode=istio,service.istio.io/canonical-name=catalog,service.istio.io/canonical-revision=v1,version=v1

## 실제로 있다! 트래픽을 워크로드로 라우팅하도록 서비스 프록시를 설정하는 엔보이 API 리소스 체인 전체를 완성했다.
2.3.3 애플리케이션 문제 트러블슈팅하기
- 마이크로서비스 기반 애플리케이션에서 서비스 프록시가 생성하는 로그와 메트릭은 성능 병목을 일으키는 서비스 디스커버리, 빈번하게 실패하는 엔드포인트 식별, 성능 저하 감지 등과 같은 많은 문제를 트러블슈팅하는 데 도움이 된다.
- 엔보이 액세스 로그와 메트릭을 사용해 이 문제들 중 일부를 트러블슈팅해본다. 그러나 먼저, 트러블슈팅할 문제가 생기도록 서비스를 업데이트하자.
✅ 간헐적으로 제한 시간을 초과하는 느린 워크로드 준비하기
- 설정 전 정상 통신 환경 상태 확인
# 신규 터미널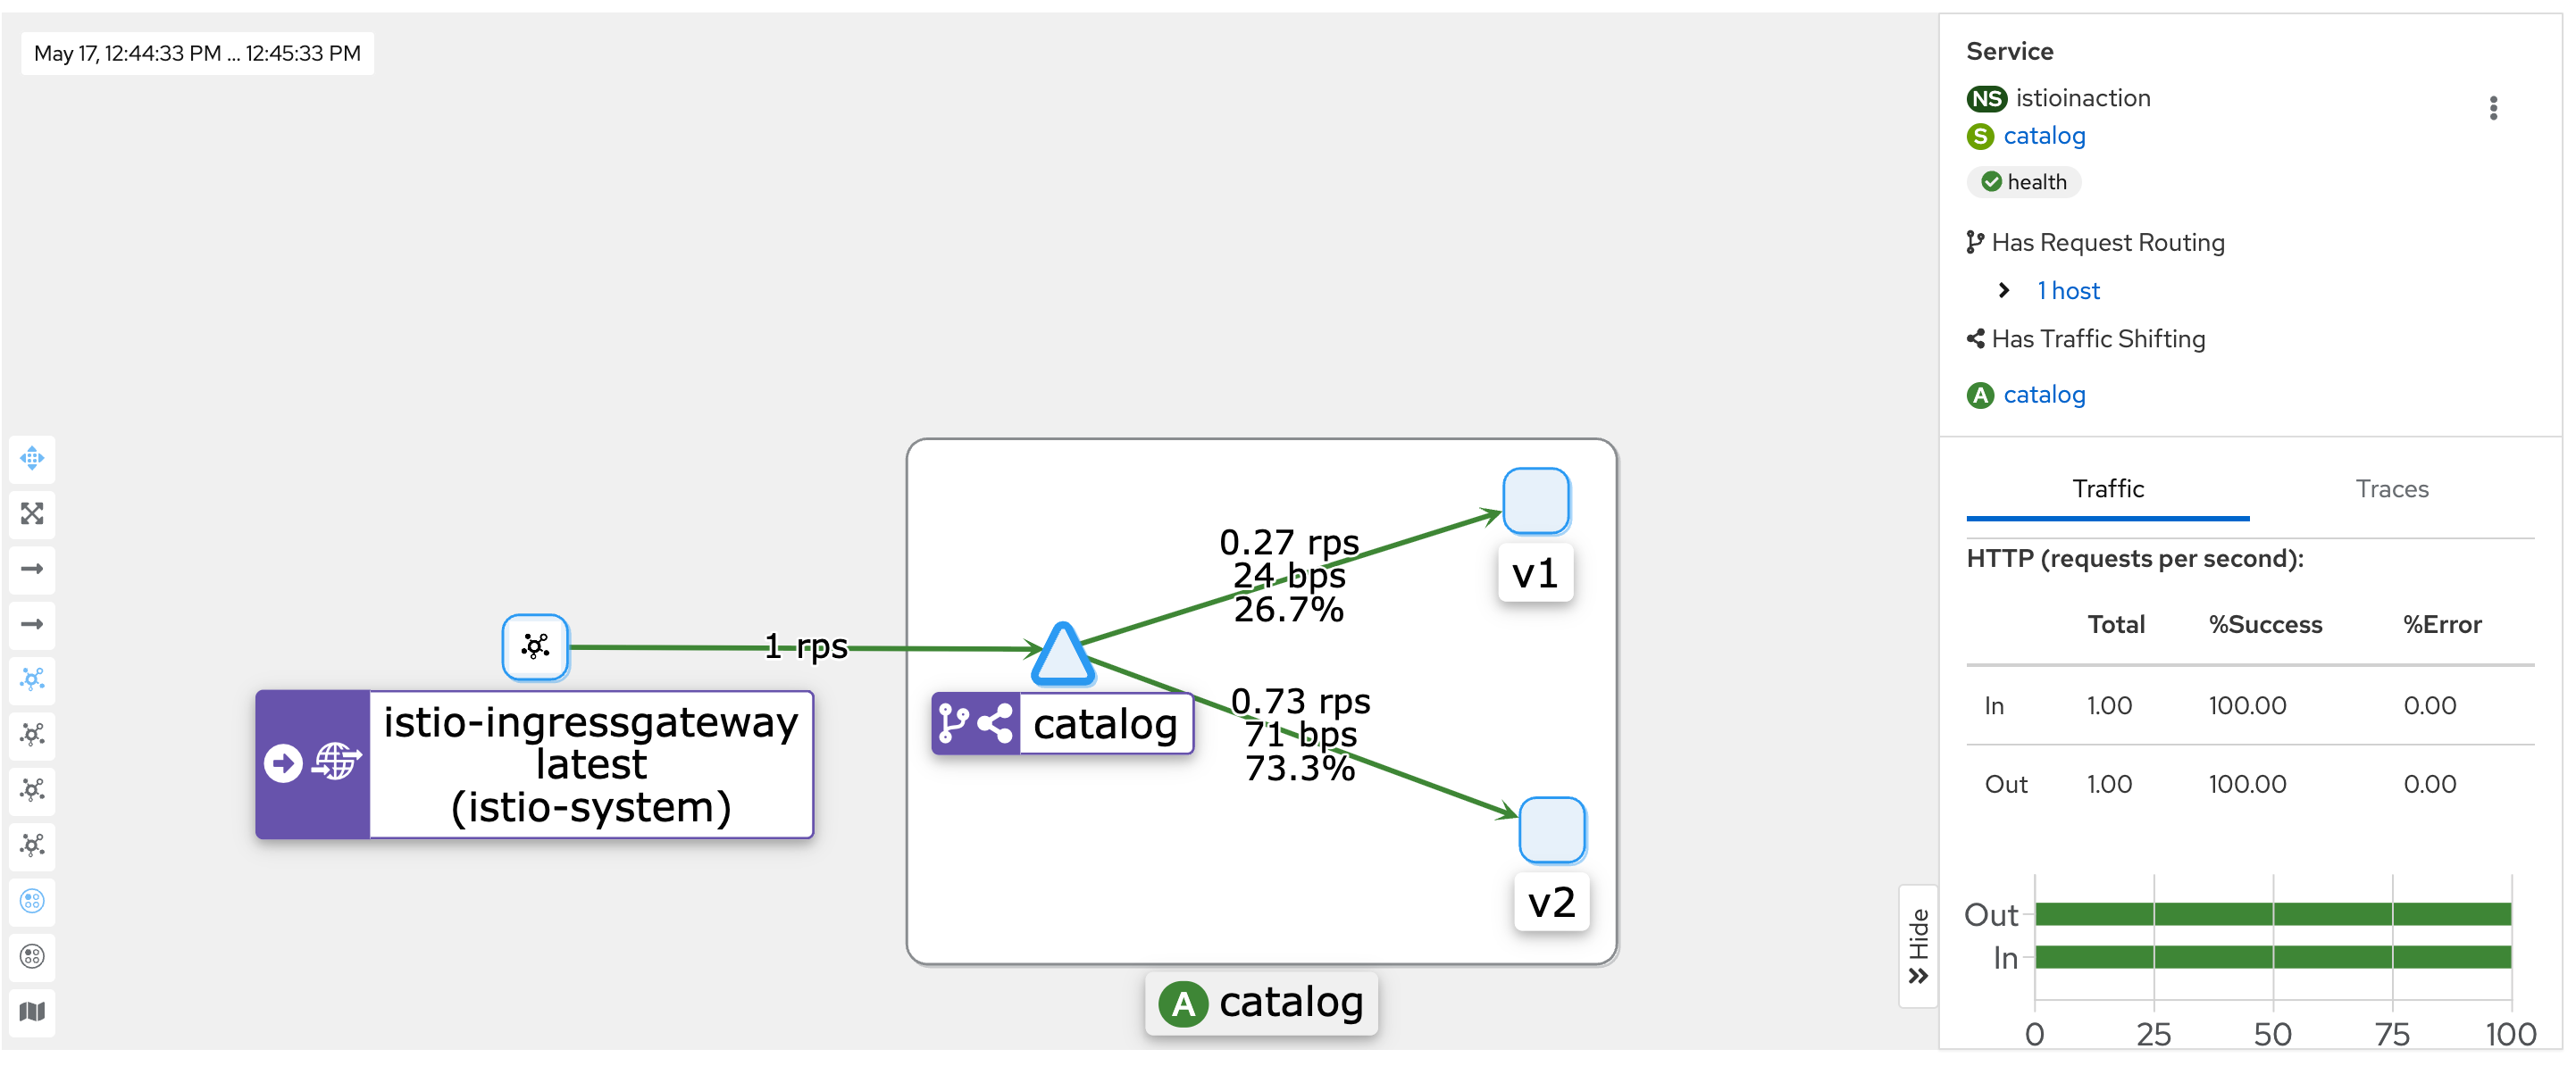
for in in {1..9999}; do curl http://catalog.istioinaction.io:30000/items -w "\nStatus Code %{http_code}\n"; sleep 1; done- kiali : catalog - 100% 성공
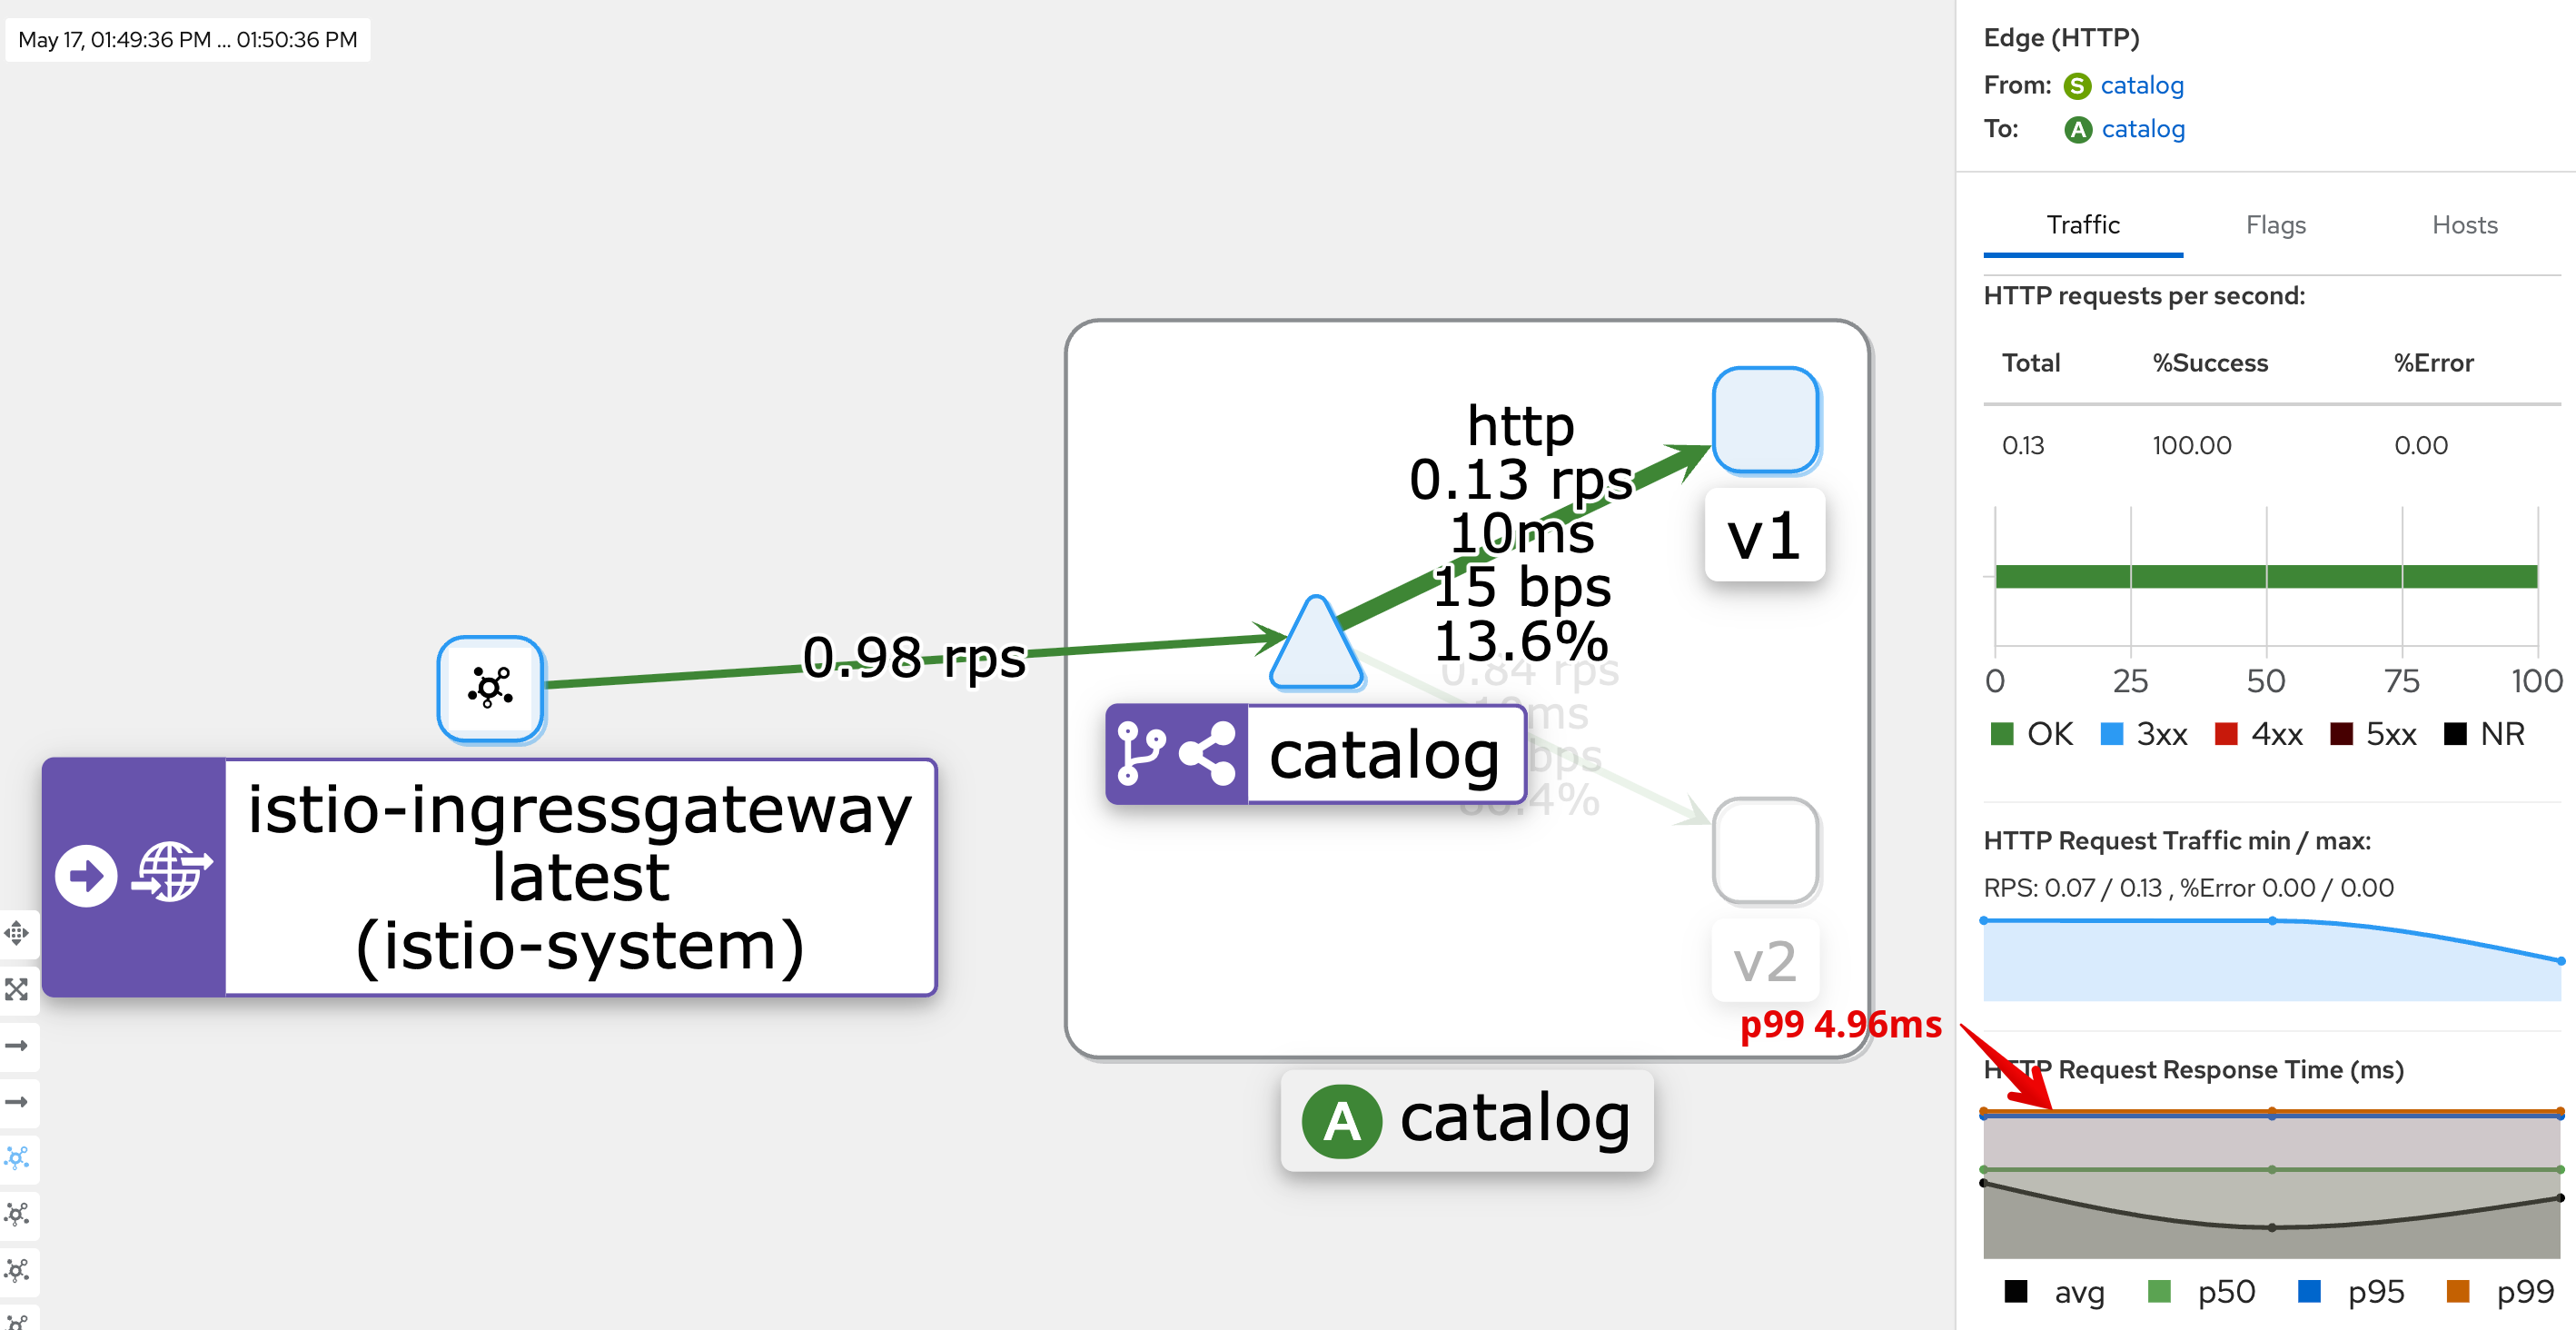
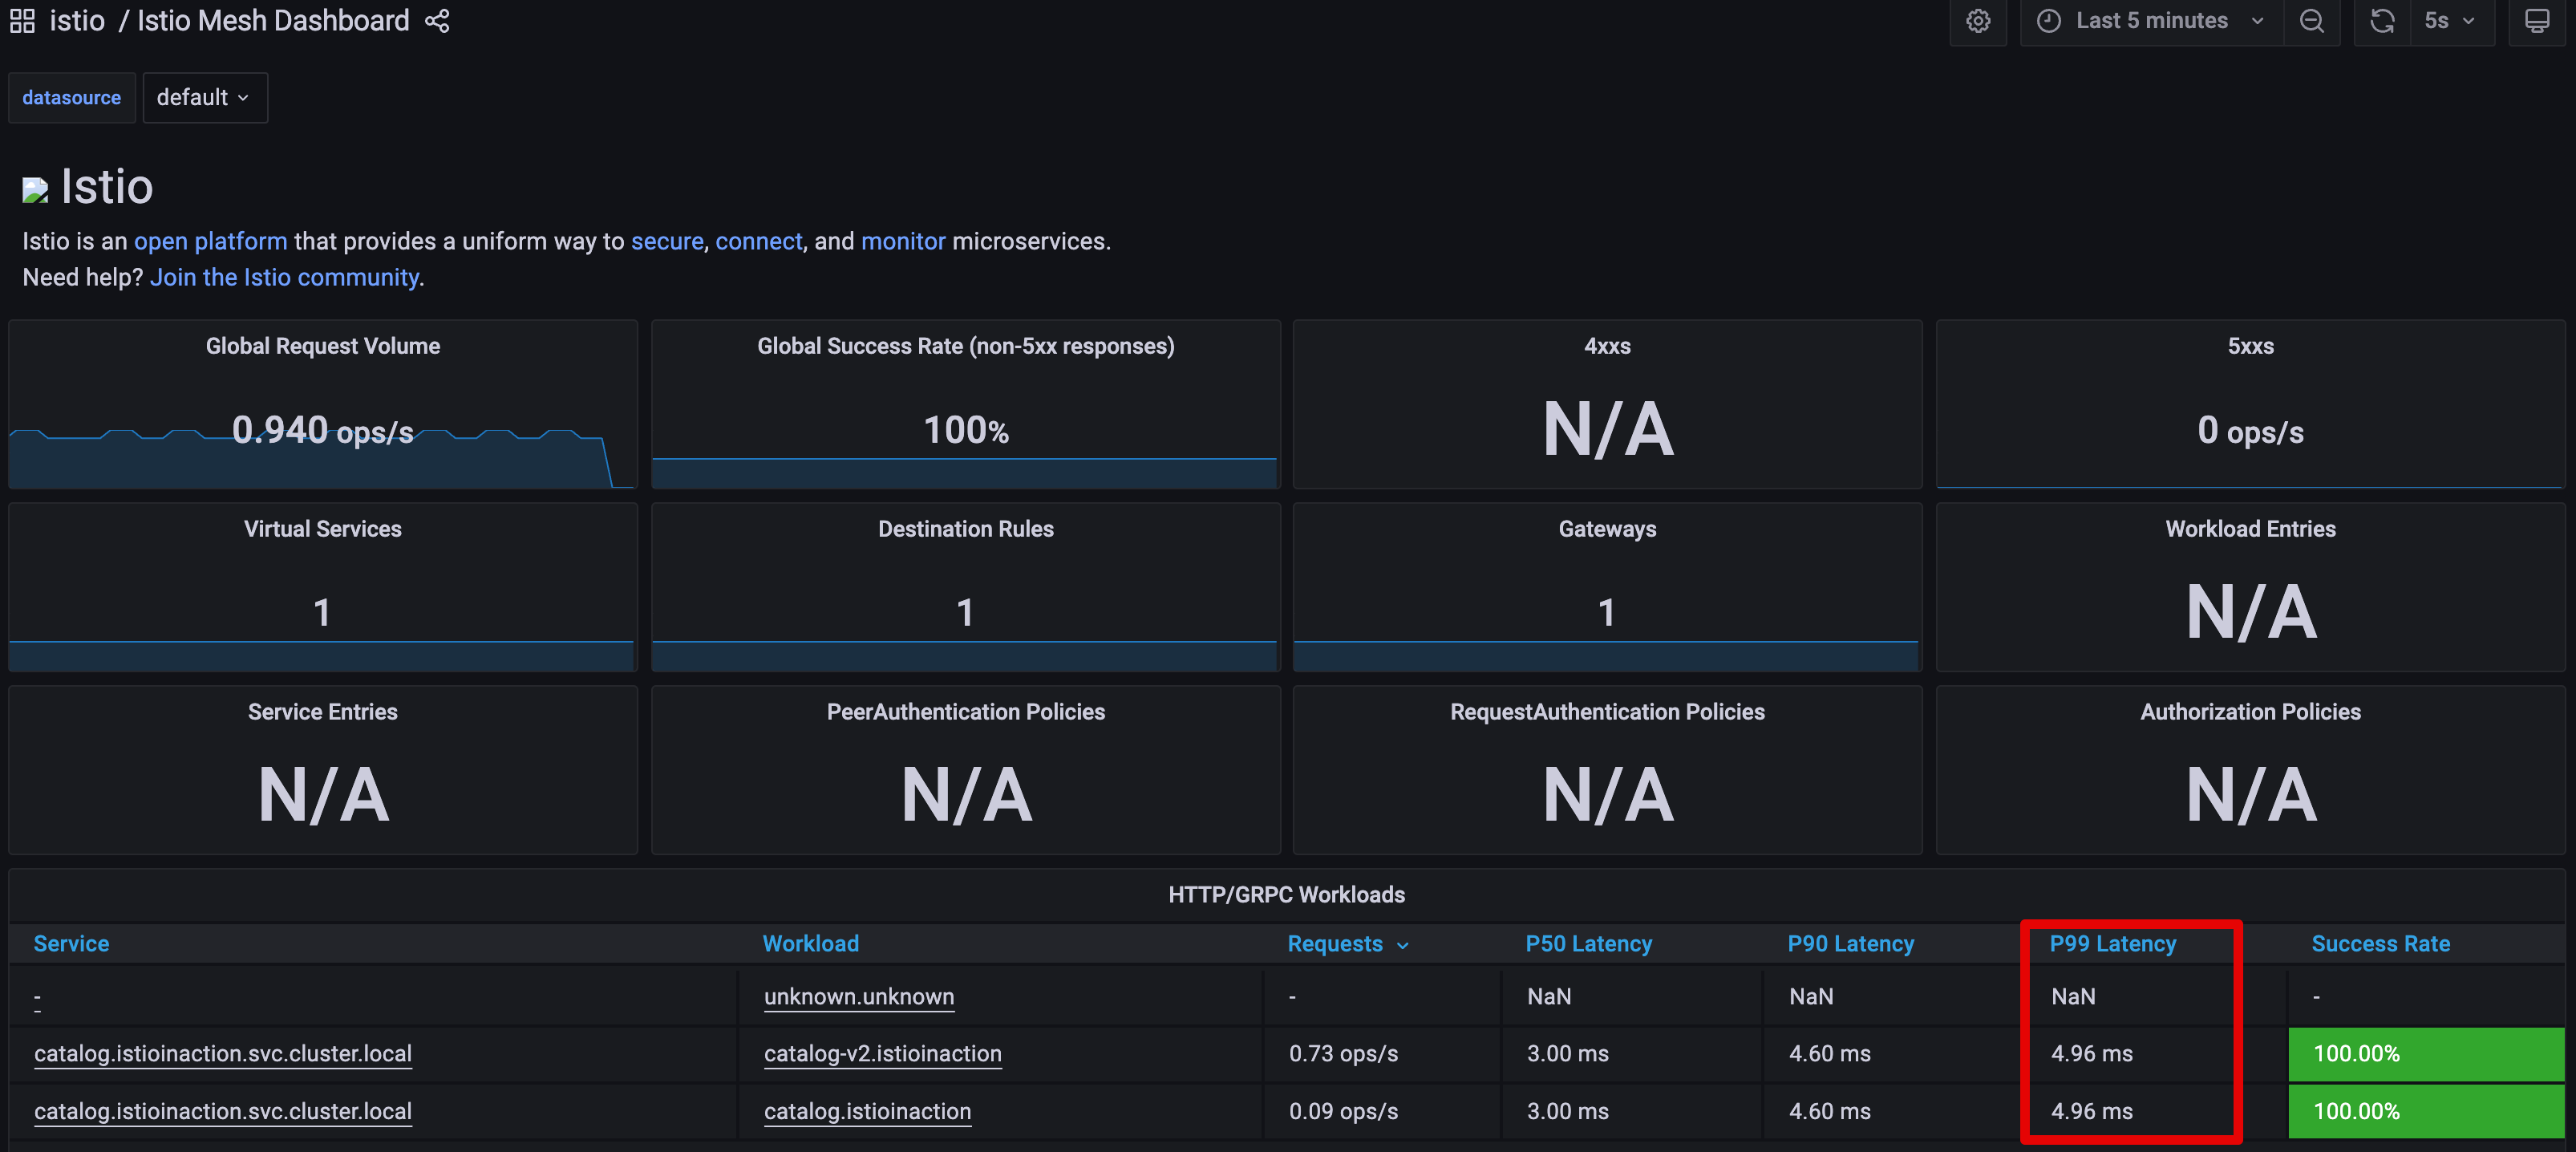
- kiali : catalog 에 v1 링크 클릭 후 오른쪽 탭 메뉴 하단에 HTTP Request Response Time(ms)에 p99 확인 → 4.96ms
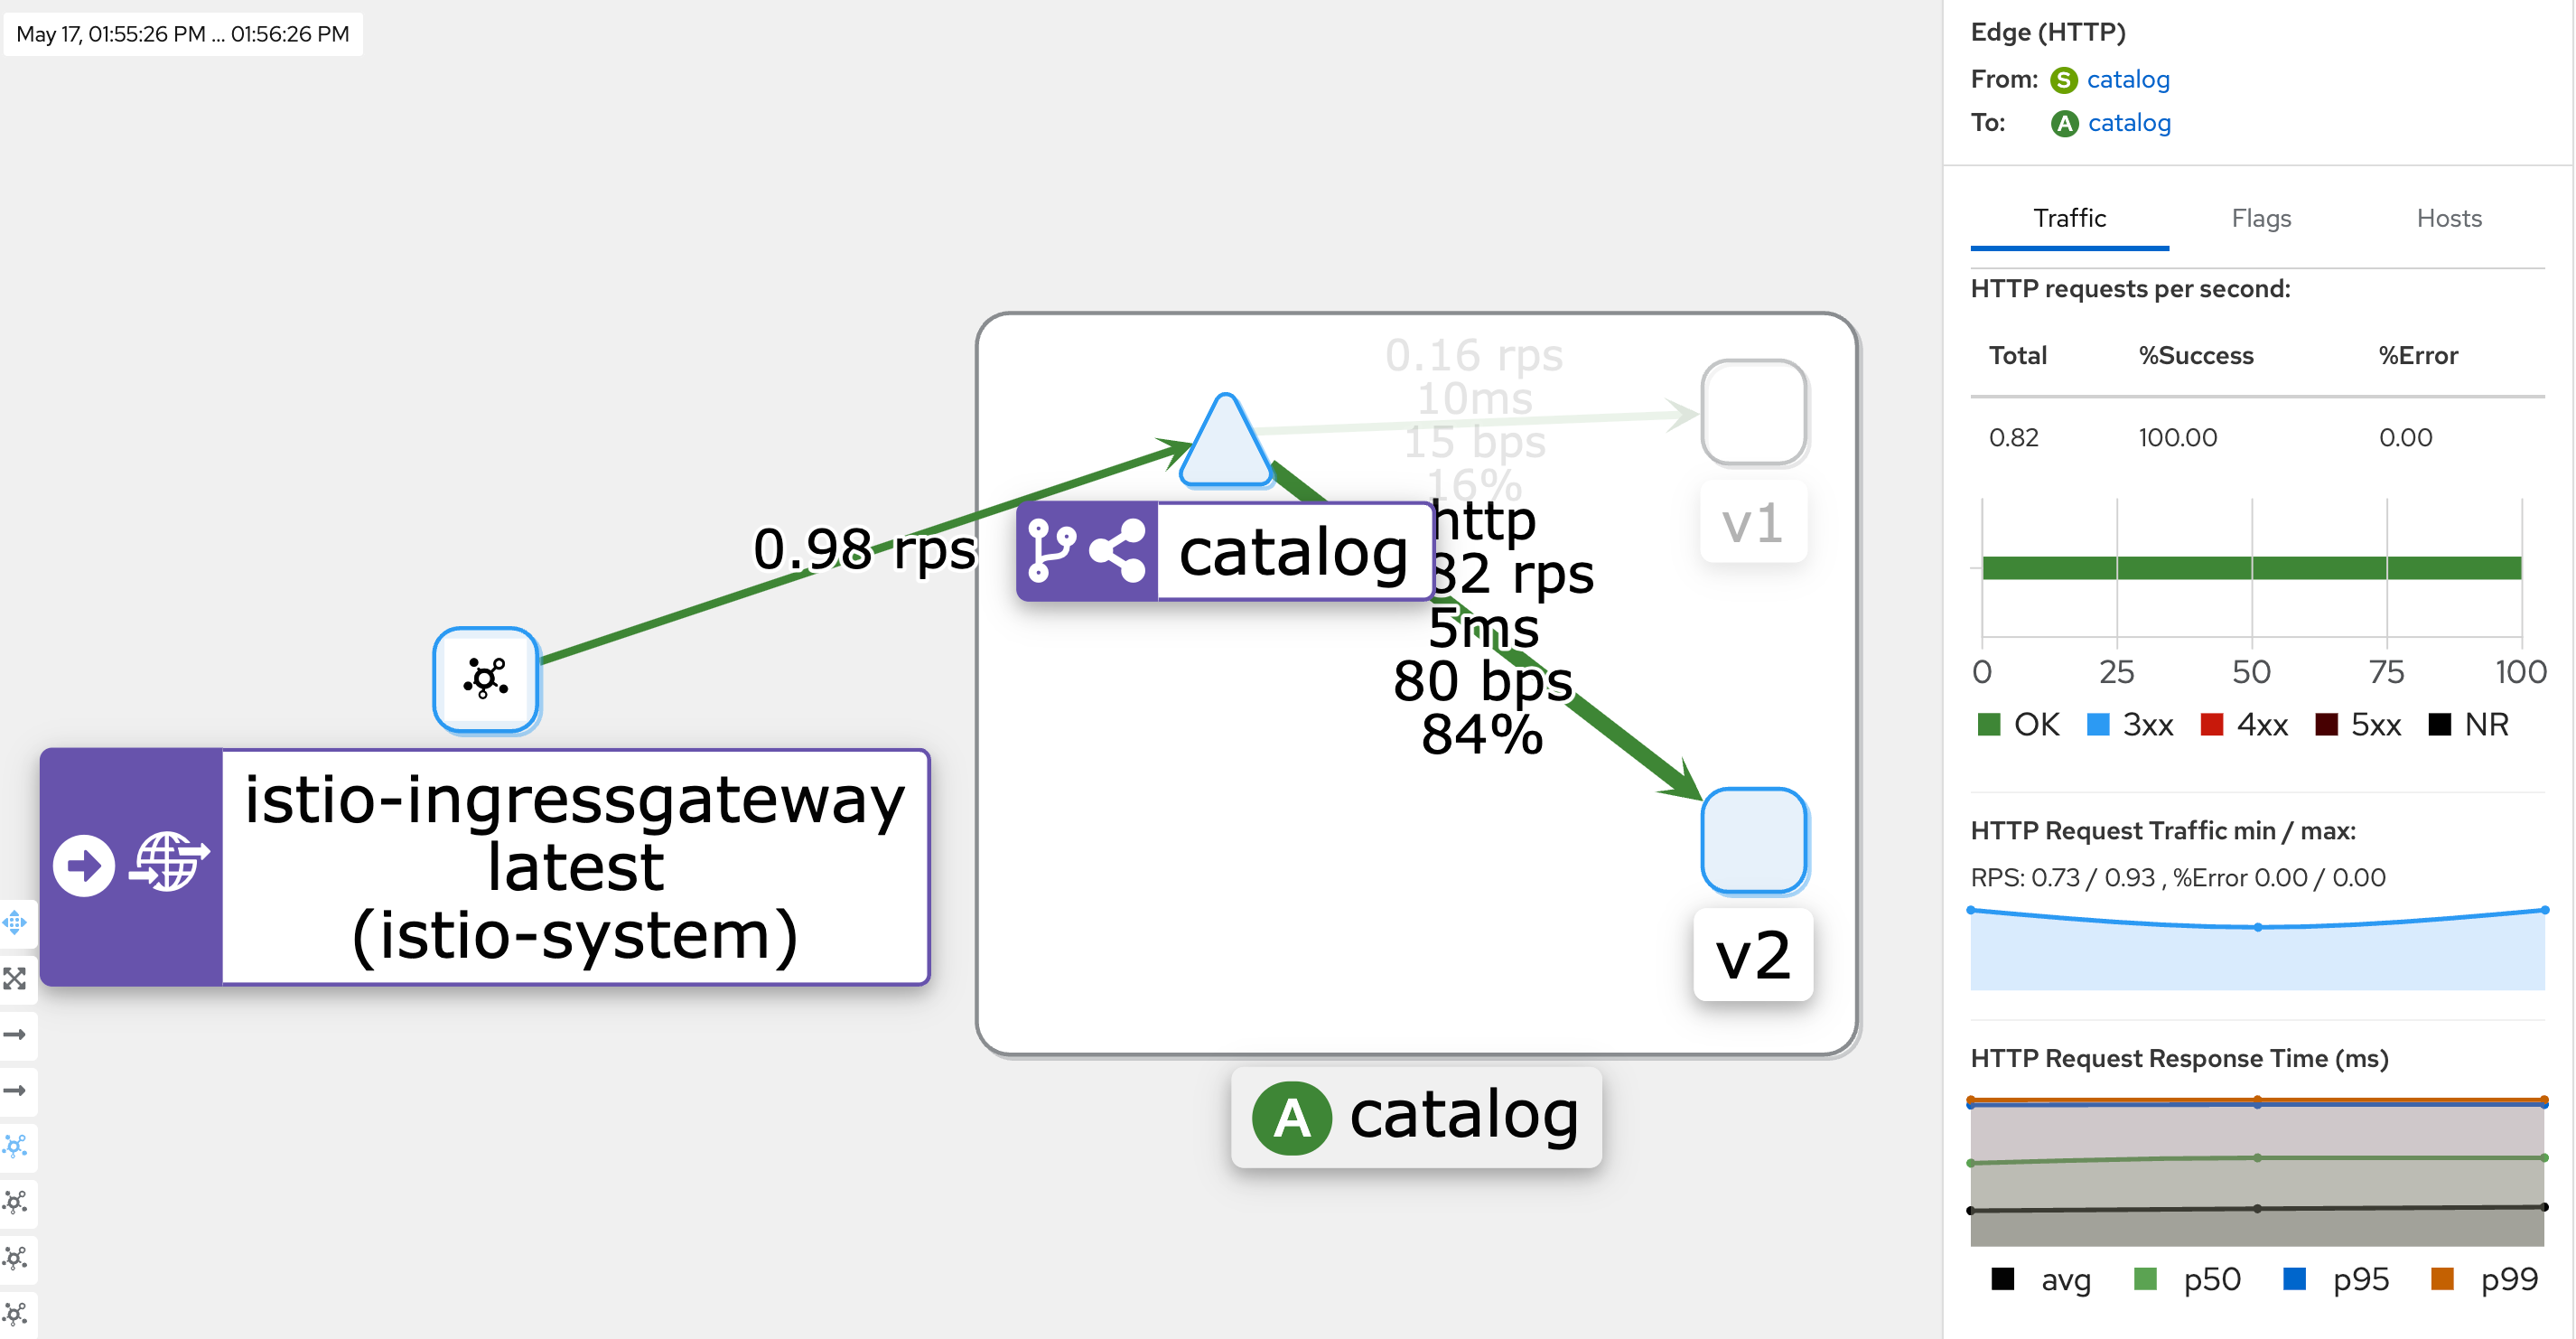
- kiali : catalog 에 v2 링크 클릭 후 오른쪽 탭 메뉴 하단에 HTTP Request Response Time(ms)에 p99 확인 → 4.96ms
- Grafana - Istio Mesh 대시보드
- catalog 워크로드가 간헐적으로 응답을 느리게 반환하도록 설정
# catalog v2 파드 중 첫 번째 파드 이름 변수 지정
CATALOG_POD=$(kubectl get pods -l version=v2 -n istioinaction -o jsonpath={.items..metadata.name} | cut -d ' ' -f1)
echo $CATALOG_POD
catalog-v2-56c97f6db-n5rx8

# 해당 파드에 latency (지연) 발생하도록 설정
kubectl -n istioinaction exec -c catalog $CATALOG_POD \
-- curl -s -X POST -H "Content-Type: application/json" \
-d '{"active": true, "type": "latency", "volatile": true}' \
localhost:3000/blowup ;
blowups=[object Object]


# 신규 터미널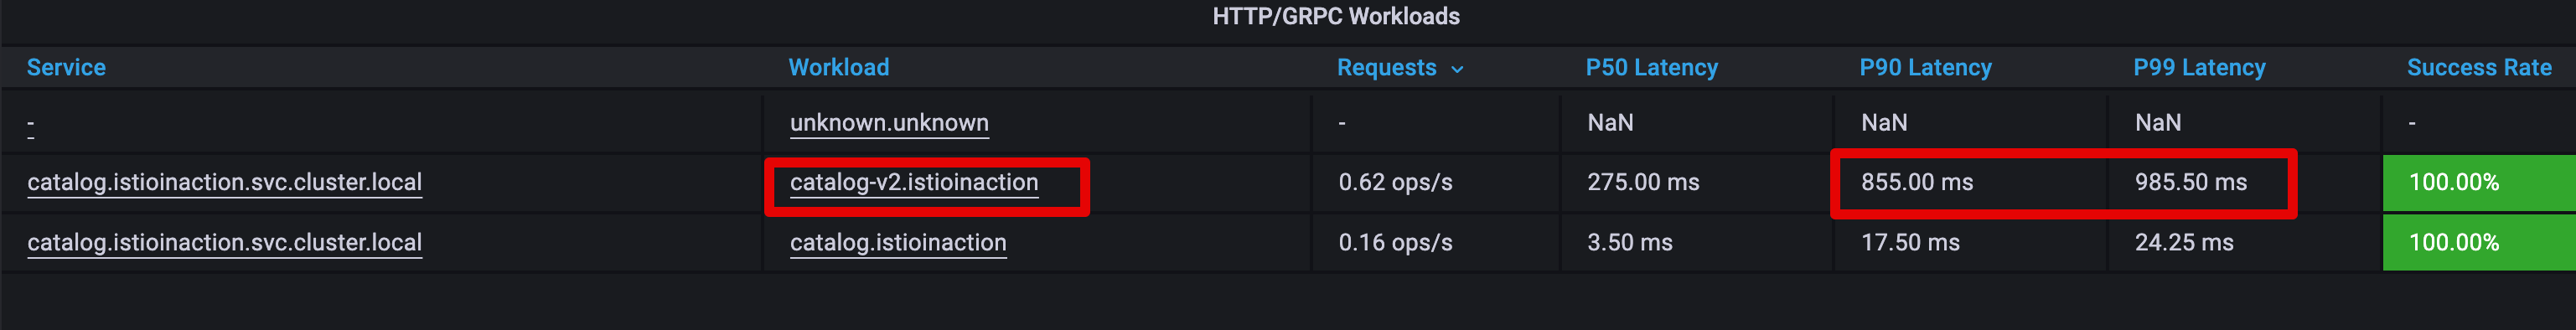
for in in {1..9999}; do curl http://catalog.istioinaction.io:30000/items -w "\nStatus Code %{http_code}\n"; sleep 1; done- Grafana - Istio Mesh 대시보드 : v2 에 P90, P99 레이턴스 확인 , v1 과 비교해보자.
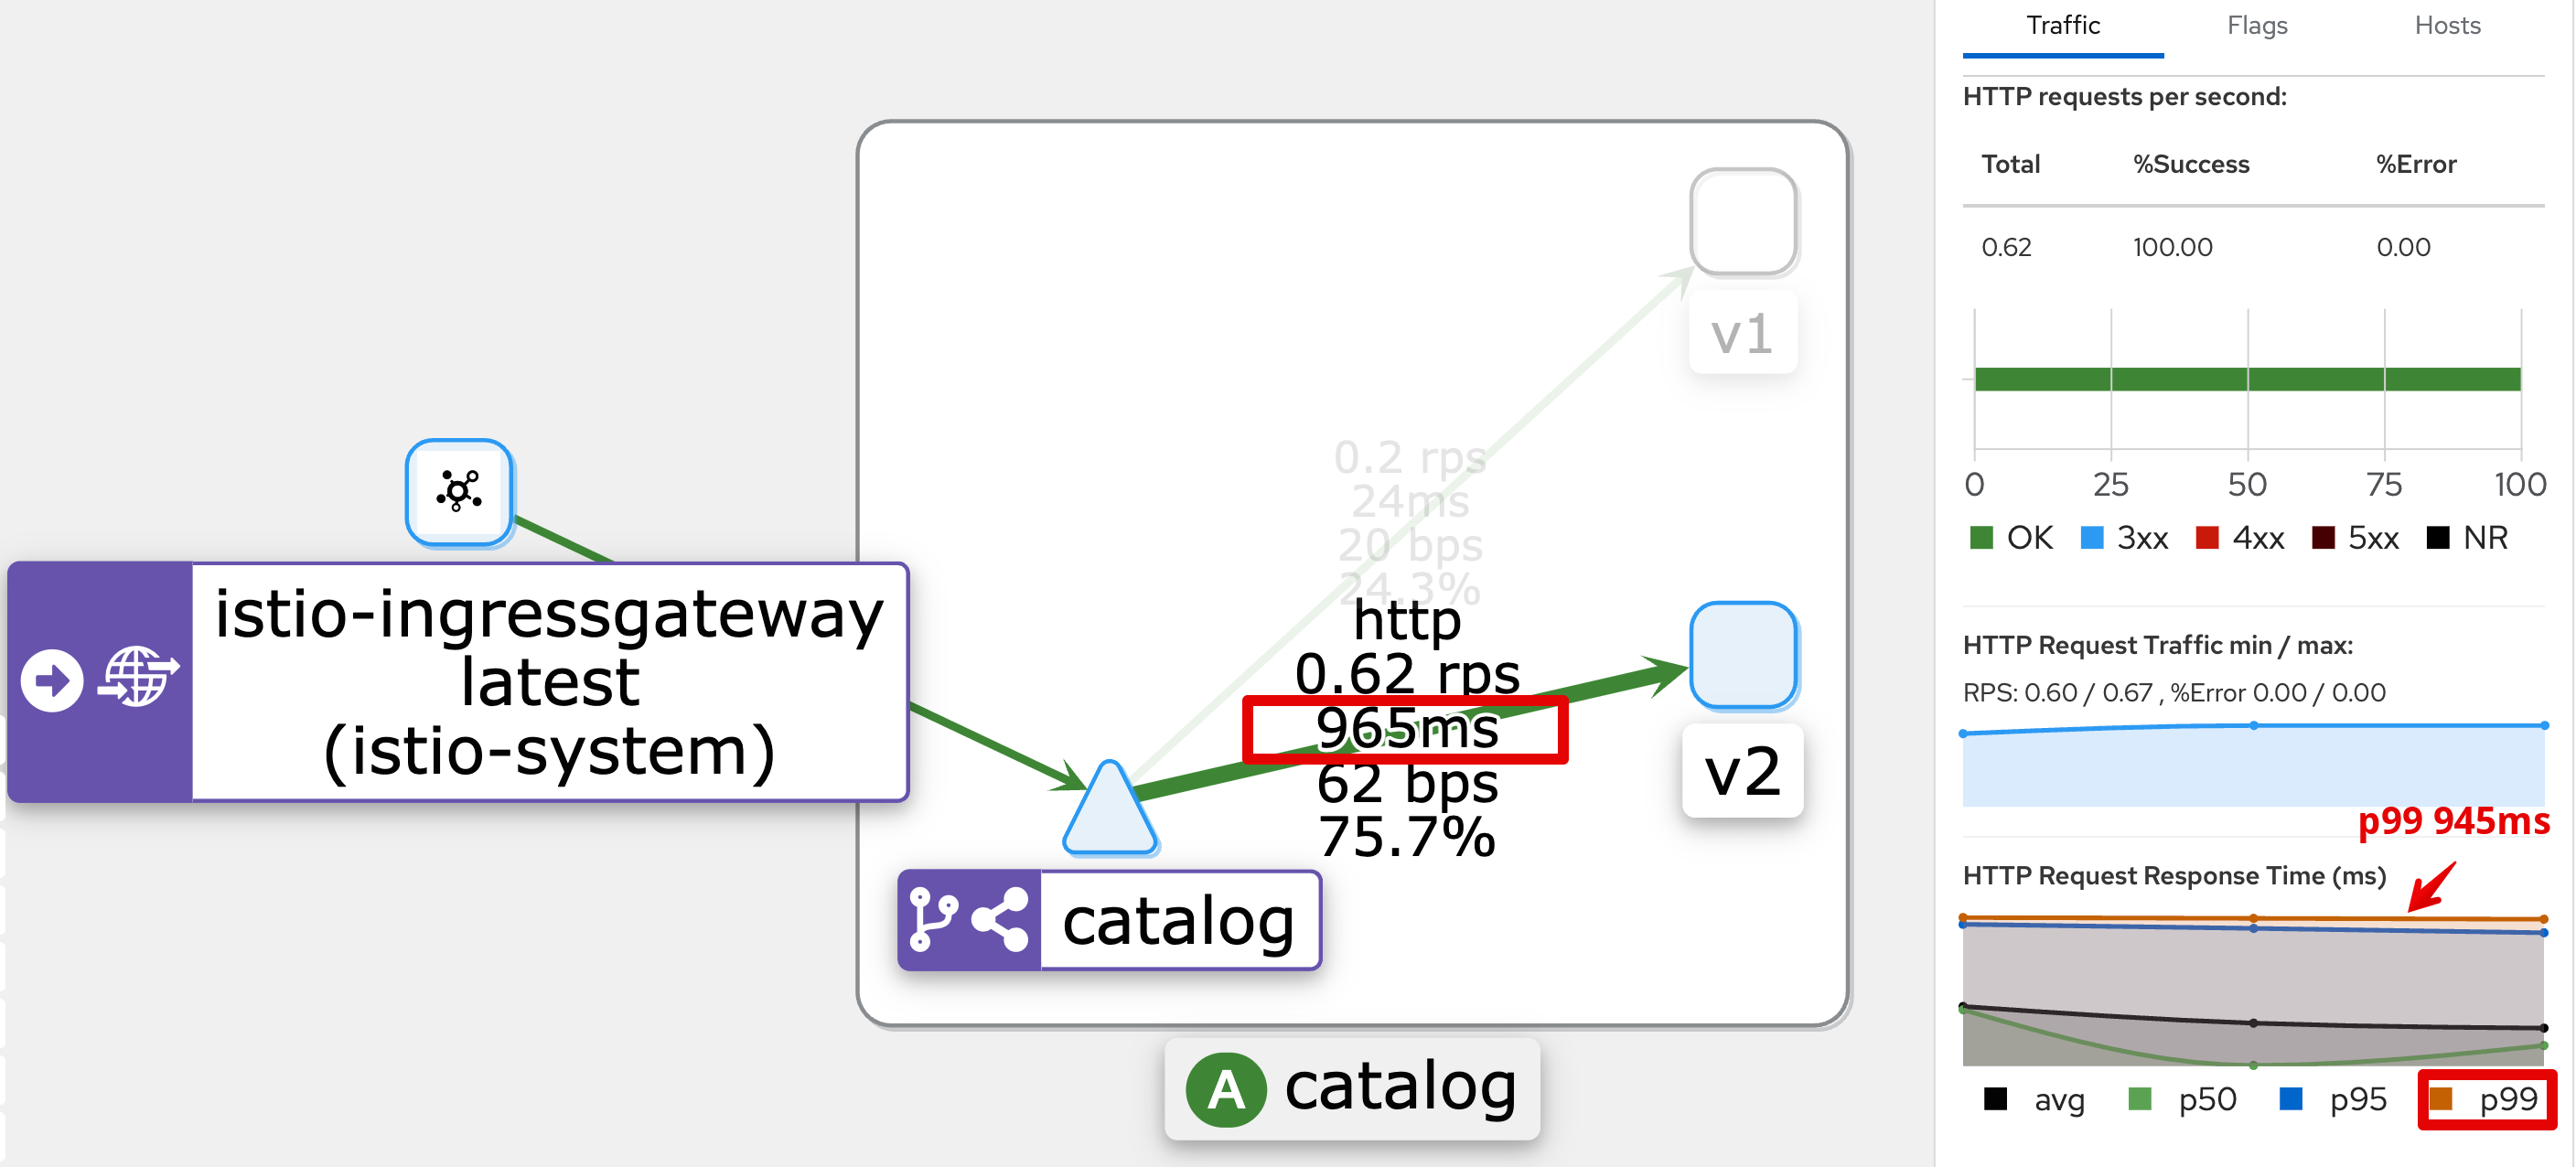
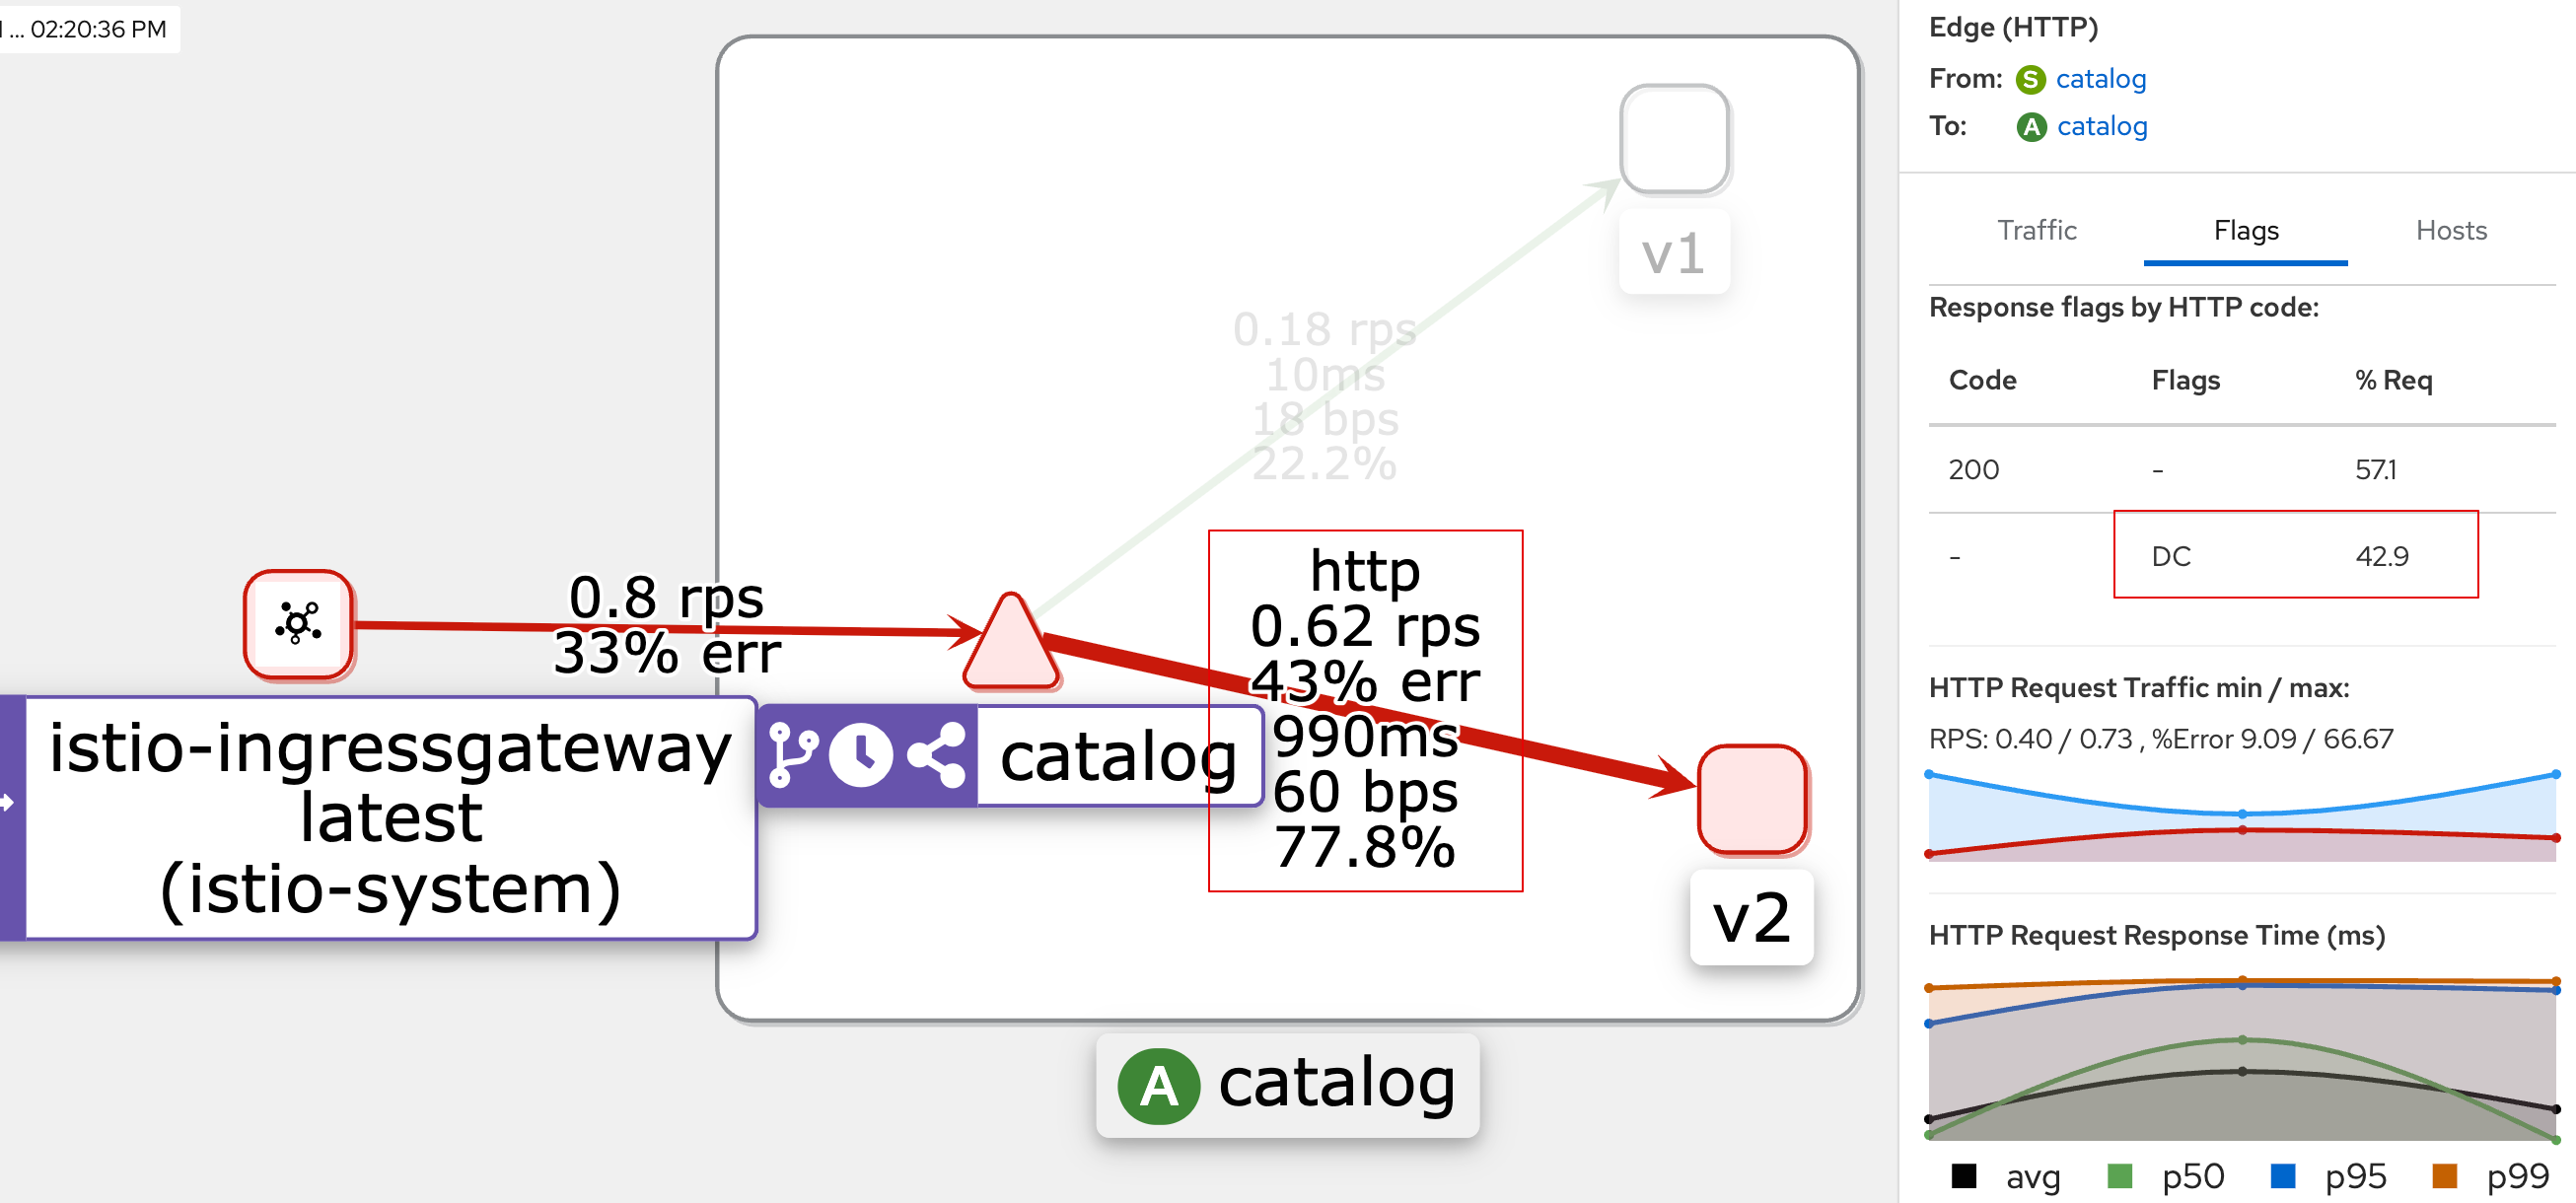
- kiali : catalog v2
- Istio 에 요청 처리 제한 시간 0.5초가 되도록 VirtualService 설정
- 2가지 변경 사항 : catalog v2 중 파드 1대는 간헐적으로 느린 응답을 하고, istio-proxy 가 요청 0.5초 이상 시 시간 초과 발생
#
kubectl get vs -n istioinaction
NAME            GATEWAYS              HOSTS                          AGE
catalog-v1-v2   ["catalog-gateway"]   ["catalog.istioinaction.io"]   12h

# 타임아웃(0.5s) 적용
kubectl patch vs catalog-v1-v2 -n istioinaction --type json \
-p '[{"op": "add", "path": "/spec/http/0/timeout", "value": "0.5s"}]'

# 적용확인
kubectl get vs catalog-v1-v2 -n istioinaction -o jsonpath='{.spec.http[?(@.timeout=="0.5s")]}' | jq
...
  "timeout": "0.5s"
}

# 신규 터미널
for in in {1..9999}; do curl http://catalog.istioinaction.io:30000/items -w "\nStatus Code %{http_code}\n"; sleep 1; done
upstream request timeout
Status Code 504
upstream request timeout
Status Code 504
..

#
kubectl logs -n istio-system -l app=istio-ingressgateway -f
[2025-05-17T05:15:26.212Z] "GET /items HTTP/1.1" 200 - via_upstream - "-" 0 502 256 255 "172.18.0.1" "curl/8.13.0" "bc77e956-30ff-98fd-934d-eec9a7f49f41" "catalog.istioinaction.io:30000" "10.10.0.15:3000" outbound|80|version-v2|catalog.istioinaction.svc.cluster.local 10.10.0.8:56234 10.10.0.8:8080 172.18.0.1:54420 - -
[2025-05-17T05:15:27.502Z] "GET /items HTTP/1.1" 200 - via_upstream - "-" 0 502 3 2 "172.18.0.1" "curl/8.13.0" "6d0ce0f1-9a8b-9a19-b438-f413ce553eeb" "catalog.istioinaction.io:30000" "10.10.0.14:3000" outbound|80|version-v2|catalog.istioinaction.svc.cluster.local 10.10.0.8:52184 10.10.0.8:8080 172.18.0.1:54436 - -
[2025-05-17T05:15:28.549Z] "GET /items HTTP/1.1" 504 UT response_timeout - "-" 0 24 501 - "172.18.0.1" "curl/8.13.0" "cb068049-f887-9c1c-8624-47bf416f5c33" "catalog.istioinaction.io:30000" "10.10.0.15:3000" outbound|80|version-v2|catalog.istioinaction.svc.cluster.local 10.10.0.8:56238 10.10.0.8:8080 172.18.0.1:54452 - -
...

kubectl logs -n istio-system -l app=istio-ingressgateway -f | grep 504
...
[2025-05-17T05:16:12.319Z] "GET /items HTTP/1.1" 504 UT response_timeout - "-" 0 24 500 - "172.18.0.1" "curl/8.13.0" "0ab7f7ba-0cc8-931c-bdc5-23c52c91159f" "catalog.istioinaction.io:30000" "10.10.0.15:3000" outbound|80|version-v2|catalog.istioinaction.svc.cluster.local 10.10.0.8:51038 10.10.0.8:8080 172.18.0.1:39176 - -
[2025-05-17T05:16:16.451Z] "GET /items HTTP/1.1" 504 UT response_timeout - "-" 0 24 501 - "172.18.0.1" "curl/8.13.0" "6be2f3c5-b1b8-94a6-bed2-45cc14717d43" "catalog.istioinaction.io:30000" "10.10.0.15:3000" outbound|80|version-v2|catalog.istioinaction.svc.cluster.local 10.10.0.8:59902 10.10.0.8:8080 172.18.0.1:39200 - -
[2025-05-17T05:16:20.113Z] "GET /items HTTP/1.1" 504 UT response_timeout - "-" 0 24 502 - "172.18.0.1" "curl/8.13.0" "18f93ac2-91e6-9f5e-91ed-5a6ede061820" "catalog.istioinaction.io:30000" "10.10.0.15:3000" outbound|80|version-v2|catalog.istioinaction.svc.cluster.local 10.10.0.8:59910 10.10.0.8:8080 172.18.0.1:39228 - -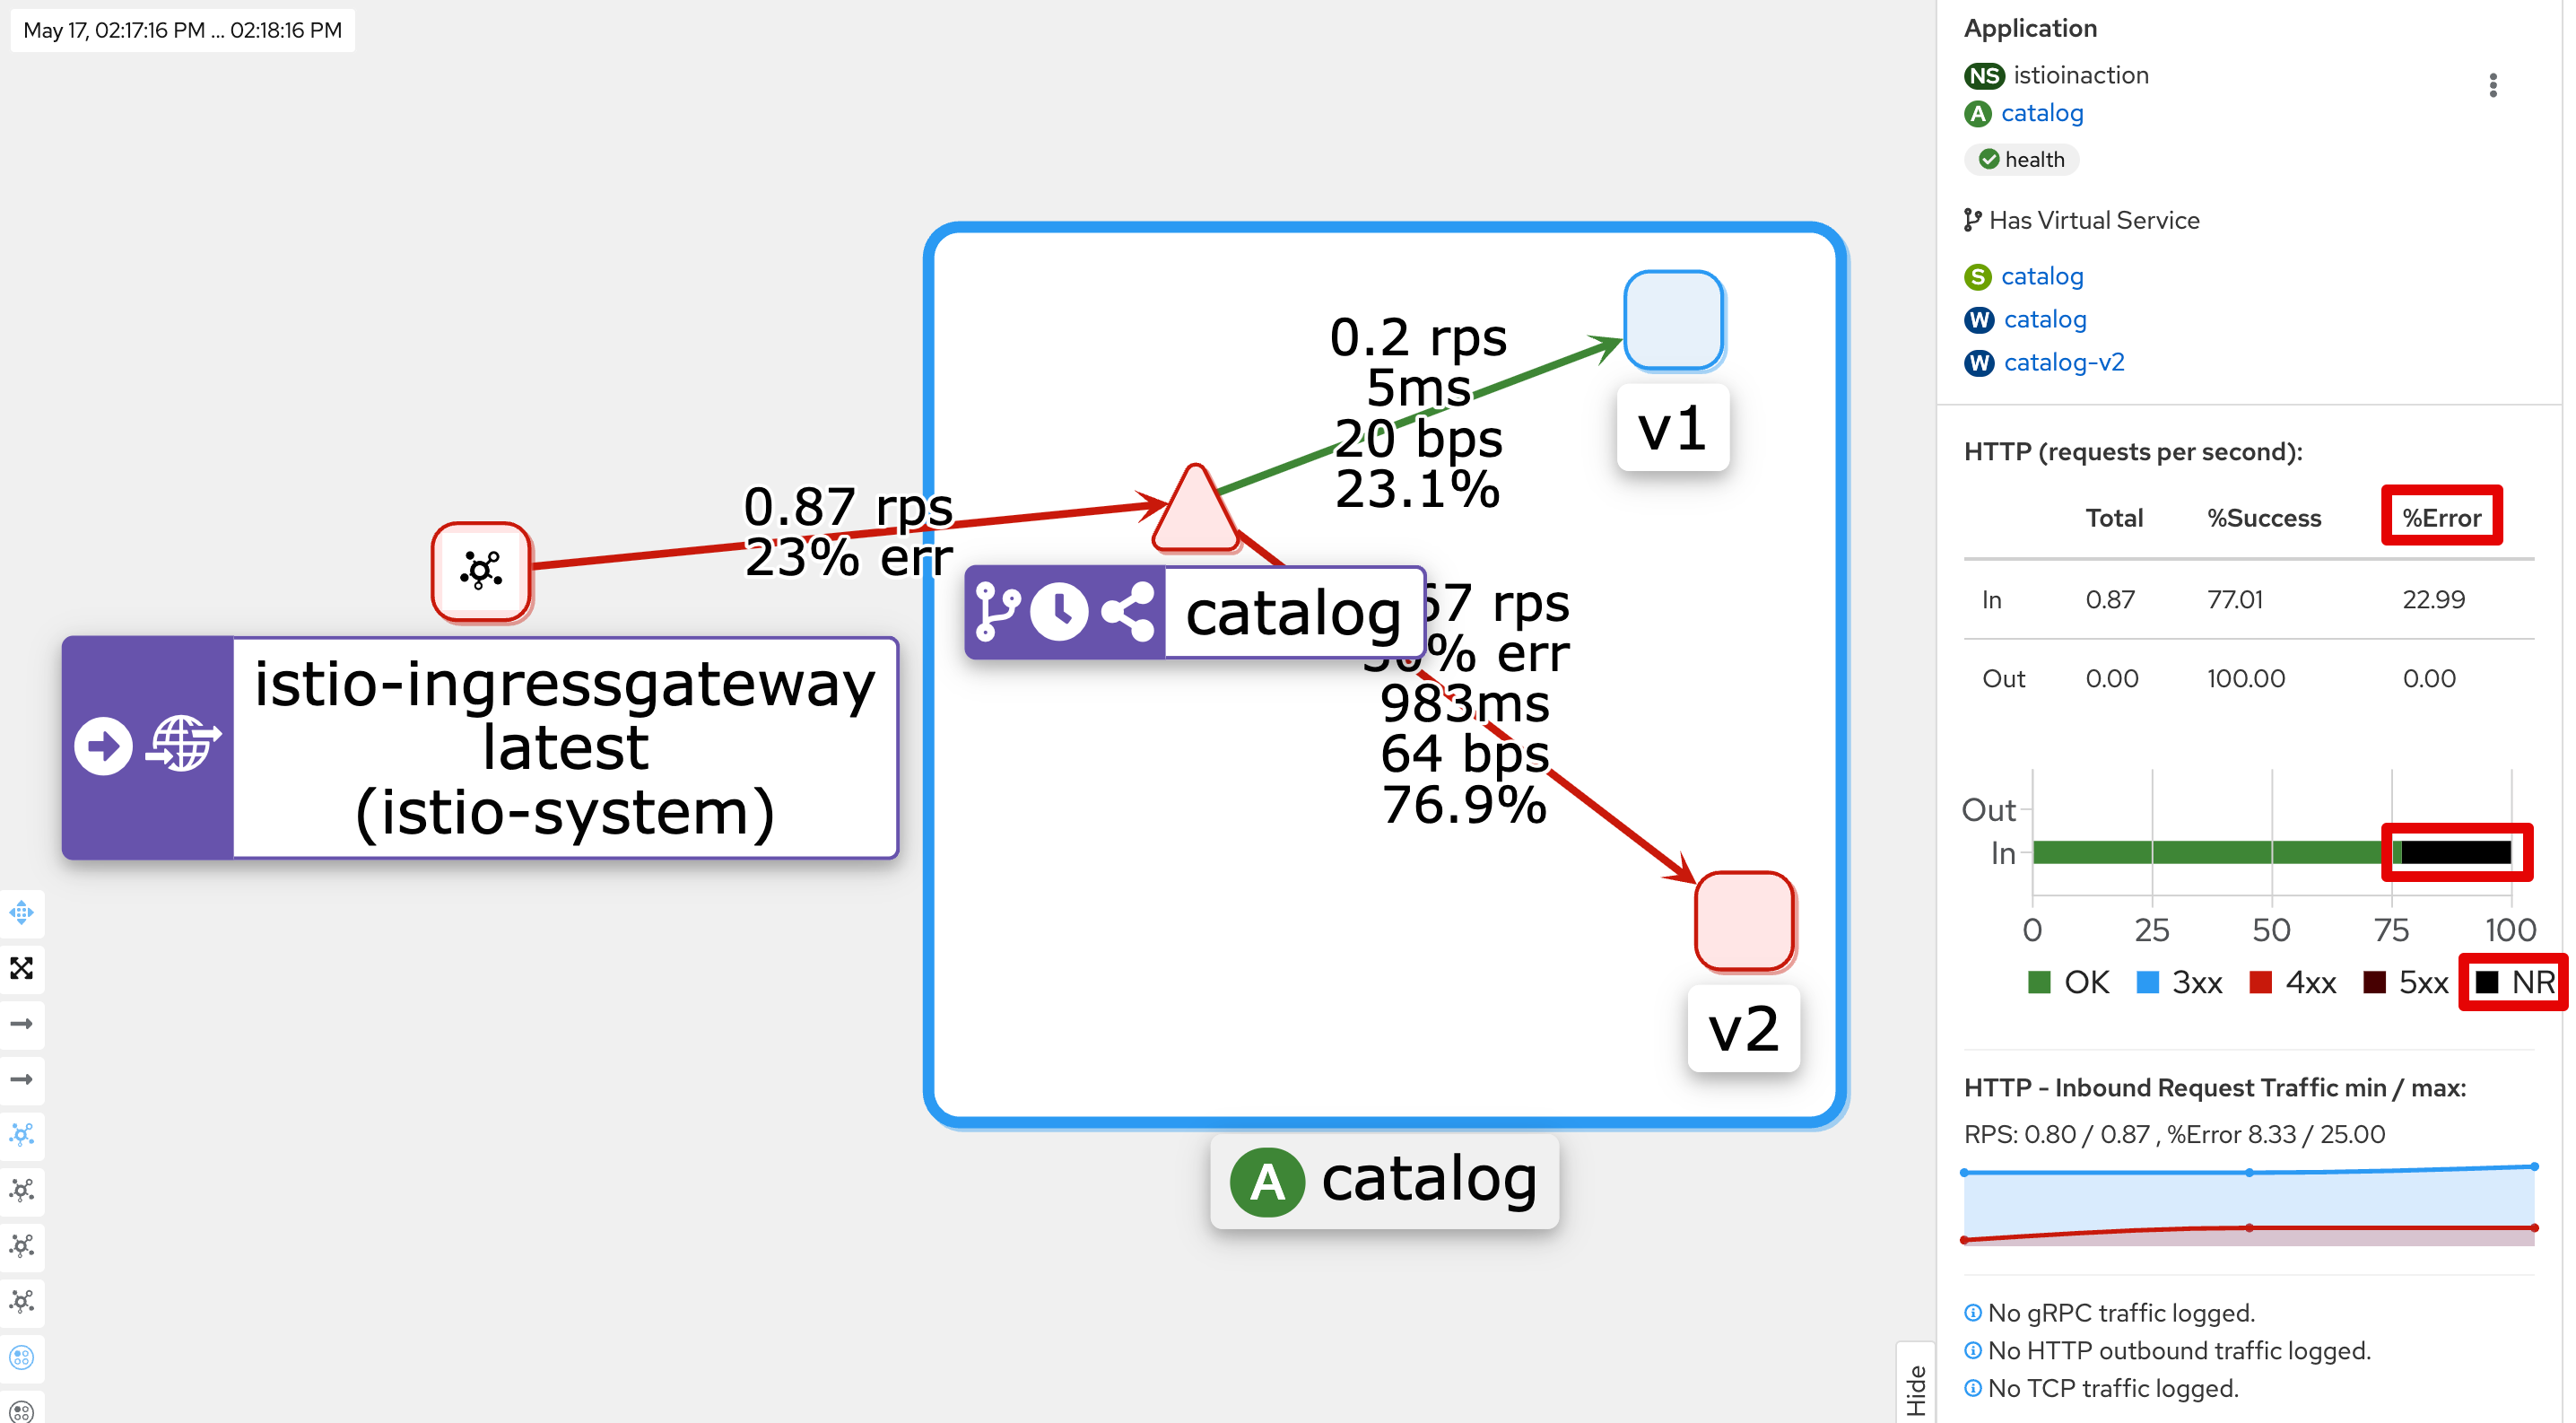
...- kiali : catalog v2
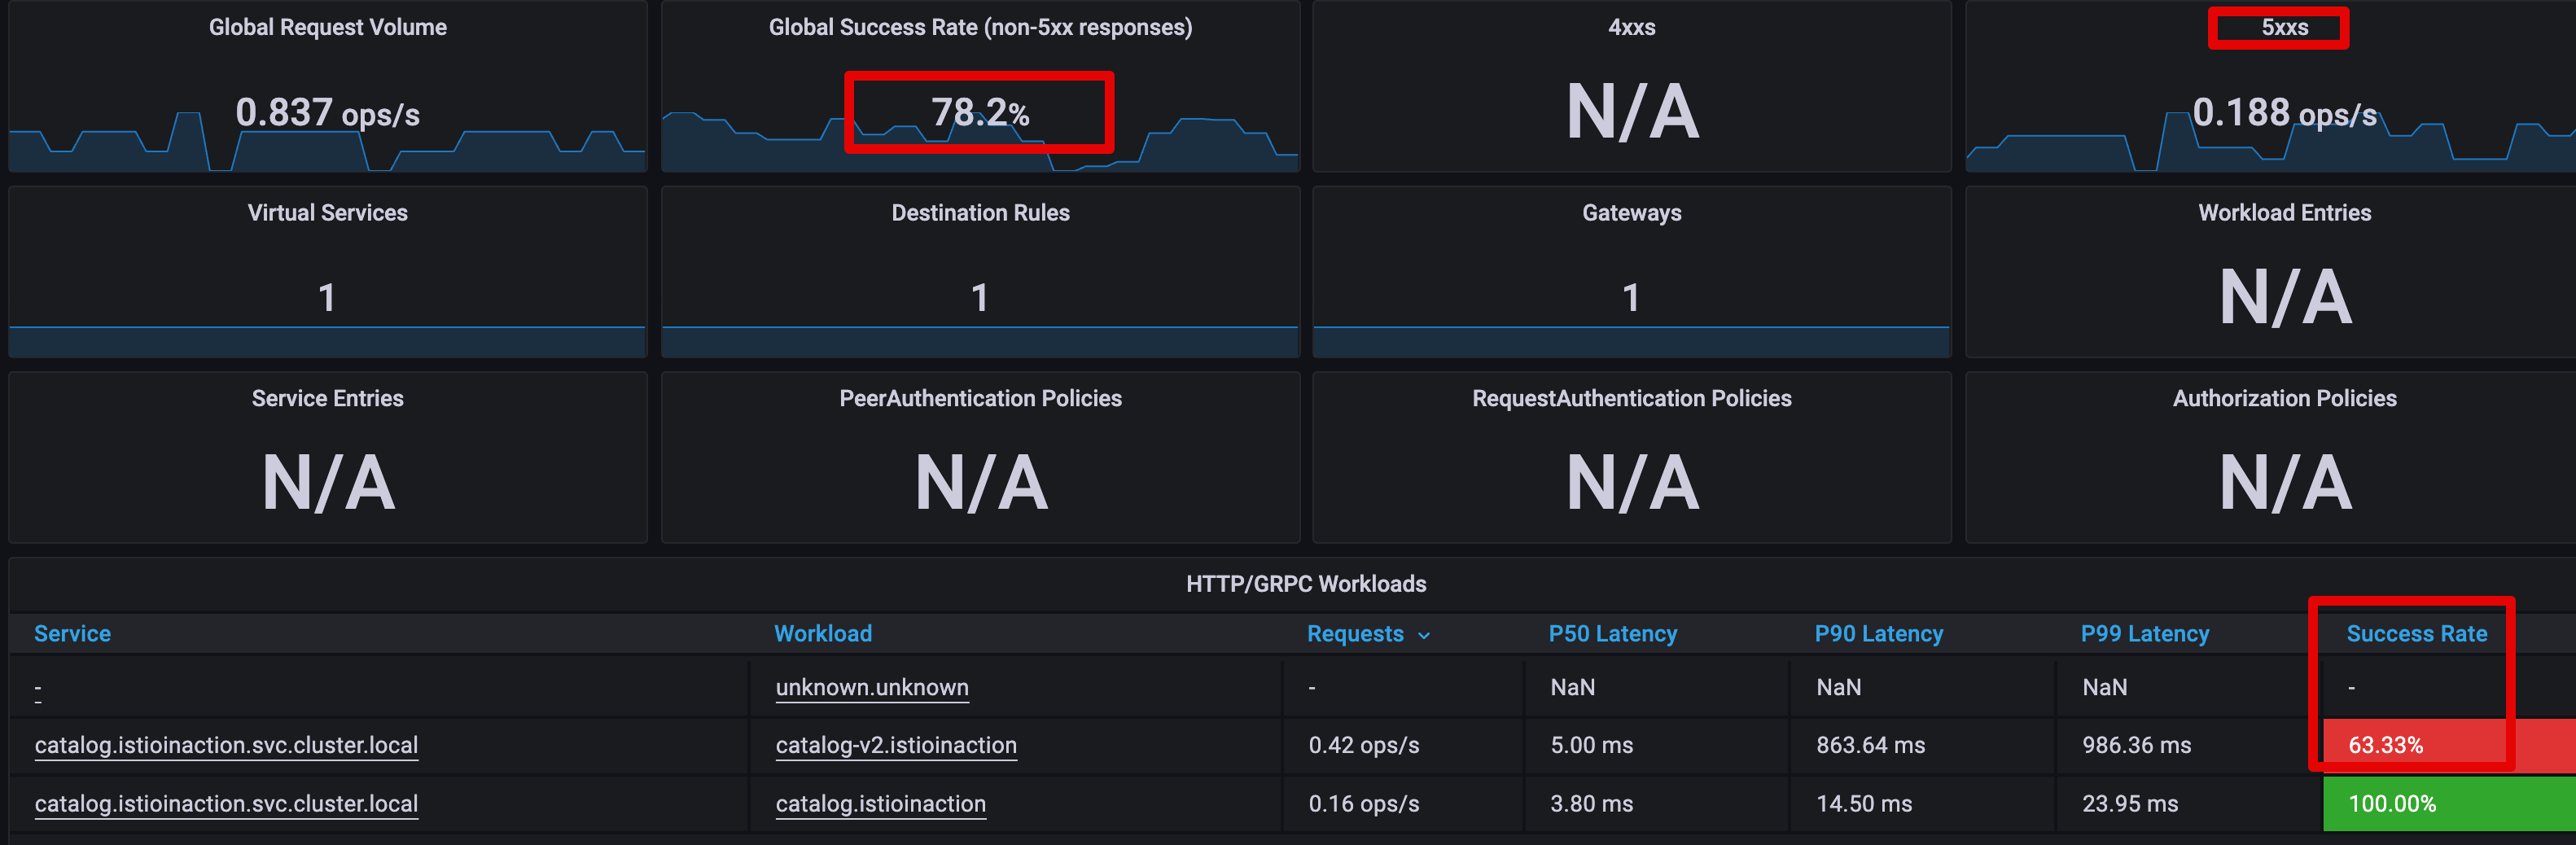
- Grafana - Istio Mesh 대시보드 : 500 응답 증가, v2 에 Success Rate % 확인

🎯 엔보이 액세스 로그 이해하기 + 엔보이 액세스 로그 형식 바꾸기 - 기본적으로 이스티오는 프록시가 로그를 TEXT 형식으로 기록하도록 설정하는데, 간결하지만 읽기는 어렵다.
- JSON 형식을 사용하게 설정 : 이 형식의 이점은 값이 키와 연결돼 의미를 알 수 있다.
# 형식 설정 전 로그 확인
kubectl logs -n istio-system -l app=istio-ingressgateway -f | grep 504
...

# MeshConfig 설정 수정
KUBE_EDITOR="nano" kubectl edit -n istio-system cm istio
...
  mesh: |-
    accessLogFile: /dev/stdout # 기존 설정되어 있음
    accessLogEncoding: JSON # 추가

# 형식 설정 후 로그 확인
kubectl logs -n istio-system -l app=istio-ingressgateway -f | jq
...
{
  "upstream_service_time": null,
  "bytes_received": 0,
  "start_time": "2025-05-17T05:32:35.834Z",
  "response_code_details": "response_timeout",
  "bytes_sent": 24,
  "downstream_local_address": "10.10.0.8:8080",
  "upstream_local_address": "10.10.0.8:38242",
  "upstream_transport_failure_reason": null,
  "response_code": 504,
  "x_forwarded_for": "172.18.0.1",
  "response_flags": "UT",  # 엔보이 응답 플래그, UT(Upstream request Timeout)로 중단됨, '업스트림 요청 제한 시간 초과'
  "user_agent": "curl/8.13.0",
  "path": "/items",
  "protocol": "HTTP/1.1",
  "upstream_cluster": "outbound|80|version-v2|catalog.istioinaction.svc.cluster.local",
  "upstream_host": "10.10.0.15:3000",   # 요청을 받는 업스트림 호스트
  "route_name": null,
  "duration": 502,  # 500ms 인 제한 시간 초과
  "requested_server_name": null,
  "method": "GET",
  "request_id": "58d179a3-6bdf-935c-8521-c811ccfeddb8",
  "authority": "catalog.istioinaction.io:30000",
  "downstream_remote_address": "172.18.0.1:60572",
  "connection_termination_details": null
}
...

# slow 동작되는 파드 IP로 느린 동작 파드 확인!
CATALOG_POD=$(kubectl get pods -l version=v2 -n istioinaction -o jsonpath={.items..metadata.name} | cut -d ' ' -f1)
kubectl get pod -n istioinaction $CATALOG_POD -owide
NAME                         READY   STATUS    RESTARTS   AGE   IP           NODE                  NOMINATED NODE   READINESS GATES
catalog-v2-56c97f6db-n5rx8 2/2 Running 0 13h 10.10.0.15 myk8s-control-plane <none> <none>- 필요 시 엔보이 프록시의 로깅 수준을 높여 더 자세한 로그를 얻을 수 있다.
🆘 엔보이 게이트웨이의 로깅 수준 높이기
- 현재 로깅 수준 확인
#
docker exec -it myk8s-control-plane istioctl proxy-config log deploy/istio-ingressgateway -n istio-system
istio-ingressgateway-6bb8fb6549-hcdnc.istio-system:
active loggers:
  admin: warning
  alternate_protocols_cache: warning
  aws: warning
  assert: warning
  backtrace: warning
  cache_filter: warning
  client: warning
  config: warning
  connection: warning # 커넥션 범위에서는 네트워크 계층과 관련된 정보를 기록.
  ...
  http: warning # HTTP 범위에서는 HTTP 헤더, 경로 등 애플리케이션과 관련된 졍보를 기록.
  ...
  router: warning # 라우팅 범위에서는 요청이 어느 클러스터로 라우팅되는지 같은 세부 사항을 기록.
...- 사용할 수 있는 로깅 수준에는 none, error, warning, info, debug 가 있다.
- 각 범위에 로깅 수준을 서로 다르게 지정할 수 있는 덕분에 엔보이가 만들어내는 로그에 질식하지 않고 관심 영역의 로깅 수준만 정확하게 높일 수 있다.
- connection : Logs related to layer 4 (transport); TCP connection details
- http : Logs related to layer 7 (application); HTTP details
- router: Logs related to the routing of HTTP requests
- pool : Logs related to how a connection pool acquires or drops a connection’s upstream host
- connection , http , router , pool 로거의 수준을 debug 로 높여보자
#
docker exec -it myk8s-control-plane istioctl proxy-config log deploy/istio-ingressgateway -n istio-system \
--level http:debug,router:debug,connection:debug,pool:debug

# 로그 확인
kubectl logs -n istio-system -l app=istio-ingressgateway -f
k logs -n istio-system -l app=istio-ingressgateway -f > istio-igw-log.txt # 편집기로 열어서 보기
...- 편집기로 열어서 보기
 2025-05-17T05:40:30.734406Z debug   envoy http external/envoy/source/common/http/conn_manager_impl.cc:1687                             [C29017][S5357767579631569733] encoding headers via codec (end_stream=false):
 ':status', '504'
 'content-length', '24'
 'content-type', 'text/plain'
 'date', 'Sat, 17 May 2025 05:40:30 GMT'
 'server', 'istio-envoy'
     thread=34
 2025-05-17T05:40:30.734645Z debug   envoy pool external/envoy/source/common/conn_pool/conn_pool_base.cc:215 [C28999] destroying        stream: 0 remaining   thread=34
 2025-05-17T05:40:30.736390Z debug   envoy connection external/envoy/source/common/network/connection_impl.cc:656    [C29017] remote    close thread=34
 2025-05-17T05:40:30.736419Z debug   envoy connection external/envoy/source/common/network/connection_impl.cc:250    [C29017] closing   socket: 0 thread=34
2025-05-17T05:40:30.939501Z debug envoy http external/envoy/source/common/http/conn_manager_impl.cc:329 [C29018] new stream thread=35- 두 가지 중요한 발견이 있다.
- 첫 째, 응답이 느린 업스트림의 IP 주소가 액세스 로그에서 가져온 IP 주소와 일치한다는 점이다. 이는 오동작하는 인스턴스가 딱 하나라는 심증을 더욱 굳힌다.
- 둘 째, 로그 [C17947] client disconnected 에 표시된 대로 클라이언트(프록시)는 업스트림 커넥션을 종료했다.
- 이는 업스트림 인스턴스가 제한 시간 설정을 초과해 클라이언트(프록시)가 요청을 종료한다는 우리의 예상과 일치한다.
- 엔보이 로거는 프록시 동작을 깊이 꿰뚫는 통찰력을 얻게 해준다.
2.3.4 ksniff, tcpdump 네트워크 트래픽 검사
🔎 ksniff 설치 & 실행
# sniff 설치
kubectl krew install sniff

# wireshark 설치
brew install wireshark

# wireshark not found 오류 조치
sudo ln -s /Applications/Wireshark.app/Contents/MacOS/Wireshark /usr/local/bin/wireshark

# wireshark 실행 test
wireshark -v

# catalog 호출 - 다른 터미널에서
for in in {1..9999}; do curl http://catalog.istioinaction.io:30000/items -w "\nStatus Code %{http_code}\n"; sleep 1; done

# sniff 실행
kubectl sniff catalog-v2-6c7cf7bf-2sptr -i lo
INFO[0000] using tcpdump path at: '/Users/sjkim/.krew/store/sniff/v1.6.2/static-tcpdump'
INFO[0000] no container specified, taking first container we found in pod.
INFO[0000] selected container: 'catalog'
INFO[0000] sniffing method: upload static tcpdump
INFO[0000] sniffing on pod: 'catalog-v2-56c97f6db-n5rx8' [namespace: 'istioinaction', container: 'catalog', filter: '', interface: 'lo']
INFO[0000] uploading static tcpdump binary from: '/Users/sjkim/.krew/store/sniff/v1.6.2/static-tcpdump' to: '/tmp/static-tcpdump'
INFO[0000] uploading file: '/Users/sjkim/.krew/store/sniff/v1.6.2/static-tcpdump' to '/tmp/static-tcpdump' on container: 'catalog'
INFO[0000] executing command: '[/bin/sh -c test -f /tmp/static-tcpdump]' on container: 'catalog', pod: 'catalog-v2-56c97f6db-n5rx8', namespace: 'istioinaction'
INFO[0000] command: '[/bin/sh -c test -f /tmp/static-tcpdump]' executing successfully exitCode: '0', stdErr :''
INFO[0000] file found: ''
INFO[0000] file was already found on remote pod
INFO[0000] tcpdump uploaded successfully
INFO[0000] spawning wireshark!
INFO[0000] start sniffing on remote container
INFO[0000] executing command: '[/tmp/static-tcpdump -i lo -U -w - ]' on container: 'catalog', pod: 'catalog-v2-56c97f6db-n5rx8', namespace: 'istioinaction' - wireshark GUI가 자동 실행 됨
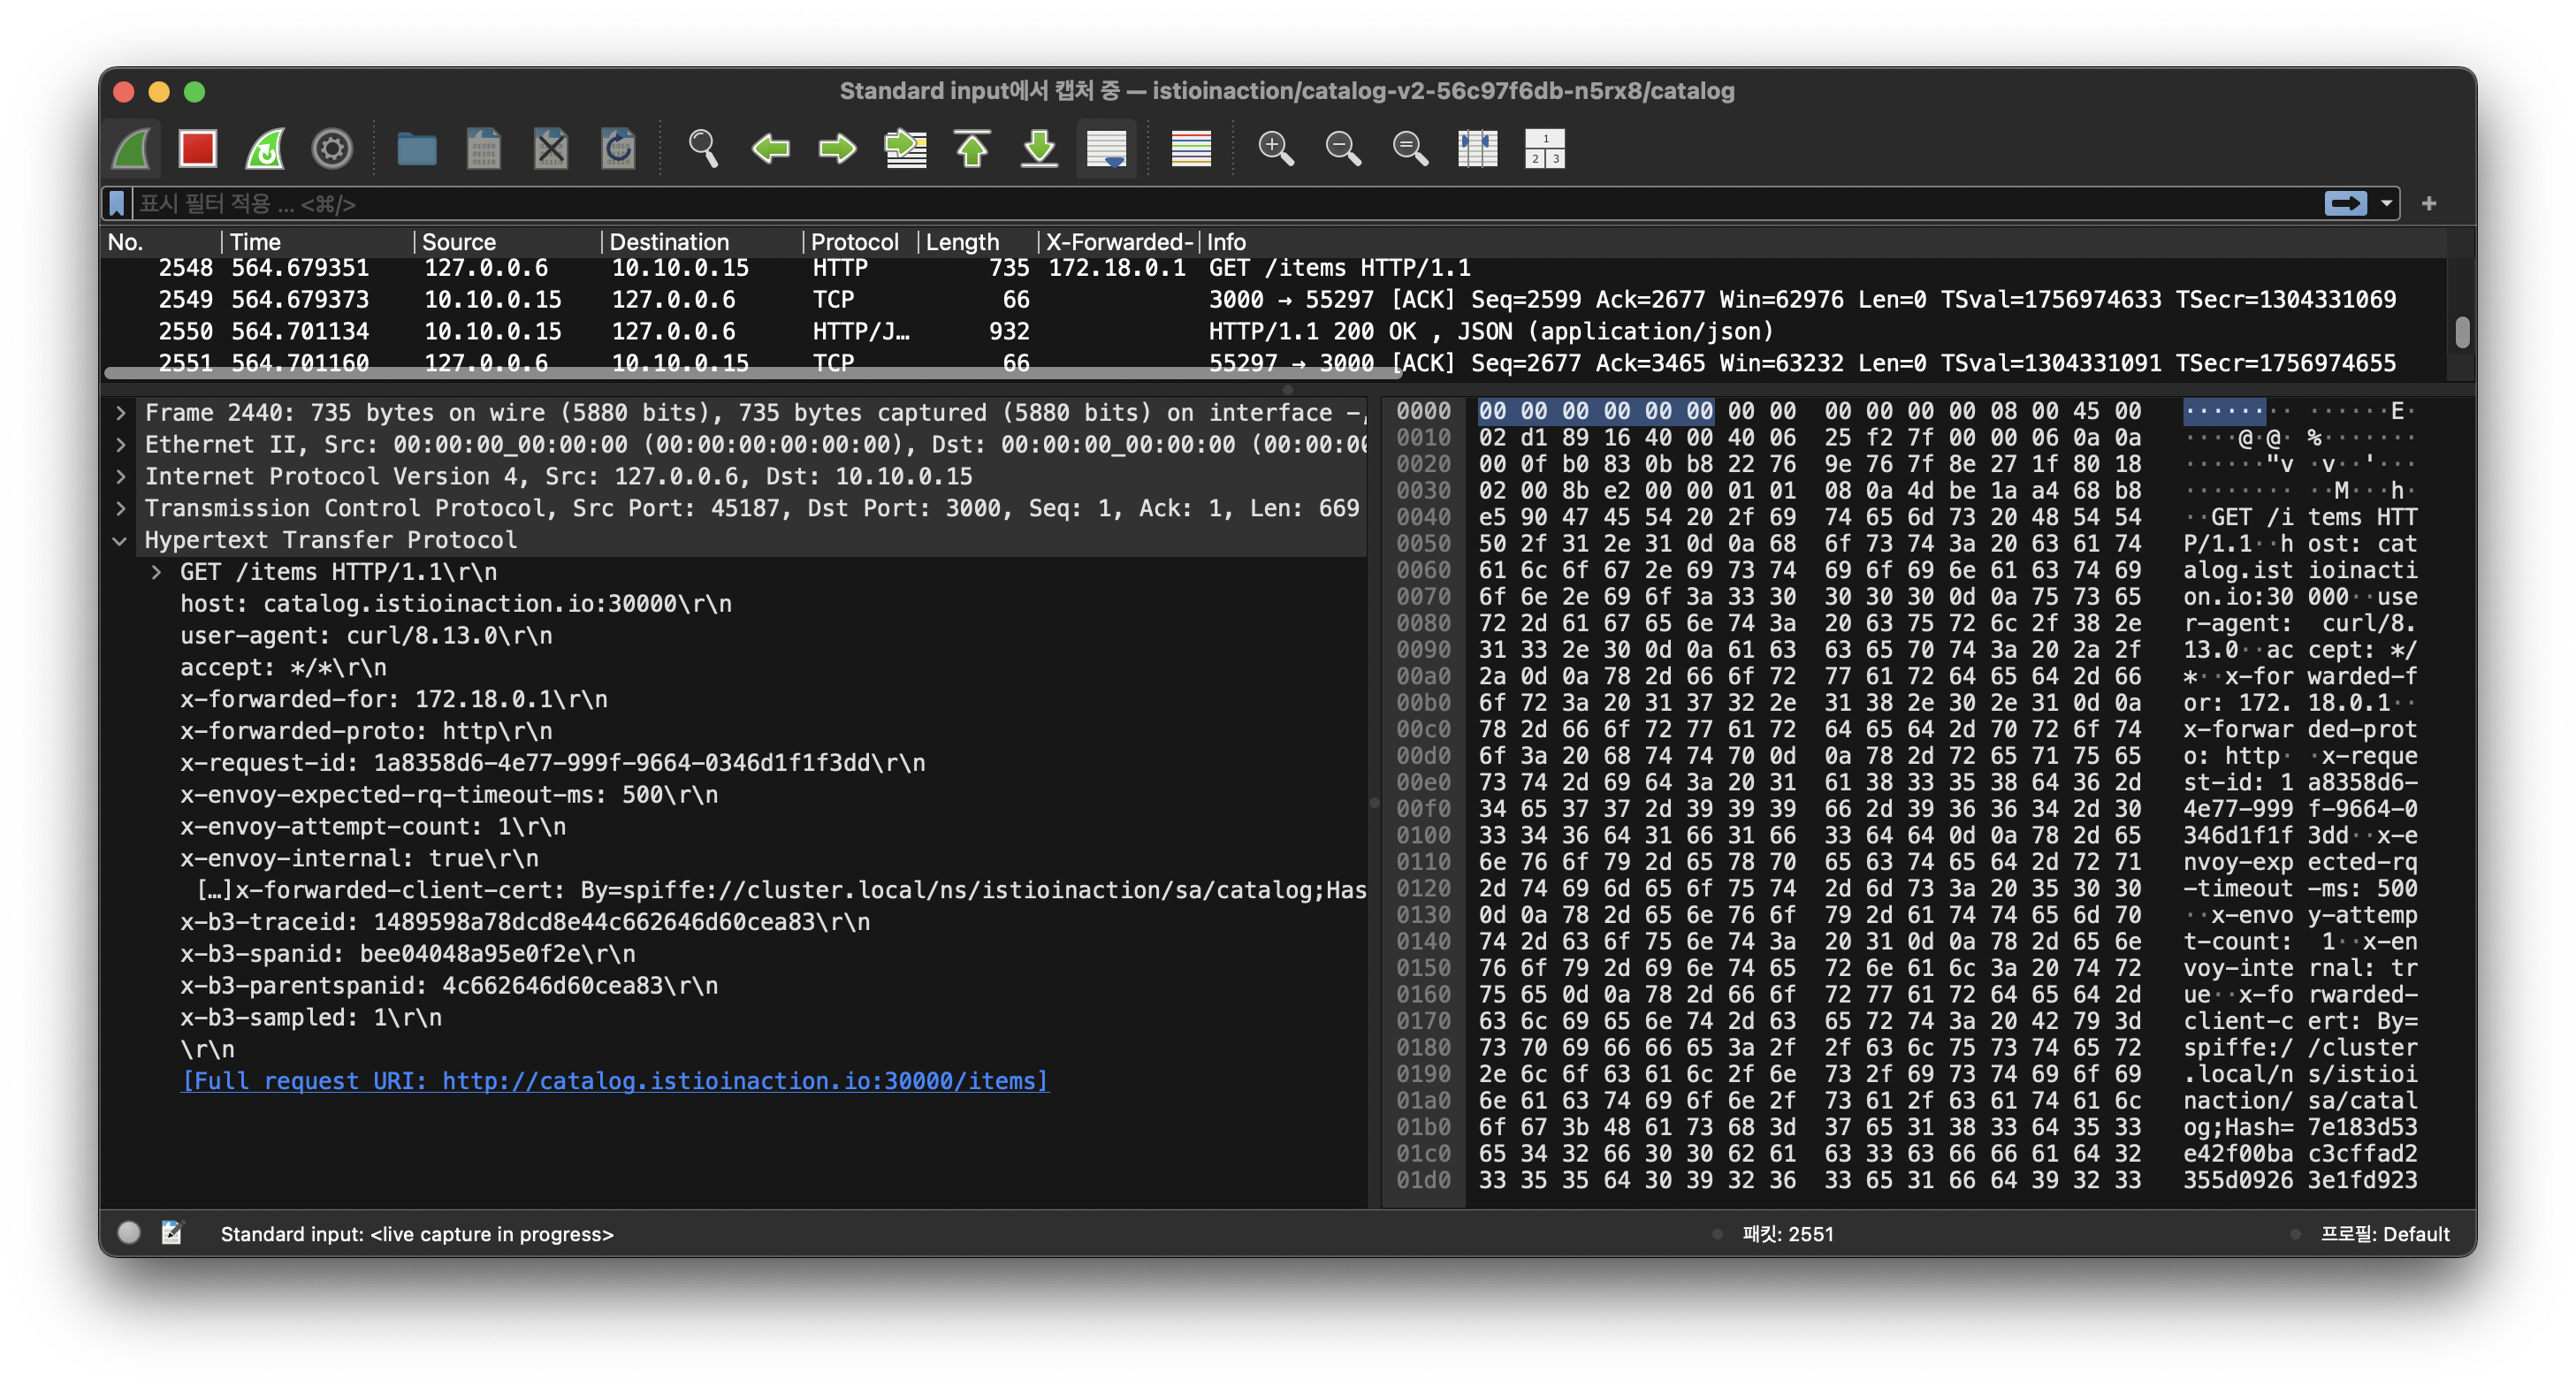
🛠️ 1. 특정 파드에서 tcpdump 후 wireshark 로 불러오기
# slow 파드 정보 확인
CATALOG_POD=$(kubectl get pods -l version=v2 -n istioinaction -o jsonpath={.items..metadata.name} | cut -d ' ' -f1)
kubectl get pod -n istioinaction $CATALOG_POD -owide
NAME                         READY   STATUS    RESTARTS   AGE   IP           NODE                  NOMINATED NODE   READINESS GATES
catalog-v2-56c97f6db-n5rx8   2/2     Running   0          14h   10.10.0.15   myk8s-control-plane   <none>           <none>

# catalog 서비스 정보 확인
kubectl get svc,ep -n istioinaction
NAME              TYPE        CLUSTER-IP     EXTERNAL-IP   PORT(S)   AGE
service/catalog   ClusterIP   10.200.2.118   <none>        80/TCP    14h

NAME                ENDPOINTS                                         AGE
endpoints/catalog   10.10.0.13:3000,10.10.0.14:3000,10.10.0.15:3000   14h

# istio-proxy 에서 기본 정보 확인
kubectl exec -it -n istioinaction $CATALOG_POD -c istio-proxy -- sudo whoami
root

kubectl exec -it -n istioinaction $CATALOG_POD -c istio-proxy -- tcpdump -h
tcpdump version 4.99.1
libpcap version 1.10.1 (with TPACKET_V3)
OpenSSL 3.0.2 15 Mar 2022
Usage: tcpdump [-AbdDefhHIJKlLnNOpqStuUvxX#] [ -B size ] [ -c count ] [--count]
                [ -C file_size ] [ -E algo:secret ] [ -F file ] [ -G seconds ]
                [ -i interface ] [ --immediate-mode ] [ -j tstamptype ]
                [ -M secret ] [ --number ] [ --print ] [ -Q in|out|inout ]
                [ -r file ] [ -s snaplen ] [ -T type ] [ --version ]
                [ -V file ] [ -w file ] [ -W filecount ] [ -y datalinktype ]
                [ --time-stamp-precision precision ] [ --micro ] [ --nano ]
                [ -z postrotate-command ] [ -Z user ] [ expression ]

kubectl exec -it -n istioinaction $CATALOG_POD -c istio-proxy -- ip -c addr
1: lo: <LOOPBACK,UP,LOWER_UP> mtu 65536 qdisc noqueue state UNKNOWN group default qlen 1000
    link/loopback 00:00:00:00:00:00 brd 00:00:00:00:00:00
    inet 127.0.0.1/8 scope host lo
       valid_lft forever preferred_lft forever
    inet6 ::1/128 scope host
       valid_lft forever preferred_lft forever
2: eth0@if16: <BROADCAST,MULTICAST,UP,LOWER_UP> mtu 1500 qdisc noqueue state UP group default
    link/ether 02:69:20:d0:bb:c2 brd ff:ff:ff:ff:ff:ff link-netnsid 0
    inet 10.10.0.15/24 brd 10.10.0.255 scope global eth0
       valid_lft forever preferred_lft forever
    inet6 fe80::69:20ff:fed0:bbc2/64 scope link
       valid_lft forever preferred_lft forever

kubectl exec -it -n istioinaction $CATALOG_POD -c istio-proxy -- ip add show dev eth0
2: eth0@if16: <BROADCAST,MULTICAST,UP,LOWER_UP> mtu 1500 qdisc noqueue state UP group default
    link/ether 02:69:20:d0:bb:c2 brd ff:ff:ff:ff:ff:ff link-netnsid 0
    inet 10.10.0.15/24 brd 10.10.0.255 scope global eth0
       valid_lft forever preferred_lft forever
    inet6 fe80::69:20ff:fed0:bbc2/64 scope link
       valid_lft forever preferred_lft forever

kubectl exec -it -n istioinaction $CATALOG_POD -c istio-proxy -- ip add show dev lo
1: lo: <LOOPBACK,UP,LOWER_UP> mtu 65536 qdisc noqueue state UNKNOWN group default qlen 1000
    link/loopback 00:00:00:00:00:00 brd 00:00:00:00:00:00
    inet 127.0.0.1/8 scope host lo
       valid_lft forever preferred_lft forever
    inet6 ::1/128 scope host
       valid_lft forever preferred_lft forever

# istio-proxy 에 eth0 에서 패킷 덤프
kubectl exec -it -n istioinaction $CATALOG_POD -c istio-proxy -- sudo tcpdump -i eth0 tcp port 3000 -nnq
tcpdump: verbose output suppressed, use -v[v]... for full protocol decode
listening on eth0, link-type EN10MB (Ethernet), snapshot length 262144 bytes
06:43:28.793599 IP 10.10.0.8.54774 > 10.10.0.15.3000: tcp 1662
06:43:28.793620 IP 10.10.0.15.3000 > 10.10.0.8.54774: tcp 0
06:43:28.948325 IP 10.10.0.15.3000 > 10.10.0.8.54774: tcp 1754
06:43:28.948369 IP 10.10.0.8.54774 > 10.10.0.15.3000: tcp 0
06:43:31.015804 IP 10.10.0.8.54774 > 10.10.0.15.3000: tcp 1662
06:43:31.015820 IP 10.10.0.15.3000 > 10.10.0.8.54774: tcp 0
06:43:31.517681 IP 10.10.0.8.54774 > 10.10.0.15.3000: tcp 24
06:43:31.517853 IP 10.10.0.8.54774 > 10.10.0.15.3000: tcp 0
06:43:31.518039 IP 10.10.0.15.3000 > 10.10.0.8.54774: tcp 24
06:43:31.518106 IP 10.10.0.8.54774 > 10.10.0.15.3000: tcp 0

kubectl exec -it -n istioinaction $CATALOG_POD -c istio-proxy -- sudo tcpdump -i eth0 tcp port 3000 -nn
tcpdump: verbose output suppressed, use -v[v]... for full protocol decode
listening on eth0, link-type EN10MB (Ethernet), snapshot length 262144 bytes
06:44:34.534088 IP 10.10.0.8.40390 > 10.10.0.15.3000: Flags [P.], seq 3821411308:3821412970, ack 4237400927, win 649, options [nop,nop,TS val 1554941631 ecr 1753987228], length 1662
06:44:34.534110 IP 10.10.0.15.3000 > 10.10.0.8.40390: Flags [.], ack 1662, win 610, options [nop,nop,TS val 1753991392 ecr 1554941631], length 0
06:44:35.036601 IP 10.10.0.8.40390 > 10.10.0.15.3000: Flags [P.], seq 1662:1686, ack 1, win 649, options [nop,nop,TS val 1554942133 ecr 1753991392], length 24
06:44:35.036695 IP 10.10.0.8.40390 > 10.10.0.15.3000: Flags [F.], seq 1686, ack 1, win 649, options [nop,nop,TS val 1554942133 ecr 1753991392], length 0
06:44:35.036794 IP 10.10.0.15.3000 > 10.10.0.8.40390: Flags [P.], seq 1:25, ack 1687, win 610, options [nop,nop,TS val 1753991894 ecr 1554942133], length 24
06:44:35.036846 IP 10.10.0.8.40390 > 10.10.0.15.3000: Flags [R], seq 3821412995, win 0, length 0
06:44:36.069856 IP 10.10.0.8.42770 > 10.10.0.15.3000: Flags [S], seq 3286778002, win 64240, options [mss 1460,sackOK,TS val 1554943166 ecr 0,nop,wscale 7], length 0
06:44:36.069870 IP 10.10.0.15.3000 > 10.10.0.8.42770: Flags [S.], seq 1312502134, ack 3286778003, win 65160, options [mss 1460,sackOK,TS val 1753992927 ecr 1554943166,nop,wscale 7], length 0
06:44:36.069881 IP 10.10.0.8.42770 > 10.10.0.15.3000: Flags [.], ack 1, win 502, options [nop,nop,TS val 1554943166 ecr 1753992927], length 0
06:44:36.070079 IP 10.10.0.8.42770 > 10.10.0.15.3000: Flags [P.], seq 1:2224, ack 1, win 502, options [nop,nop,TS val 1554943167 ecr 1753992927], length 2223
06:44:36.070090 IP 10.10.0.15.3000 > 10.10.0.8.42770: Flags [.], ack 2224, win 536, options [nop,nop,TS val 1753992928 ecr 1554943167], length 0
06:44:36.070361 IP 10.10.0.15.3000 > 10.10.0.8.42770: Flags [P.], seq 1:219, ack 2224, win 536, options [nop,nop,TS val 1753992928 ecr 1554943167], length 218
06:44:36.070382 IP 10.10.0.8.42770 > 10.10.0.15.3000: Flags [.], ack 219, win 501, options [nop,nop,TS val 1554943167 ecr 1753992928], length 0
06:44:36.070601 IP 10.10.0.8.42770 > 10.10.0.15.3000: Flags [P.], seq 2224:2288, ack 219, win 501, options [nop,nop,TS val 1554943167 ecr 1753992928], length 64
06:44:36.070696 IP 10.10.0.8.42770 > 10.10.0.15.3000: Flags [P.], seq 2288:3950, ack 219, win 501, options [nop,nop,TS val 1554943167 ecr 1753992928], length 1662
06:44:36.070700 IP 10.10.0.15.3000 > 10.10.0.8.42770: Flags [.], ack 3950, win 562, options [nop,nop,TS val 1753992928 ecr 1554943167], length 0
06:44:36.112885 IP 10.10.0.15.3000 > 10.10.0.8.42770: Flags [P.], seq 219:5750, ack 3950, win 562, options [nop,nop,TS val 1753992970 ecr 1554943167], length 5531
06:44:36.112919 IP 10.10.0.8.42770 > 10.10.0.15.3000: Flags [.], ack 5750, win 588, options [nop,nop,TS val 1554943209 ecr 1753992970], length 0
06:44:39.210071 IP 10.10.0.8.42782 > 10.10.0.15.3000: Flags [S], seq 2079876531, win 64240, options [mss 1460,sackOK,TS val 1554946307 ecr 0,nop,wscale 7], length 0
06:44:39.210088 IP 10.10.0.15.3000 > 10.10.0.8.42782: Flags [S.], seq 3199265653, ack 2079876532, win 65160, options [mss 1460,sackOK,TS val 1753996068 ecr 1554946307,nop,wscale 7], length 0
06:44:39.210099 IP 10.10.0.8.42782 > 10.10.0.15.3000: Flags [.], ack 1, win 502, options [nop,nop,TS val 1554946307 ecr 1753996068], length 0
06:44:39.210241 IP 10.10.0.8.42782 > 10.10.0.15.3000: Flags [P.], seq 1:2224, ack 1, win 502, options [nop,nop,TS val 1554946307 ecr 1753996068], length 2223
06:44:39.210246 IP 10.10.0.15.3000 > 10.10.0.8.42782: Flags [.], ack 2224, win 536, options [nop,nop,TS val 1753996068 ecr 1554946307], length 0
06:44:39.210451 IP 10.10.0.15.3000 > 10.10.0.8.42782: Flags [P.], seq 1:219, ack 2224, win 536, options [nop,nop,TS val 1753996068 ecr 1554946307], length 218
06:44:39.210478 IP 10.10.0.8.42782 > 10.10.0.15.3000: Flags [.], ack 219, win 501, options [nop,nop,TS val 1554946307 ecr 1753996068], length 0
06:44:39.210639 IP 10.10.0.8.42782 > 10.10.0.15.3000: Flags [P.], seq 2224:2288, ack 219, win 501, options [nop,nop,TS val 1554946307 ecr 1753996068], length 64
06:44:39.210722 IP 10.10.0.8.42782 > 10.10.0.15.3000: Flags [P.], seq 2288:3950, ack 219, win 501, options [nop,nop,TS val 1554946307 ecr 1753996068], length 1662
06:44:39.210726 IP 10.10.0.15.3000 > 10.10.0.8.42782: Flags [.], ack 3950, win 562, options [nop,nop,TS val 1753996068 ecr 1554946307], length 0
06:44:39.500301 IP 10.10.0.15.3000 > 10.10.0.8.42782: Flags [P.], seq 219:5751, ack 3950, win 562, options [nop,nop,TS val 1753996358 ecr 1554946307], length 5532
06:44:39.500361 IP 10.10.0.8.42782 > 10.10.0.15.3000: Flags [.], ack 5751, win 588, options [nop,nop,TS val 1554946597 ecr 1753996358], length 0
^C
30 packets captured
30 packets received by filter
0 packets dropped by kernel

kubectl exec -it -n istioinaction $CATALOG_POD -c istio-proxy -- sudo tcpdump -i eth0 tcp port 3000
tcpdump: verbose output suppressed, use -v[v]... for full protocol decode
listening on eth0, link-type EN10MB (Ethernet), snapshot length 262144 bytes
06:45:09.413001 IP 10-10-0-8.istio-ingressgateway.istio-system.svc.cluster.local.42782 > catalog-v2-56c97f6db-n5rx8.3000: Flags [P.], seq 2079883805:2079883829, ack 3199273158, win 615, options [nop,nop,TS val 1554976509 ecr 1754025769], length 24
06:45:09.413088 IP 10-10-0-8.istio-ingressgateway.istio-system.svc.cluster.local.42782 > catalog-v2-56c97f6db-n5rx8.3000: Flags [F.], seq 24, ack 1, win 615, options [nop,nop,TS val 1554976510 ecr 1754025769], length 0
06:45:09.413208 IP catalog-v2-56c97f6db-n5rx8.3000 > 10-10-0-8.istio-ingressgateway.istio-system.svc.cluster.local.42782: Flags [P.], seq 1:25, ack 25, win 614, options [nop,nop,TS val 1754026271 ecr 1554976509], length 24
06:45:09.413294 IP 10-10-0-8.istio-ingressgateway.istio-system.svc.cluster.local.42782 > catalog-v2-56c97f6db-n5rx8.3000: Flags [R], seq 2079883830, win 0, length 0
06:45:10.442714 IP 10-10-0-8.istio-ingressgateway.istio-system.svc.cluster.local.33478 > catalog-v2-56c97f6db-n5rx8.3000: Flags [S], seq 4239733808, win 64240, options [mss 1460,sackOK,TS val 1554977539 ecr 0,nop,wscale 7], length 0
06:45:10.442725 IP catalog-v2-56c97f6db-n5rx8.3000 > 10-10-0-8.istio-ingressgateway.istio-system.svc.cluster.local.33478: Flags [S.], seq 2810358424, ack 4239733809, win 65160, options [mss 1460,sackOK,TS val 1754027300 ecr 1554977539,nop,wscale 7], length 0
06:45:10.442732 IP 10-10-0-8.istio-ingressgateway.istio-system.svc.cluster.local.33478 > catalog-v2-56c97f6db-n5rx8.3000: Flags [.], ack 1, win 502, options [nop,nop,TS val 1554977539 ecr 1754027300], length 0
06:45:10.442892 IP 10-10-0-8.istio-ingressgateway.istio-system.svc.cluster.local.33478 > catalog-v2-56c97f6db-n5rx8.3000: Flags [P.], seq 1:518, ack 1, win 502, options [nop,nop,TS val 1554977539 ecr 1754027300], length 517
06:45:10.442899 IP catalog-v2-56c97f6db-n5rx8.3000 > 10-10-0-8.istio-ingressgateway.istio-system.svc.cluster.local.33478: Flags [.], ack 518, win 506, options [nop,nop,TS val 1754027300 ecr 1554977539], length 0
06:45:10.445194 IP catalog-v2-56c97f6db-n5rx8.3000 > 10-10-0-8.istio-ingressgateway.istio-system.svc.cluster.local.33478: Flags [P.], seq 1:2171, ack 518, win 506, options [nop,nop,TS val 1754027303 ecr 1554977539], length 2170
06:45:10.445210 IP 10-10-0-8.istio-ingressgateway.istio-system.svc.cluster.local.33478 > catalog-v2-56c97f6db-n5rx8.3000: Flags [.], ack 2171, win 535, options [nop,nop,TS val 1554977542 ecr 1754027303], length 0
06:45:10.447451 IP 10-10-0-8.istio-ingressgateway.istio-system.svc.cluster.local.33478 > catalog-v2-56c97f6db-n5rx8.3000: Flags [P.], seq 518:2504, ack 2171, win 535, options [nop,nop,TS val 1554977544 ecr 1754027303], length 1986
06:45:10.447462 IP catalog-v2-56c97f6db-n5rx8.3000 > 10-10-0-8.istio-ingressgateway.istio-system.svc.cluster.local.33478: Flags [.], ack 2504, win 532, options [nop,nop,TS val 1754027305 ecr 1554977544], length 0
06:45:10.447574 IP 10-10-0-8.istio-ingressgateway.istio-system.svc.cluster.local.33478 > catalog-v2-56c97f6db-n5rx8.3000: Flags [P.], seq 2504:4166, ack 2171, win 535, options [nop,nop,TS val 1554977544 ecr 1754027305], length 1662
06:45:10.447578 IP catalog-v2-56c97f6db-n5rx8.3000 > 10-10-0-8.istio-ingressgateway.istio-system.svc.cluster.local.33478: Flags [.], ack 4166, win 558, options [nop,nop,TS val 1754027305 ecr 1554977544], length 0
06:45:10.943360 IP 10-10-0-8.istio-ingressgateway.istio-system.svc.cluster.local.33478 > catalog-v2-56c97f6db-n5rx8.3000: Flags [P.], seq 4166:4190, ack 2171, win 535, options [nop,nop,TS val 1554978040 ecr 1754027305], length 24
06:45:10.943437 IP 10-10-0-8.istio-ingressgateway.istio-system.svc.cluster.local.33478 > catalog-v2-56c97f6db-n5rx8.3000: Flags [F.], seq 4190, ack 2171, win 535, options [nop,nop,TS val 1554978040 ecr 1754027305], length 0
06:45:10.943562 IP catalog-v2-56c97f6db-n5rx8.3000 > 10-10-0-8.istio-ingressgateway.istio-system.svc.cluster.local.33478: Flags [P.], seq 2171:5973, ack 4191, win 558, options [nop,nop,TS val 1754027801 ecr 1554978040], length 3802
06:45:10.943614 IP 10-10-0-8.istio-ingressgateway.istio-system.svc.cluster.local.33478 > catalog-v2-56c97f6db-n5rx8.3000: Flags [R], seq 4239737999, win 0, length 0
06:45:13.049354 IP 10-10-0-8.istio-ingressgateway.istio-system.svc.cluster.local.45344 > catalog-v2-56c97f6db-n5rx8.3000: Flags [P.], seq 1585597319:1585598981, ack 1363161063, win 622, options [nop,nop,TS val 1554980146 ecr 1754015537], length 1662
06:45:13.049383 IP catalog-v2-56c97f6db-n5rx8.3000 > 10-10-0-8.istio-ingressgateway.istio-system.svc.cluster.local.45344: Flags [.], ack 1662, win 584, options [nop,nop,TS val 1754029907 ecr 1554980146], length 0
06:45:13.549670 IP 10-10-0-8.istio-ingressgateway.istio-system.svc.cluster.local.45344 > catalog-v2-56c97f6db-n5rx8.3000: Flags [P.], seq 1662:1686, ack 1, win 622, options [nop,nop,TS val 1554980646 ecr 1754029907], length 24
06:45:13.549710 IP 10-10-0-8.istio-ingressgateway.istio-system.svc.cluster.local.45344 > catalog-v2-56c97f6db-n5rx8.3000: Flags [F.], seq 1686, ack 1, win 622, options [nop,nop,TS val 1554980646 ecr 1754029907], length 0
06:45:13.549740 IP catalog-v2-56c97f6db-n5rx8.3000 > 10-10-0-8.istio-ingressgateway.istio-system.svc.cluster.local.45344: Flags [P.], seq 1:25, ack 1687, win 584, options [nop,nop,TS val 1754030407 ecr 1554980646], length 24
06:45:13.549767 IP 10-10-0-8.istio-ingressgateway.istio-system.svc.cluster.local.45344 > catalog-v2-56c97f6db-n5rx8.3000: Flags [R], seq 1585599006, win 0, length 0
06:45:16.658838 IP 10-10-0-8.istio-ingressgateway.istio-system.svc.cluster.local.40424 > catalog-v2-56c97f6db-n5rx8.3000: Flags [S], seq 1836498839, win 64240, options [mss 1460,sackOK,TS val 1554983755 ecr 0,nop,wscale 7], length 0
06:45:16.658863 IP catalog-v2-56c97f6db-n5rx8.3000 > 10-10-0-8.istio-ingressgateway.istio-system.svc.cluster.local.40424: Flags [S.], seq 821545520, ack 1836498840, win 65160, options [mss 1460,sackOK,TS val 1754033516 ecr 1554983755,nop,wscale 7], length 0
06:45:16.658881 IP 10-10-0-8.istio-ingressgateway.istio-system.svc.cluster.local.40424 > catalog-v2-56c97f6db-n5rx8.3000: Flags [.], ack 1, win 502, options [nop,nop,TS val 1554983755 ecr 1754033516], length 0
06:45:16.659076 IP 10-10-0-8.istio-ingressgateway.istio-system.svc.cluster.local.40424 > catalog-v2-56c97f6db-n5rx8.3000: Flags [P.], seq 1:518, ack 1, win 502, options [nop,nop,TS val 1554983756 ecr 1754033516], length 517
06:45:16.659086 IP catalog-v2-56c97f6db-n5rx8.3000 > 10-10-0-8.istio-ingressgateway.istio-system.svc.cluster.local.40424: Flags [.], ack 518, win 506, options [nop,nop,TS val 1754033517 ecr 1554983756], length 0
06:45:16.662898 IP catalog-v2-56c97f6db-n5rx8.3000 > 10-10-0-8.istio-ingressgateway.istio-system.svc.cluster.local.40424: Flags [P.], seq 1:2171, ack 518, win 506, options [nop,nop,TS val 1754033520 ecr 1554983756], length 2170
06:45:16.662927 IP 10-10-0-8.istio-ingressgateway.istio-system.svc.cluster.local.40424 > catalog-v2-56c97f6db-n5rx8.3000: Flags [.], ack 2171, win 535, options [nop,nop,TS val 1554983759 ecr 1754033520], length 0
06:45:16.666819 IP 10-10-0-8.istio-ingressgateway.istio-system.svc.cluster.local.40424 > catalog-v2-56c97f6db-n5rx8.3000: Flags [P.], seq 518:2504, ack 2171, win 535, options [nop,nop,TS val 1554983763 ecr 1754033520], length 1986
06:45:16.666838 IP catalog-v2-56c97f6db-n5rx8.3000 > 10-10-0-8.istio-ingressgateway.istio-system.svc.cluster.local.40424: Flags [.], ack 2504, win 532, options [nop,nop,TS val 1754033524 ecr 1554983763], length 0
06:45:16.666986 IP 10-10-0-8.istio-ingressgateway.istio-system.svc.cluster.local.40424 > catalog-v2-56c97f6db-n5rx8.3000: Flags [P.], seq 2504:4166, ack 2171, win 535, options [nop,nop,TS val 1554983764 ecr 1754033524], length 1662
06:45:16.666992 IP catalog-v2-56c97f6db-n5rx8.3000 > 10-10-0-8.istio-ingressgateway.istio-system.svc.cluster.local.40424: Flags [.], ack 4166, win 558, options [nop,nop,TS val 1754033525 ecr 1554983764], length 0
06:45:17.159890 IP 10-10-0-8.istio-ingressgateway.istio-system.svc.cluster.local.40424 > catalog-v2-56c97f6db-n5rx8.3000: Flags [P.], seq 4166:4190, ack 2171, win 535, options [nop,nop,TS val 1554984256 ecr 1754033525], length 24
06:45:17.159995 IP 10-10-0-8.istio-ingressgateway.istio-system.svc.cluster.local.40424 > catalog-v2-56c97f6db-n5rx8.3000: Flags [F.], seq 4190, ack 2171, win 535, options [nop,nop,TS val 1554984257 ecr 1754033525], length 0
06:45:17.160039 IP catalog-v2-56c97f6db-n5rx8.3000 > 10-10-0-8.istio-ingressgateway.istio-system.svc.cluster.local.40424: Flags [P.], seq 2171:5973, ack 4191, win 558, options [nop,nop,TS val 1754034018 ecr 1554984256], length 3802
06:45:17.160081 IP 10-10-0-8.istio-ingressgateway.istio-system.svc.cluster.local.40424 > catalog-v2-56c97f6db-n5rx8.3000: Flags [R], seq 1836503030, win 0, length 0
^C
40 packets captured
40 packets received by filter
0 packets dropped by kernel

# istio-proxy 에 lo 에서 패킷 덤프
kubectl exec -it -n istioinaction $CATALOG_POD -c istio-proxy -- sudo tcpdump -i lo -nnq
tcpdump: verbose output suppressed, use -v[v]... for full protocol decode
listening on lo, link-type EN10MB (Ethernet), snapshot length 262144 bytes
06:45:50.833689 IP 127.0.0.1.40734 > 127.0.0.1.15020: tcp 213
06:45:50.834054 IP 127.0.0.1.15020 > 127.0.0.1.40734: tcp 75
06:45:50.834068 IP 127.0.0.1.40734 > 127.0.0.1.15020: tcp 0
06:45:52.050815 IP 127.0.0.6.58051 > 10.10.0.15.3000: tcp 0
06:45:52.050921 IP 10.10.0.15.3000 > 127.0.0.6.58051: tcp 0
06:45:52.051017 IP 127.0.0.6.58051 > 10.10.0.15.3000: tcp 0
06:45:52.051235 IP 127.0.0.6.58051 > 10.10.0.15.3000: tcp 669
06:45:52.051246 IP 10.10.0.15.3000 > 127.0.0.6.58051: tcp 0
06:45:52.065737 IP 10.10.0.15.3000 > 127.0.0.6.58051: tcp 866
06:45:52.065759 IP 127.0.0.6.58051 > 10.10.0.15.3000: tcp 0
06:45:52.834706 IP 127.0.0.1.40720 > 127.0.0.1.15020: tcp 213
06:45:52.835125 IP 127.0.0.1.15020 > 127.0.0.1.40720: tcp 75
06:45:52.835146 IP 127.0.0.1.40720 > 127.0.0.1.15020: tcp 0
06:45:54.151480 IP 127.0.0.6.58051 > 10.10.0.15.3000: tcp 669
06:45:54.169590 IP 10.10.0.15.3000 > 127.0.0.6.58051: tcp 866
06:45:54.169610 IP 127.0.0.6.58051 > 10.10.0.15.3000: tcp 0
06:45:54.518607 IP 127.0.0.1.50736 > 127.0.0.1.15090: tcp 295
06:45:54.518836 IP 127.0.0.1.58894 > 127.0.0.1.15000: tcp 411
06:45:54.520283 IP 127.0.0.1.15000 > 127.0.0.1.58894: tcp 65483
06:45:54.520298 IP 127.0.0.1.58894 > 127.0.0.1.15000: tcp 0
06:45:54.520346 IP 127.0.0.1.15000 > 127.0.0.1.58894: tcp 65483
06:45:54.520386 IP 127.0.0.1.15000 > 127.0.0.1.58894: tcp 33611
06:45:54.520402 IP 127.0.0.1.58894 > 127.0.0.1.15000: tcp 0
06:45:54.520744 IP 127.0.0.1.15090 > 127.0.0.1.50736: tcp 65483
06:45:54.520754 IP 127.0.0.1.50736 > 127.0.0.1.15090: tcp 0
06:45:54.520801 IP 127.0.0.1.15090 > 127.0.0.1.50736: tcp 65483
06:45:54.520804 IP 127.0.0.1.50736 > 127.0.0.1.15090: tcp 0
06:45:54.520842 IP 127.0.0.1.15090 > 127.0.0.1.50736: tcp 33645
06:45:54.520845 IP 127.0.0.1.50736 > 127.0.0.1.15090: tcp 0
06:45:54.837655 IP 127.0.0.1.40734 > 127.0.0.1.15020: tcp 213
06:45:54.844304 IP 127.0.0.1.15020 > 127.0.0.1.40734: tcp 75
06:45:54.844332 IP 127.0.0.1.40734 > 127.0.0.1.15020: tcp 0
06:45:54.935290 IP 10.10.0.15.3000 > 127.0.0.6.42227: tcp 0
06:45:54.935394 IP 127.0.0.6.42227 > 10.10.0.15.3000: tcp 0
06:45:54.935410 IP 10.10.0.15.3000 > 127.0.0.6.42227: tcp 0
06:45:55.206965 IP 127.0.0.6.60139 > 10.10.0.15.3000: tcp 0
06:45:55.206974 IP 10.10.0.15.3000 > 127.0.0.6.60139: tcp 0
06:45:55.206980 IP 127.0.0.6.60139 > 10.10.0.15.3000: tcp 0
06:45:55.207053 IP 127.0.0.6.60139 > 10.10.0.15.3000: tcp 669
06:45:55.207058 IP 10.10.0.15.3000 > 127.0.0.6.60139: tcp 0
06:45:55.707911 IP 127.0.0.6.60139 > 10.10.0.15.3000: tcp 0
06:45:55.708475 IP 10.10.0.15.3000 > 127.0.0.6.60139: tcp 0
06:45:55.708492 IP 127.0.0.6.60139 > 10.10.0.15.3000: tcp 0
06:45:56.834442 IP 127.0.0.1.40720 > 127.0.0.1.15020: tcp 213
06:45:56.834566 IP 127.0.0.1.15020 > 127.0.0.1.40720: tcp 75
06:45:56.834575 IP 127.0.0.1.40720 > 127.0.0.1.15020: tcp 0
06:45:57.794736 IP 127.0.0.6.46671 > 10.10.0.15.3000: tcp 0
06:45:57.794758 IP 10.10.0.15.3000 > 127.0.0.6.46671: tcp 0
06:45:57.794768 IP 127.0.0.6.46671 > 10.10.0.15.3000: tcp 0
06:45:57.794865 IP 127.0.0.6.46671 > 10.10.0.15.3000: tcp 669
06:45:57.794873 IP 10.10.0.15.3000 > 127.0.0.6.46671: tcp 0
06:45:58.297284 IP 127.0.0.6.46671 > 10.10.0.15.3000: tcp 0
06:45:58.297760 IP 10.10.0.15.3000 > 127.0.0.6.46671: tcp 0
06:45:58.297770 IP 127.0.0.6.46671 > 10.10.0.15.3000: tcp 0
^C
54 packets captured
108 packets received by filter
0 packets dropped by kernel

# istio-proxy 에 tcp port 3000 에서 패킷 덤프
kubectl exec -it -n istioinaction $CATALOG_POD -c istio-proxy -- sudo tcpdump -i any tcp port 3000 -nnq
tcpdump: data link type LINUX_SLL2
tcpdump: verbose output suppressed, use -v[v]... for full protocol decode
listening on any, link-type LINUX_SLL2 (Linux cooked v2), snapshot length 262144 bytes
06:46:28.438403 eth0  In  IP 10.10.0.8.57364 > 10.10.0.15.3000: tcp 1662
06:46:28.438426 eth0  Out IP 10.10.0.15.3000 > 10.10.0.8.57364: tcp 0
06:46:28.439028 lo    In  IP 127.0.0.6.56925 > 10.10.0.15.3000: tcp 669
06:46:28.439047 lo    In  IP 10.10.0.15.3000 > 127.0.0.6.56925: tcp 0
06:46:28.563614 lo    In  IP 10.10.0.15.3000 > 127.0.0.6.56925: tcp 866
06:46:28.563639 lo    In  IP 127.0.0.6.56925 > 10.10.0.15.3000: tcp 0
06:46:28.564245 eth0  Out IP 10.10.0.15.3000 > 10.10.0.8.57364: tcp 1754
06:46:28.564290 eth0  In  IP 10.10.0.8.57364 > 10.10.0.15.3000: tcp 0
06:46:30.634238 eth0  In  IP 10.10.0.8.36234 > 10.10.0.15.3000: tcp 1662
06:46:30.634250 eth0  Out IP 10.10.0.15.3000 > 10.10.0.8.36234: tcp 0
06:46:30.634427 lo    In  IP 127.0.0.6.56925 > 10.10.0.15.3000: tcp 669
06:46:30.634440 lo    In  IP 10.10.0.15.3000 > 127.0.0.6.56925: tcp 0
06:46:30.686233 lo    In  IP 10.10.0.15.3000 > 127.0.0.6.56925: tcp 866
06:46:30.686254 lo    In  IP 127.0.0.6.56925 > 10.10.0.15.3000: tcp 0
06:46:30.686671 eth0  Out IP 10.10.0.15.3000 > 10.10.0.8.36234: tcp 1753
06:46:30.686709 eth0  In  IP 10.10.0.8.36234 > 10.10.0.15.3000: tcp 0
06:46:35.688468 lo    In  IP 10.10.0.15.3000 > 127.0.0.6.56925: tcp 0
06:46:35.688596 lo    In  IP 127.0.0.6.56925 > 10.10.0.15.3000: tcp 0
06:46:35.688638 lo    In  IP 10.10.0.15.3000 > 127.0.0.6.56925: tcp 0
^C
19 packets captured
30 packets received by filter
0 packets dropped by kernel

kubectl exec -it -n istioinaction $CATALOG_POD -c istio-proxy -- sudo tcpdump -i any tcp port 3000 -nn
tcpdump: data link type LINUX_SLL2
tcpdump: verbose output suppressed, use -v[v]... for full protocol decode
listening on any, link-type LINUX_SLL2 (Linux cooked v2), snapshot length 262144 bytes
06:47:07.174497 eth0  In  IP 10.10.0.8.48418 > 10.10.0.15.3000: Flags [P.], seq 3136654086:3136655748, ack 3576271868, win 588, options [nop,nop,TS val 1555094271 ecr 1754139499], length 1662
06:47:07.174514 eth0  Out IP 10.10.0.15.3000 > 10.10.0.8.48418: Flags [.], ack 1662, win 588, options [nop,nop,TS val 1754144032 ecr 1555094271], length 0
06:47:07.174861 lo    In  IP 127.0.0.6.36323 > 10.10.0.15.3000: Flags [P.], seq 2313565194:2313565863, ack 2068785180, win 500, options [nop,nop,TS val 1299680730 ecr 1752321165], length 669
06:47:07.174874 lo    In  IP 10.10.0.15.3000 > 127.0.0.6.36323: Flags [.], ack 669, win 497, options [nop,nop,TS val 1752324294 ecr 1299680730], length 0
06:47:07.677095 eth0  In  IP 10.10.0.8.48418 > 10.10.0.15.3000: Flags [P.], seq 1662:1686, ack 1, win 588, options [nop,nop,TS val 1555094774 ecr 1754144032], length 24
06:47:07.677259 eth0  In  IP 10.10.0.8.48418 > 10.10.0.15.3000: Flags [F.], seq 1686, ack 1, win 588, options [nop,nop,TS val 1555094774 ecr 1754144032], length 0
06:47:07.677319 eth0  Out IP 10.10.0.15.3000 > 10.10.0.8.48418: Flags [P.], seq 1:25, ack 1687, win 588, options [nop,nop,TS val 1754144535 ecr 1555094774], length 24
06:47:07.677412 eth0  In  IP 10.10.0.8.48418 > 10.10.0.15.3000: Flags [R], seq 3136655773, win 0, length 0
06:47:07.678268 lo    In  IP 127.0.0.6.36323 > 10.10.0.15.3000: Flags [F.], seq 669, ack 1, win 500, options [nop,nop,TS val 1299681234 ecr 1752324294], length 0
06:47:07.679004 lo    In  IP 10.10.0.15.3000 > 127.0.0.6.36323: Flags [F.], seq 1, ack 670, win 497, options [nop,nop,TS val 1752324799 ecr 1299681234], length 0
06:47:07.679033 lo    In  IP 127.0.0.6.36323 > 10.10.0.15.3000: Flags [.], ack 2, win 500, options [nop,nop,TS val 1299681235 ecr 1752324799], length 0
06:47:08.721480 eth0  In  IP 10.10.0.8.48432 > 10.10.0.15.3000: Flags [S], seq 3263943, win 64240, options [mss 1460,sackOK,TS val 1555095818 ecr 0,nop,wscale 7], length 0
06:47:08.721516 eth0  Out IP 10.10.0.15.3000 > 10.10.0.8.48432: Flags [S.], seq 4075367415, ack 3263944, win 65160, options [mss 1460,sackOK,TS val 1754145579 ecr 1555095818,nop,wscale 7], length 0
06:47:08.721540 eth0  In  IP 10.10.0.8.48432 > 10.10.0.15.3000: Flags [.], ack 1, win 502, options [nop,nop,TS val 1555095818 ecr 1754145579], length 0
06:47:08.721713 eth0  In  IP 10.10.0.8.48432 > 10.10.0.15.3000: Flags [P.], seq 1:2224, ack 1, win 502, options [nop,nop,TS val 1555095818 ecr 1754145579], length 2223
06:47:08.721725 eth0  Out IP 10.10.0.15.3000 > 10.10.0.8.48432: Flags [.], ack 2224, win 536, options [nop,nop,TS val 1754145579 ecr 1555095818], length 0
06:47:08.722077 eth0  Out IP 10.10.0.15.3000 > 10.10.0.8.48432: Flags [P.], seq 1:219, ack 2224, win 536, options [nop,nop,TS val 1754145580 ecr 1555095818], length 218
06:47:08.722100 eth0  In  IP 10.10.0.8.48432 > 10.10.0.15.3000: Flags [.], ack 219, win 501, options [nop,nop,TS val 1555095819 ecr 1754145580], length 0
06:47:08.722350 eth0  In  IP 10.10.0.8.48432 > 10.10.0.15.3000: Flags [P.], seq 2224:2288, ack 219, win 501, options [nop,nop,TS val 1555095819 ecr 1754145580], length 64
06:47:08.722484 eth0  In  IP 10.10.0.8.48432 > 10.10.0.15.3000: Flags [P.], seq 2288:3950, ack 219, win 501, options [nop,nop,TS val 1555095819 ecr 1754145580], length 1662
06:47:08.722491 eth0  Out IP 10.10.0.15.3000 > 10.10.0.8.48432: Flags [.], ack 3950, win 562, options [nop,nop,TS val 1754145580 ecr 1555095819], length 0
06:47:08.722774 lo    In  IP 127.0.0.6.51171 > 10.10.0.15.3000: Flags [S], seq 3604696845, win 65495, options [mss 65495,sackOK,TS val 1299682278 ecr 0,nop,wscale 7], length 0
06:47:08.722782 lo    In  IP 10.10.0.15.3000 > 127.0.0.6.51171: Flags [S.], seq 727562115, ack 3604696846, win 65483, options [mss 65495,sackOK,TS val 1752325842 ecr 1299682278,nop,wscale 7], length 0
06:47:08.722789 lo    In  IP 127.0.0.6.51171 > 10.10.0.15.3000: Flags [.], ack 1, win 512, options [nop,nop,TS val 1299682278 ecr 1752325842], length 0
06:47:08.722857 lo    In  IP 127.0.0.6.51171 > 10.10.0.15.3000: Flags [P.], seq 1:670, ack 1, win 512, options [nop,nop,TS val 1299682278 ecr 1752325842], length 669
06:47:08.722862 lo    In  IP 10.10.0.15.3000 > 127.0.0.6.51171: Flags [.], ack 670, win 507, options [nop,nop,TS val 1752325842 ecr 1299682278], length 0
06:47:09.048003 lo    In  IP 10.10.0.15.3000 > 127.0.0.6.51171: Flags [P.], seq 1:867, ack 670, win 507, options [nop,nop,TS val 1752326168 ecr 1299682278], length 866
06:47:09.048029 lo    In  IP 127.0.0.6.51171 > 10.10.0.15.3000: Flags [.], ack 867, win 506, options [nop,nop,TS val 1299682604 ecr 1752326168], length 0
06:47:09.048517 eth0  Out IP 10.10.0.15.3000 > 10.10.0.8.48432: Flags [P.], seq 219:5751, ack 3950, win 562, options [nop,nop,TS val 1754145906 ecr 1555095819], length 5532
06:47:09.048558 eth0  In  IP 10.10.0.8.48432 > 10.10.0.15.3000: Flags [.], ack 5751, win 588, options [nop,nop,TS val 1555096145 ecr 1754145906], length 0
^C
30 packets captured
42 packets received by filter
0 packets dropped by kernel

#
kubectl describe pod -n istioinaction $CATALOG_POD
Name:             catalog-v2-56c97f6db-n5rx8
Namespace:        istioinaction
Priority:         0
Service Account:  catalog
Node:             myk8s-control-plane/172.18.0.2
Start Time:       Sat, 17 May 2025 01:15:47 +0900
Labels:           app=catalog
                  pod-template-hash=56c97f6db
                  security.istio.io/tlsMode=istio
                  service.istio.io/canonical-name=catalog
                  service.istio.io/canonical-revision=v2
                  version=v2
Annotations:      kubectl.kubernetes.io/default-container: catalog
                  kubectl.kubernetes.io/default-logs-container: catalog
                  prometheus.io/path: /stats/prometheus
                  prometheus.io/port: 15020
                  prometheus.io/scrape: true
                  sidecar.istio.io/status:
                    {"initContainers":["istio-init"],"containers":["istio-proxy"],"volumes":["workload-socket","credential-socket","workload-certs","istio-env...
Status:           Running
IP:               10.10.0.15
IPs:
  IP:           10.10.0.15
Controlled By:  ReplicaSet/catalog-v2-56c97f6db
Init Containers:
  istio-init:
    Container ID:  containerd://cba8e564e61b2ea2f15471f2ff3aa5169282654ed4a9bed602506d2c3794e28d
    Image:         docker.io/istio/proxyv2:1.17.8
    Image ID:      docker.io/istio/proxyv2@sha256:d33fd90e25c59f4f7378d1b9dd0eebbb756e03520ab09cf303a43b51b5cb01b8
    Port:          <none>
    Host Port:     <none>
    Args:
      istio-iptables
      -p
      15001
      -z
      15006
      -u
      1337
      -m
      REDIRECT
      -i
      *
      -x

      -b
      *
      -d
      15090,15021,15020
      --log_output_level=default:info
    State:          Terminated
      Reason:       Completed
      Exit Code:    0
      Started:      Sat, 17 May 2025 01:15:48 +0900
      Finished:     Sat, 17 May 2025 01:15:48 +0900
    Ready:          True
    Restart Count:  0
    Limits:
      cpu:     2
      memory:  1Gi
    Requests:
      cpu:        10m
      memory:     40Mi
    Environment:  <none>
    Mounts:
      /var/run/secrets/kubernetes.io/serviceaccount from kube-api-access-h4wlx (ro)
Containers:
  catalog:
    Container ID:   containerd://1e75c94d42d8f07783eea80d3c9f2b214778cb1db99bde2e9ebf743603b856a5
    Image:          istioinaction/catalog
    Image ID:       docker.io/istioinaction/catalog@sha256:304226b8b076ec363f72c0cd13d60ae1a913680a9f2e61e33254d1de5b34f8fb
    Port:           3000/TCP
    Host Port:      0/TCP
    State:          Running
      Started:      Sat, 17 May 2025 01:15:49 +0900
    Ready:          True
    Restart Count:  0
    Environment:
      KUBERNETES_NAMESPACE:  istioinaction (v1:metadata.namespace)
    Mounts:
      /var/run/secrets/kubernetes.io/serviceaccount from kube-api-access-h4wlx (ro)
  istio-proxy:
    Container ID:  containerd://84562c4583e6d77842ccdfaa0ad8c7b48ea05d6fb67aaffb1d6cd3a133f5a363
    Image:         docker.io/istio/proxyv2:1.17.8
    Image ID:      docker.io/istio/proxyv2@sha256:d33fd90e25c59f4f7378d1b9dd0eebbb756e03520ab09cf303a43b51b5cb01b8
    Port:          15090/TCP
    Host Port:     0/TCP
    Args:
      proxy
      sidecar
      --domain
      $(POD_NAMESPACE).svc.cluster.local
      --proxyLogLevel=warning
      --proxyComponentLogLevel=misc:error
      --log_output_level=default:info
      --concurrency
      2
    State:          Running
      Started:      Sat, 17 May 2025 01:15:49 +0900
    Ready:          True
    Restart Count:  0
    Limits:
      cpu:     2
      memory:  1Gi
    Requests:
      cpu:      10m
      memory:   40Mi
    Readiness:  http-get http://:15021/healthz/ready delay=1s timeout=3s period=2s #success=1 #failure=30
    Environment:
      JWT_POLICY:                    third-party-jwt
      PILOT_CERT_PROVIDER:           istiod
      CA_ADDR:                       istiod.istio-system.svc:15012
      POD_NAME:                      catalog-v2-56c97f6db-n5rx8 (v1:metadata.name)
      POD_NAMESPACE:                 istioinaction (v1:metadata.namespace)
      INSTANCE_IP:                    (v1:status.podIP)
      SERVICE_ACCOUNT:                (v1:spec.serviceAccountName)
      HOST_IP:                        (v1:status.hostIP)
      PROXY_CONFIG:                  {}

      ISTIO_META_POD_PORTS:          [
                                         {"name":"http","containerPort":3000,"protocol":"TCP"}
                                     ]
      ISTIO_META_APP_CONTAINERS:     catalog
      ISTIO_META_CLUSTER_ID:         Kubernetes
      ISTIO_META_NODE_NAME:           (v1:spec.nodeName)
      ISTIO_META_INTERCEPTION_MODE:  REDIRECT
      ISTIO_META_WORKLOAD_NAME:      catalog-v2
      ISTIO_META_OWNER:              kubernetes://apis/apps/v1/namespaces/istioinaction/deployments/catalog-v2
      ISTIO_META_MESH_ID:            cluster.local
      TRUST_DOMAIN:                  cluster.local
    Mounts:
      /etc/istio/pod from istio-podinfo (rw)
      /etc/istio/proxy from istio-envoy (rw)
      /var/lib/istio/data from istio-data (rw)
      /var/run/secrets/credential-uds from credential-socket (rw)
      /var/run/secrets/istio from istiod-ca-cert (rw)
      /var/run/secrets/kubernetes.io/serviceaccount from kube-api-access-h4wlx (ro)
      /var/run/secrets/tokens from istio-token (rw)
      /var/run/secrets/workload-spiffe-credentials from workload-certs (rw)
      /var/run/secrets/workload-spiffe-uds from workload-socket (rw)
Conditions:
  Type              Status
  Initialized       True
  Ready             True
  ContainersReady   True
  PodScheduled      True
Volumes:
  workload-socket:
    Type:       EmptyDir (a temporary directory that shares a pod's lifetime)
    Medium:
    SizeLimit:  <unset>
  credential-socket:
    Type:       EmptyDir (a temporary directory that shares a pod's lifetime)
    Medium:
    SizeLimit:  <unset>
  workload-certs:
    Type:       EmptyDir (a temporary directory that shares a pod's lifetime)
    Medium:
    SizeLimit:  <unset>
  istio-envoy:
    Type:       EmptyDir (a temporary directory that shares a pod's lifetime)
    Medium:     Memory
    SizeLimit:  <unset>
  istio-data:
    Type:       EmptyDir (a temporary directory that shares a pod's lifetime)
    Medium:
    SizeLimit:  <unset>
  istio-podinfo:
    Type:  DownwardAPI (a volume populated by information about the pod)
    Items:
      metadata.labels -> labels
      metadata.annotations -> annotations
  istio-token:
    Type:                    Projected (a volume that contains injected data from multiple sources)
    TokenExpirationSeconds:  43200
  istiod-ca-cert:
    Type:      ConfigMap (a volume populated by a ConfigMap)
    Name:      istio-ca-root-cert
    Optional:  false
  kube-api-access-h4wlx:
    Type:                    Projected (a volume that contains injected data from multiple sources)
    TokenExpirationSeconds:  3607
    ConfigMapName:           kube-root-ca.crt
    Optional:                false
    DownwardAPI:             true
QoS Class:                   Burstable
Node-Selectors:              <none>
Tolerations:                 node.kubernetes.io/not-ready:NoExecute op=Exists for 300s
                             node.kubernetes.io/unreachable:NoExecute op=Exists for 300s
Events:

# istio-proxy 에 tcp port 3000 에서 패킷 덤프에 출력 결과를 파일로 저장
kubectl exec -it -n istioinaction $CATALOG_POD -c istio-proxy -- sudo tcpdump -i any tcp port 3000 -w /var/lib/istio/data/dump.pcap
kubectl exec -it -n istioinaction $CATALOG_POD -c istio-proxy -- ls -l /var/lib/istio/data/
total 20
-rw-r--r-- 1 tcpdump tcpdump 20291 May 17 06:49 dump.pcap

# 출력 결과 파일을 로컬로 다운로드
kubectl cp -n istioinaction -c istio-proxy $CATALOG_POD:var/lib/istio/data/dump.pcap ./dump.pcap

# 로컬로 다운 받은 파일을 wireshark 로 불러오기
wireshark dump.pcap
🛠️ 2. Wireshark 에서 TLS 암호 통신 확인 : istio-ingressgateway → [ (캡처 지점) istio-proxy ⇒ catalog application ]
- Client Hello (SNI 확인) : EDS 의 클러스터 이름으로 접속!
outbound_.80_.version-v2_.catalog.istioinaction.svc.cluster.local- *SNI에 값 형태를 추정?해보면, https 통신 시 EDS 기준 요청에 대한 통제를 SNI에서 값을 기준하기 위해서, 좀 더 상세한 출력으로 보임*
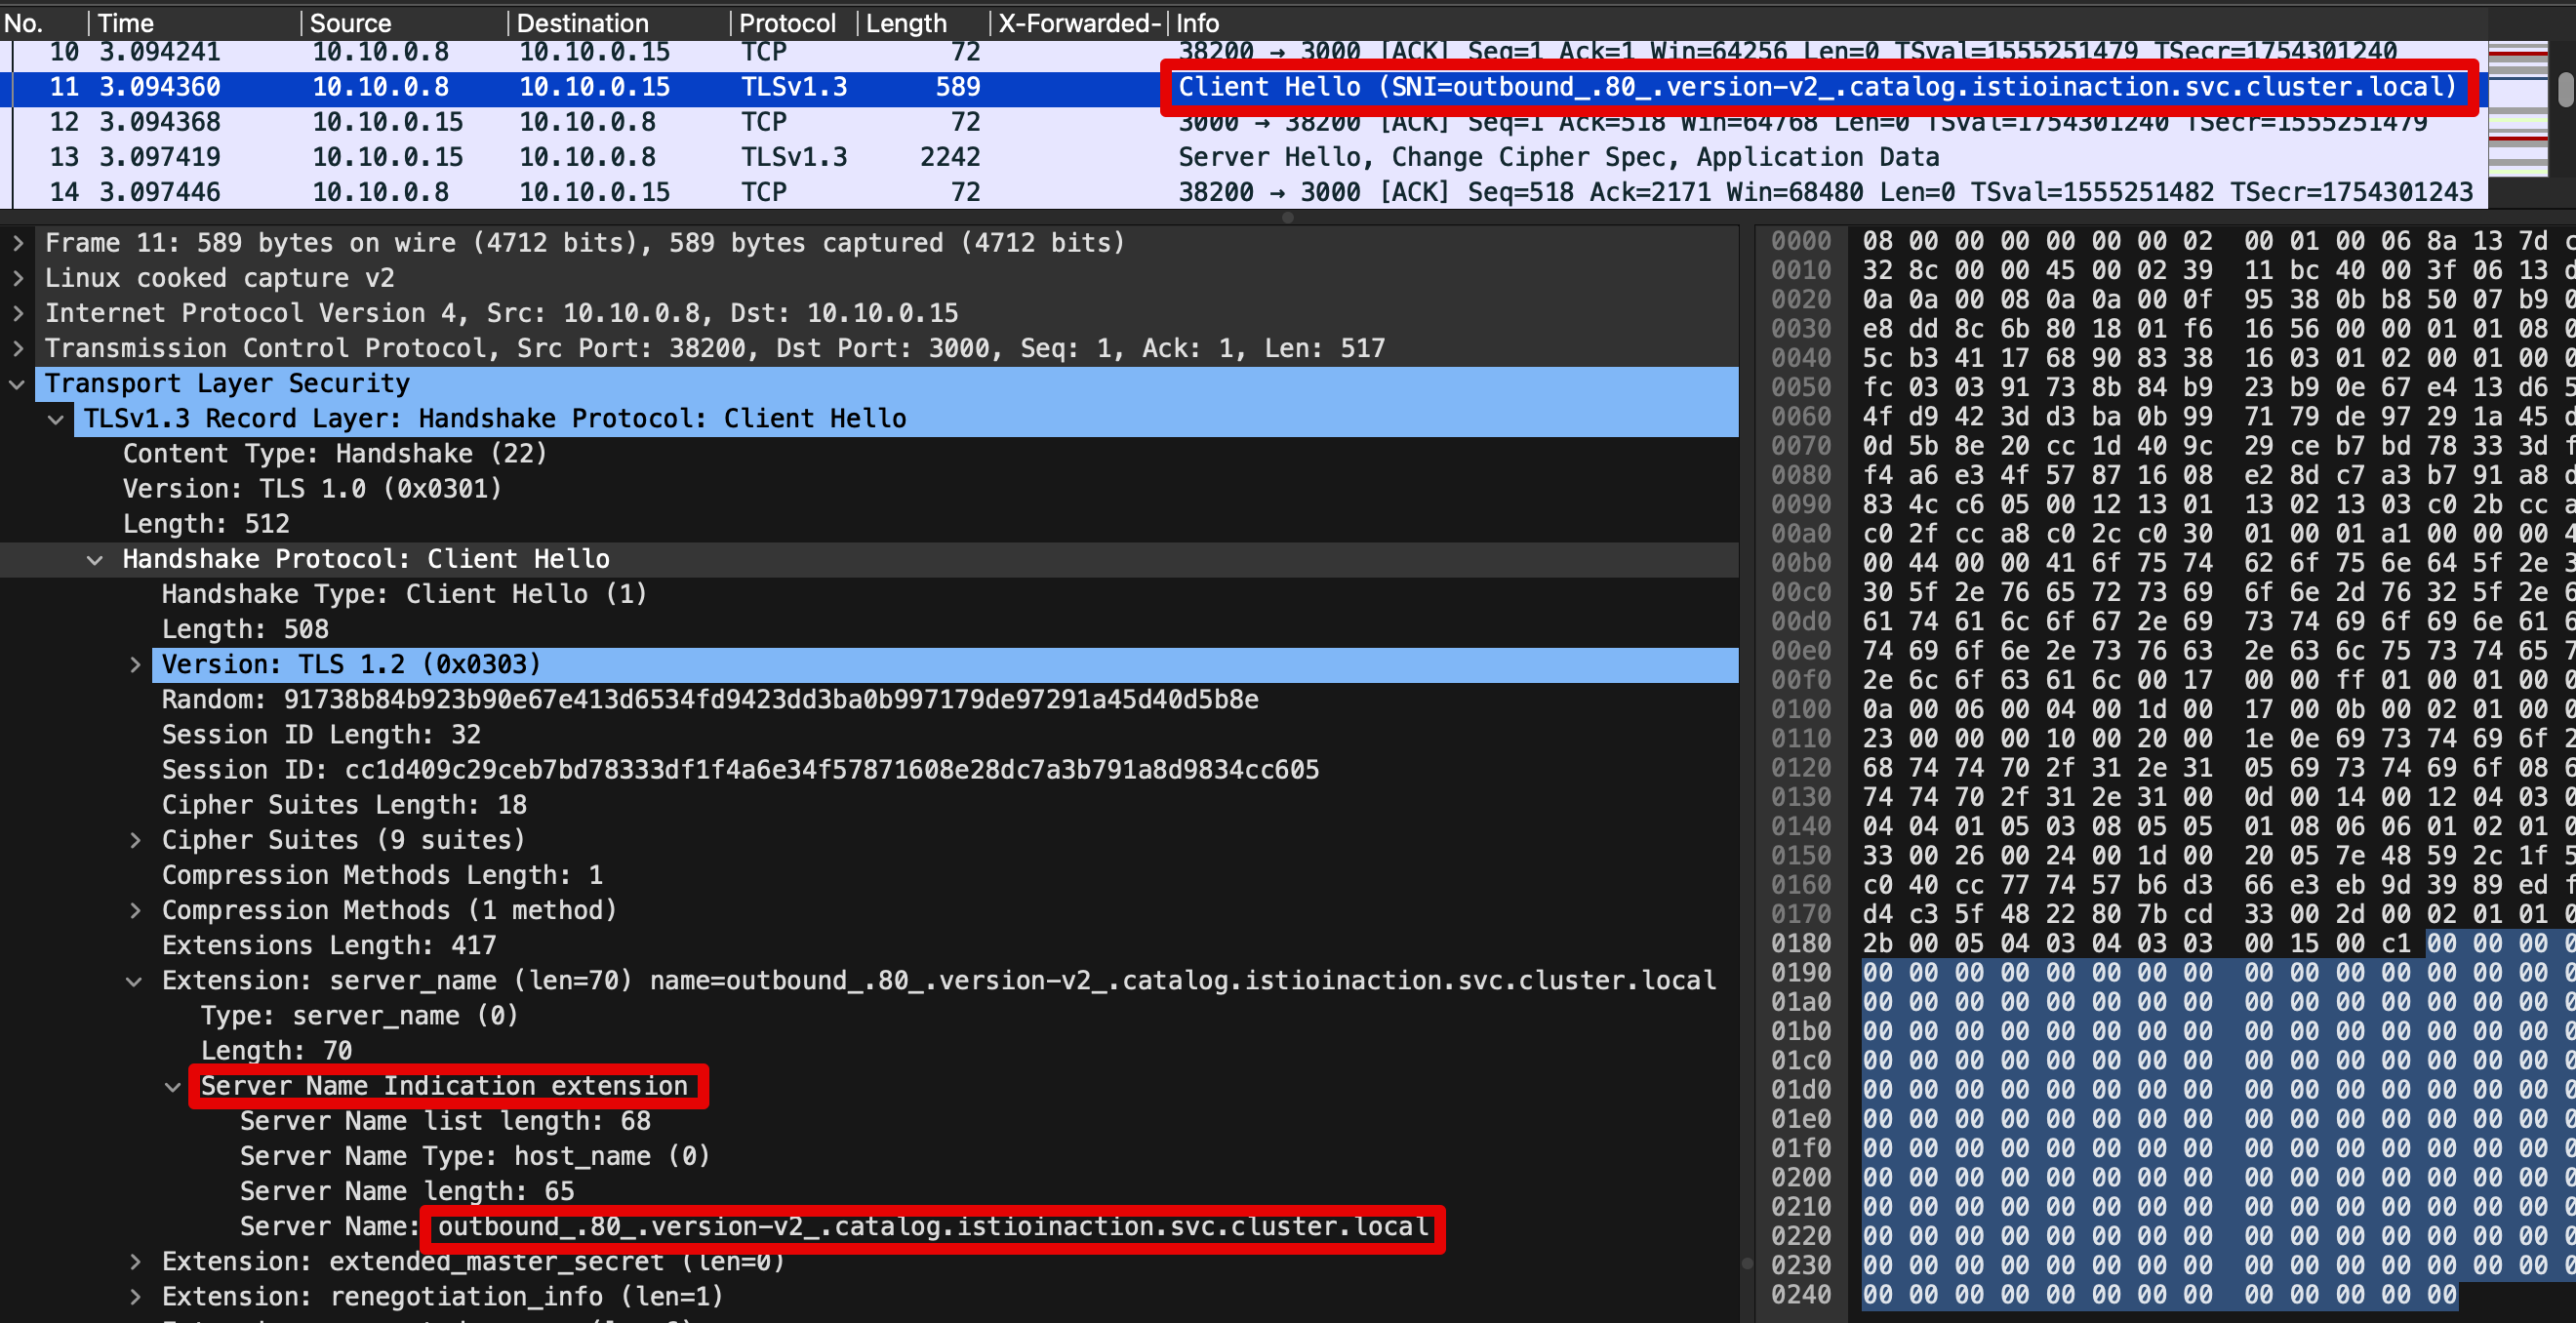
- *SNI에 값 형태를 추정?해보면, https 통신 시 EDS 기준 요청에 대한 통제를 SNI에서 값을 기준하기 위해서, 좀 더 상세한 출력으로 보임*
- 암호화된 내용 확인 : Encrypted Application Data 에 값 확인
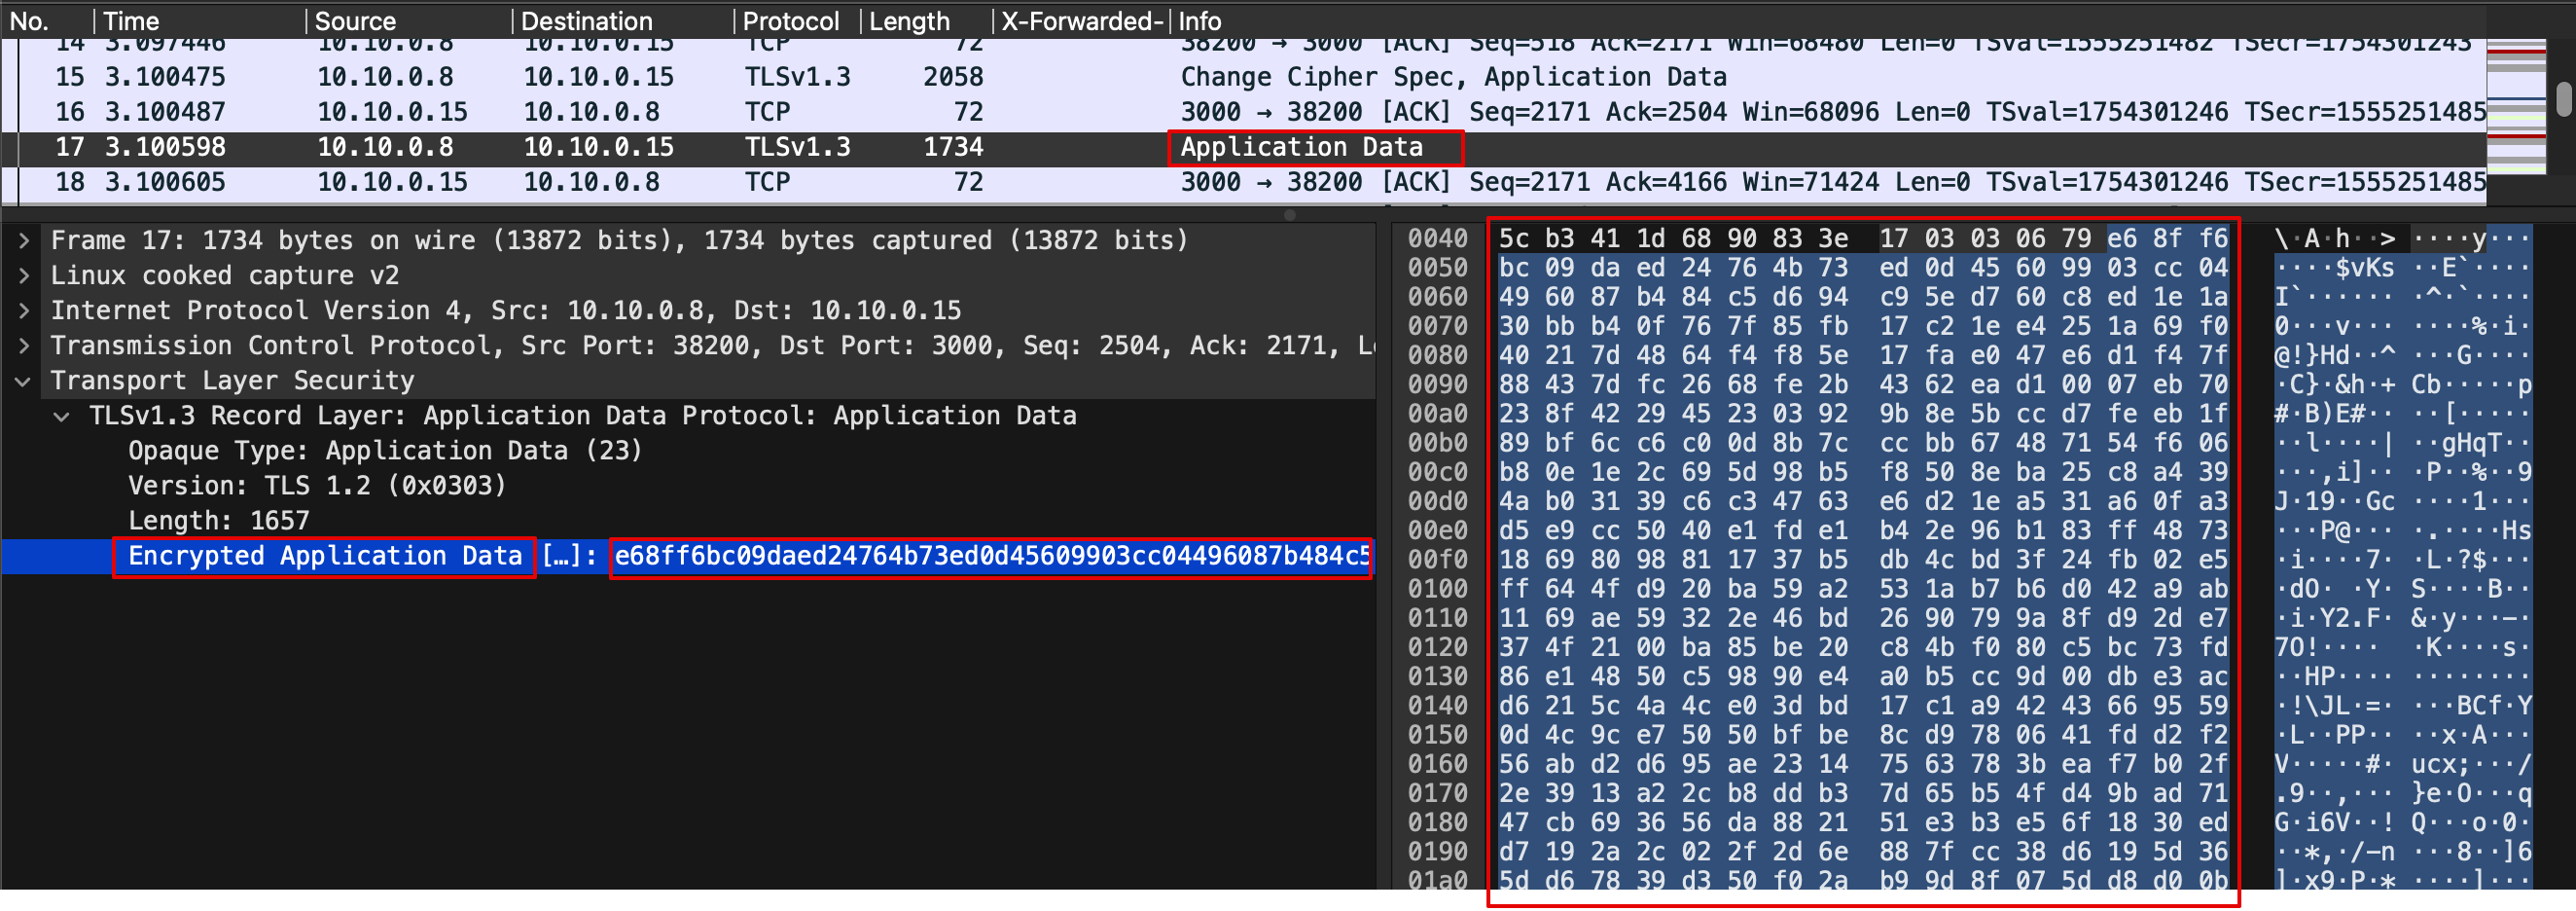
🛠️ 3. Wireshark 에서 평문 통신 확인 : istio-ingressgateway → [ istio-proxy (캡처 지점) ⇒ catalog application ]
-
istio-proxy 가 HTTPS를 복호화해서 평문으로 애플리케이션으로 요청 : x-envoy, x-b3 등 헤더 추가 확인
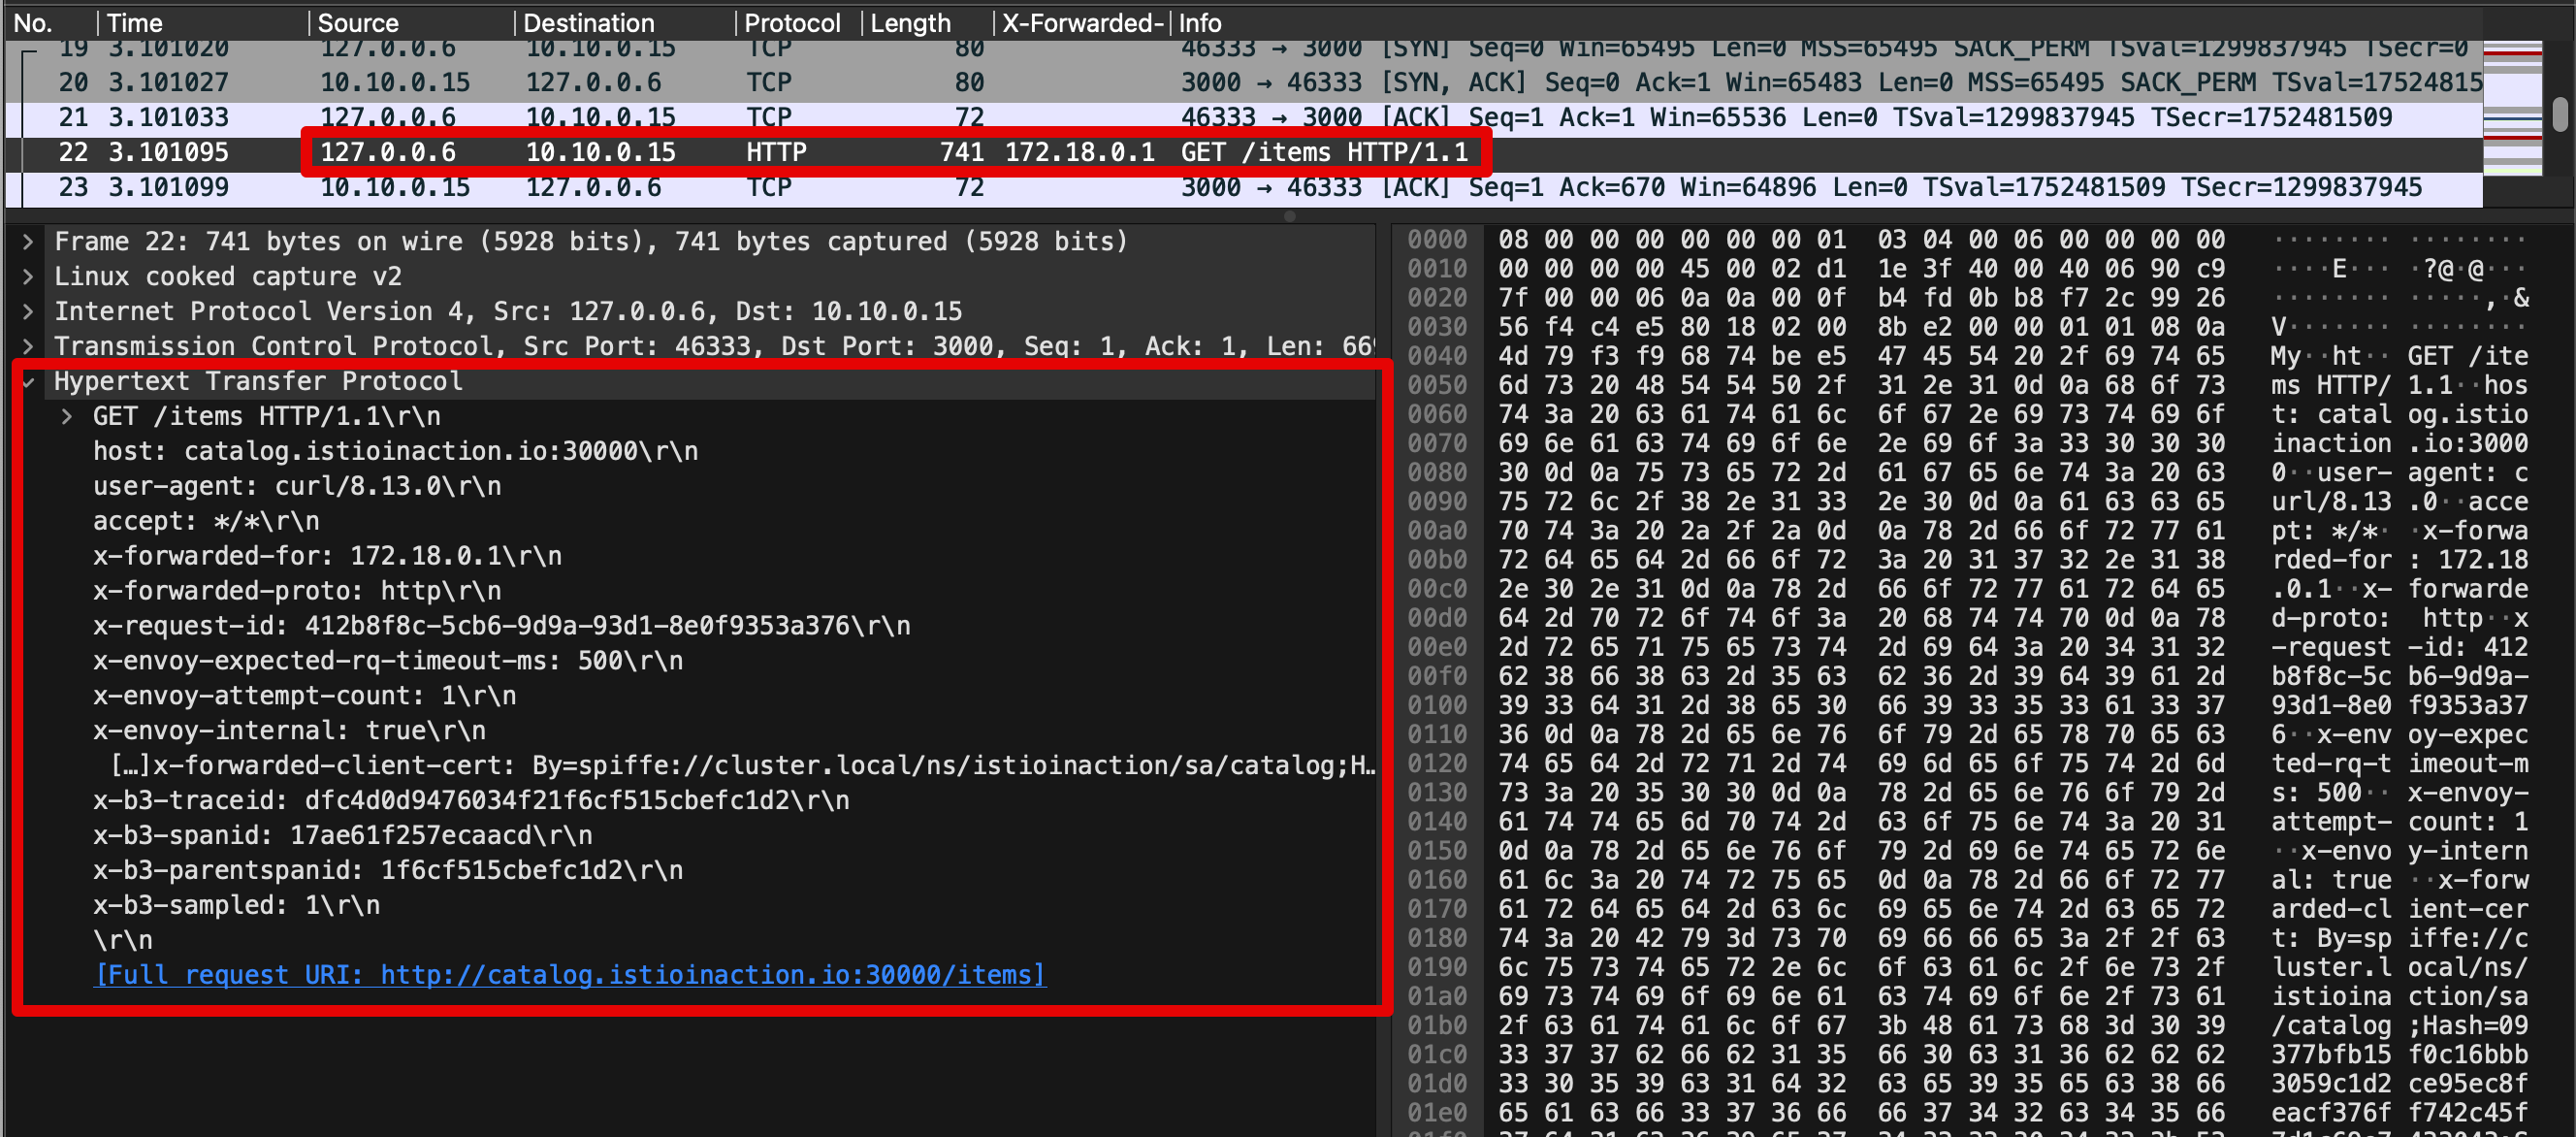
-
GET /items 패킷에서 우클릭 후 Follow → TCP Stream 클릭해서 해당 스트림(TCP) 필터링
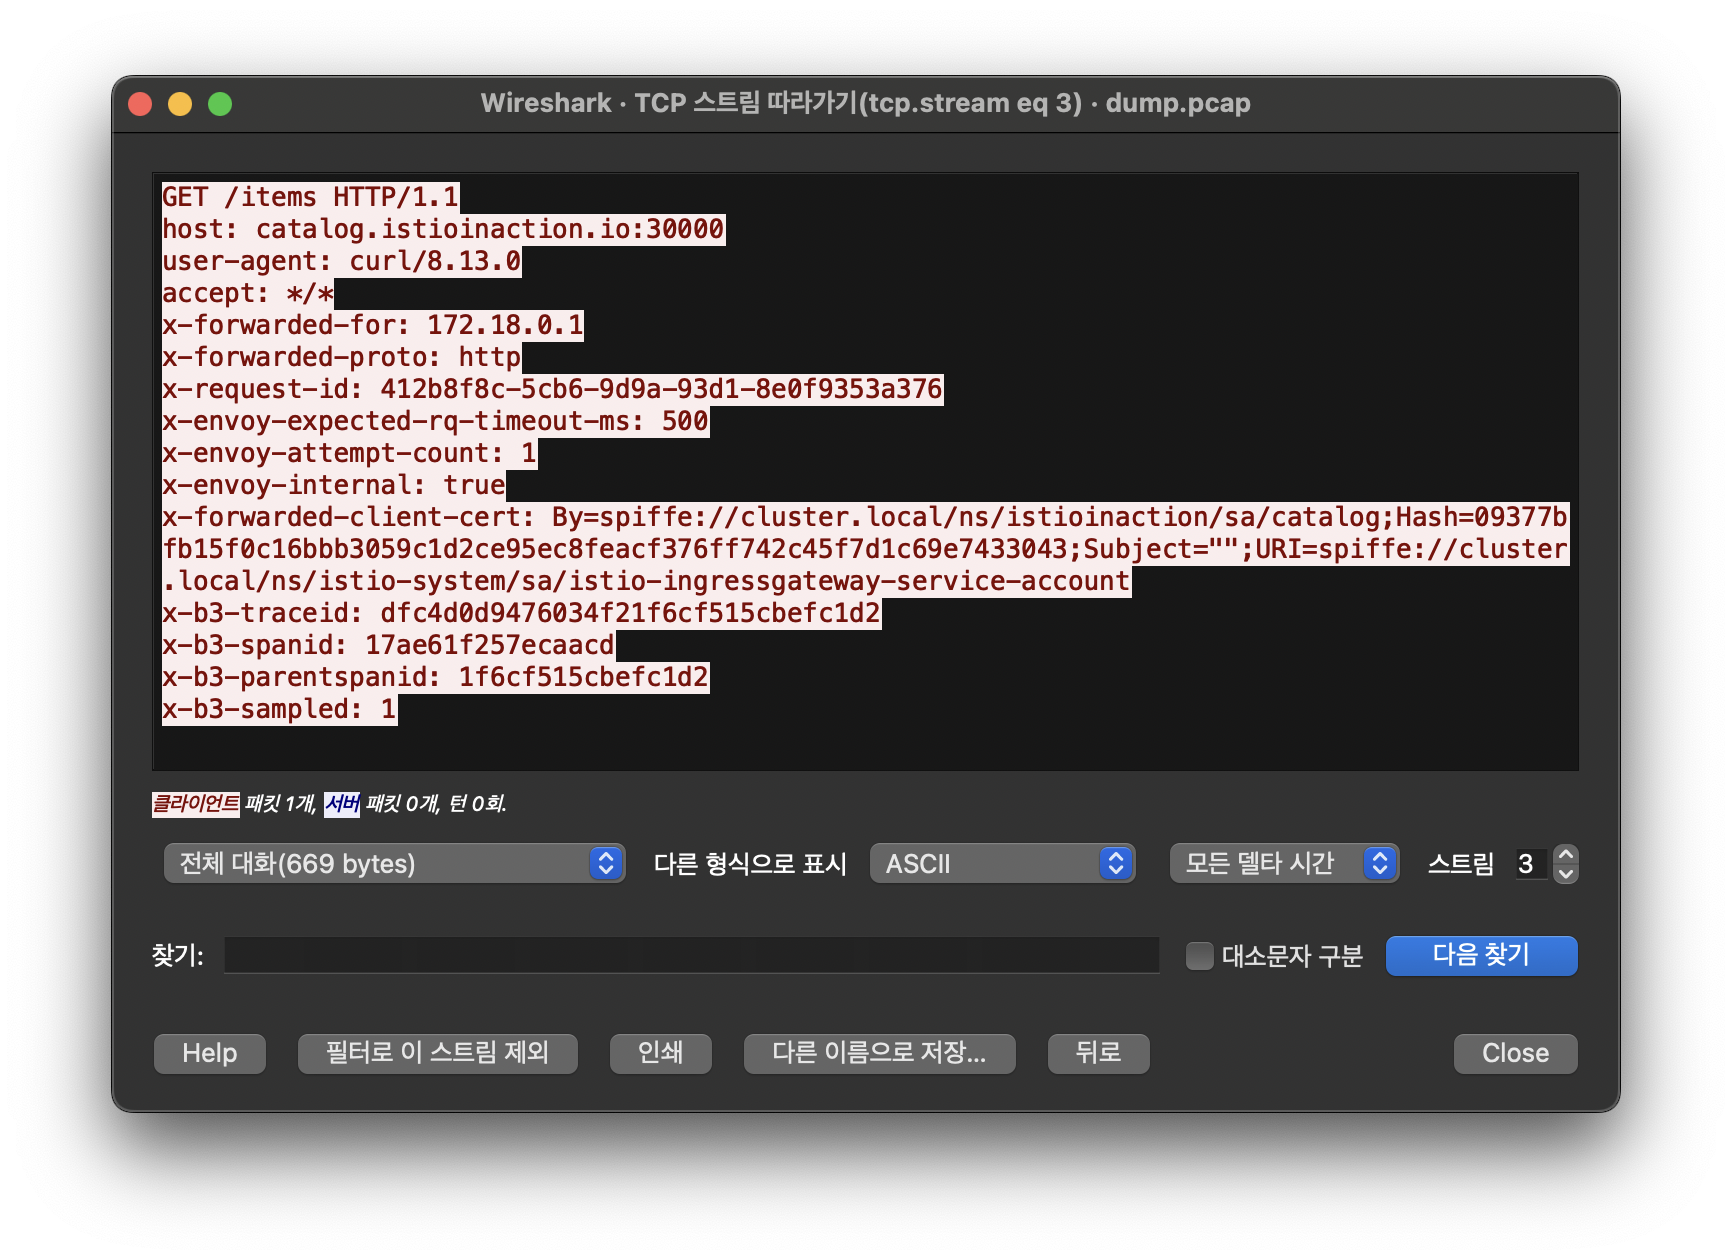
-
Statistics → Flow Graph 확인 : 정상적으로 GET 요청과 200 응답 확인
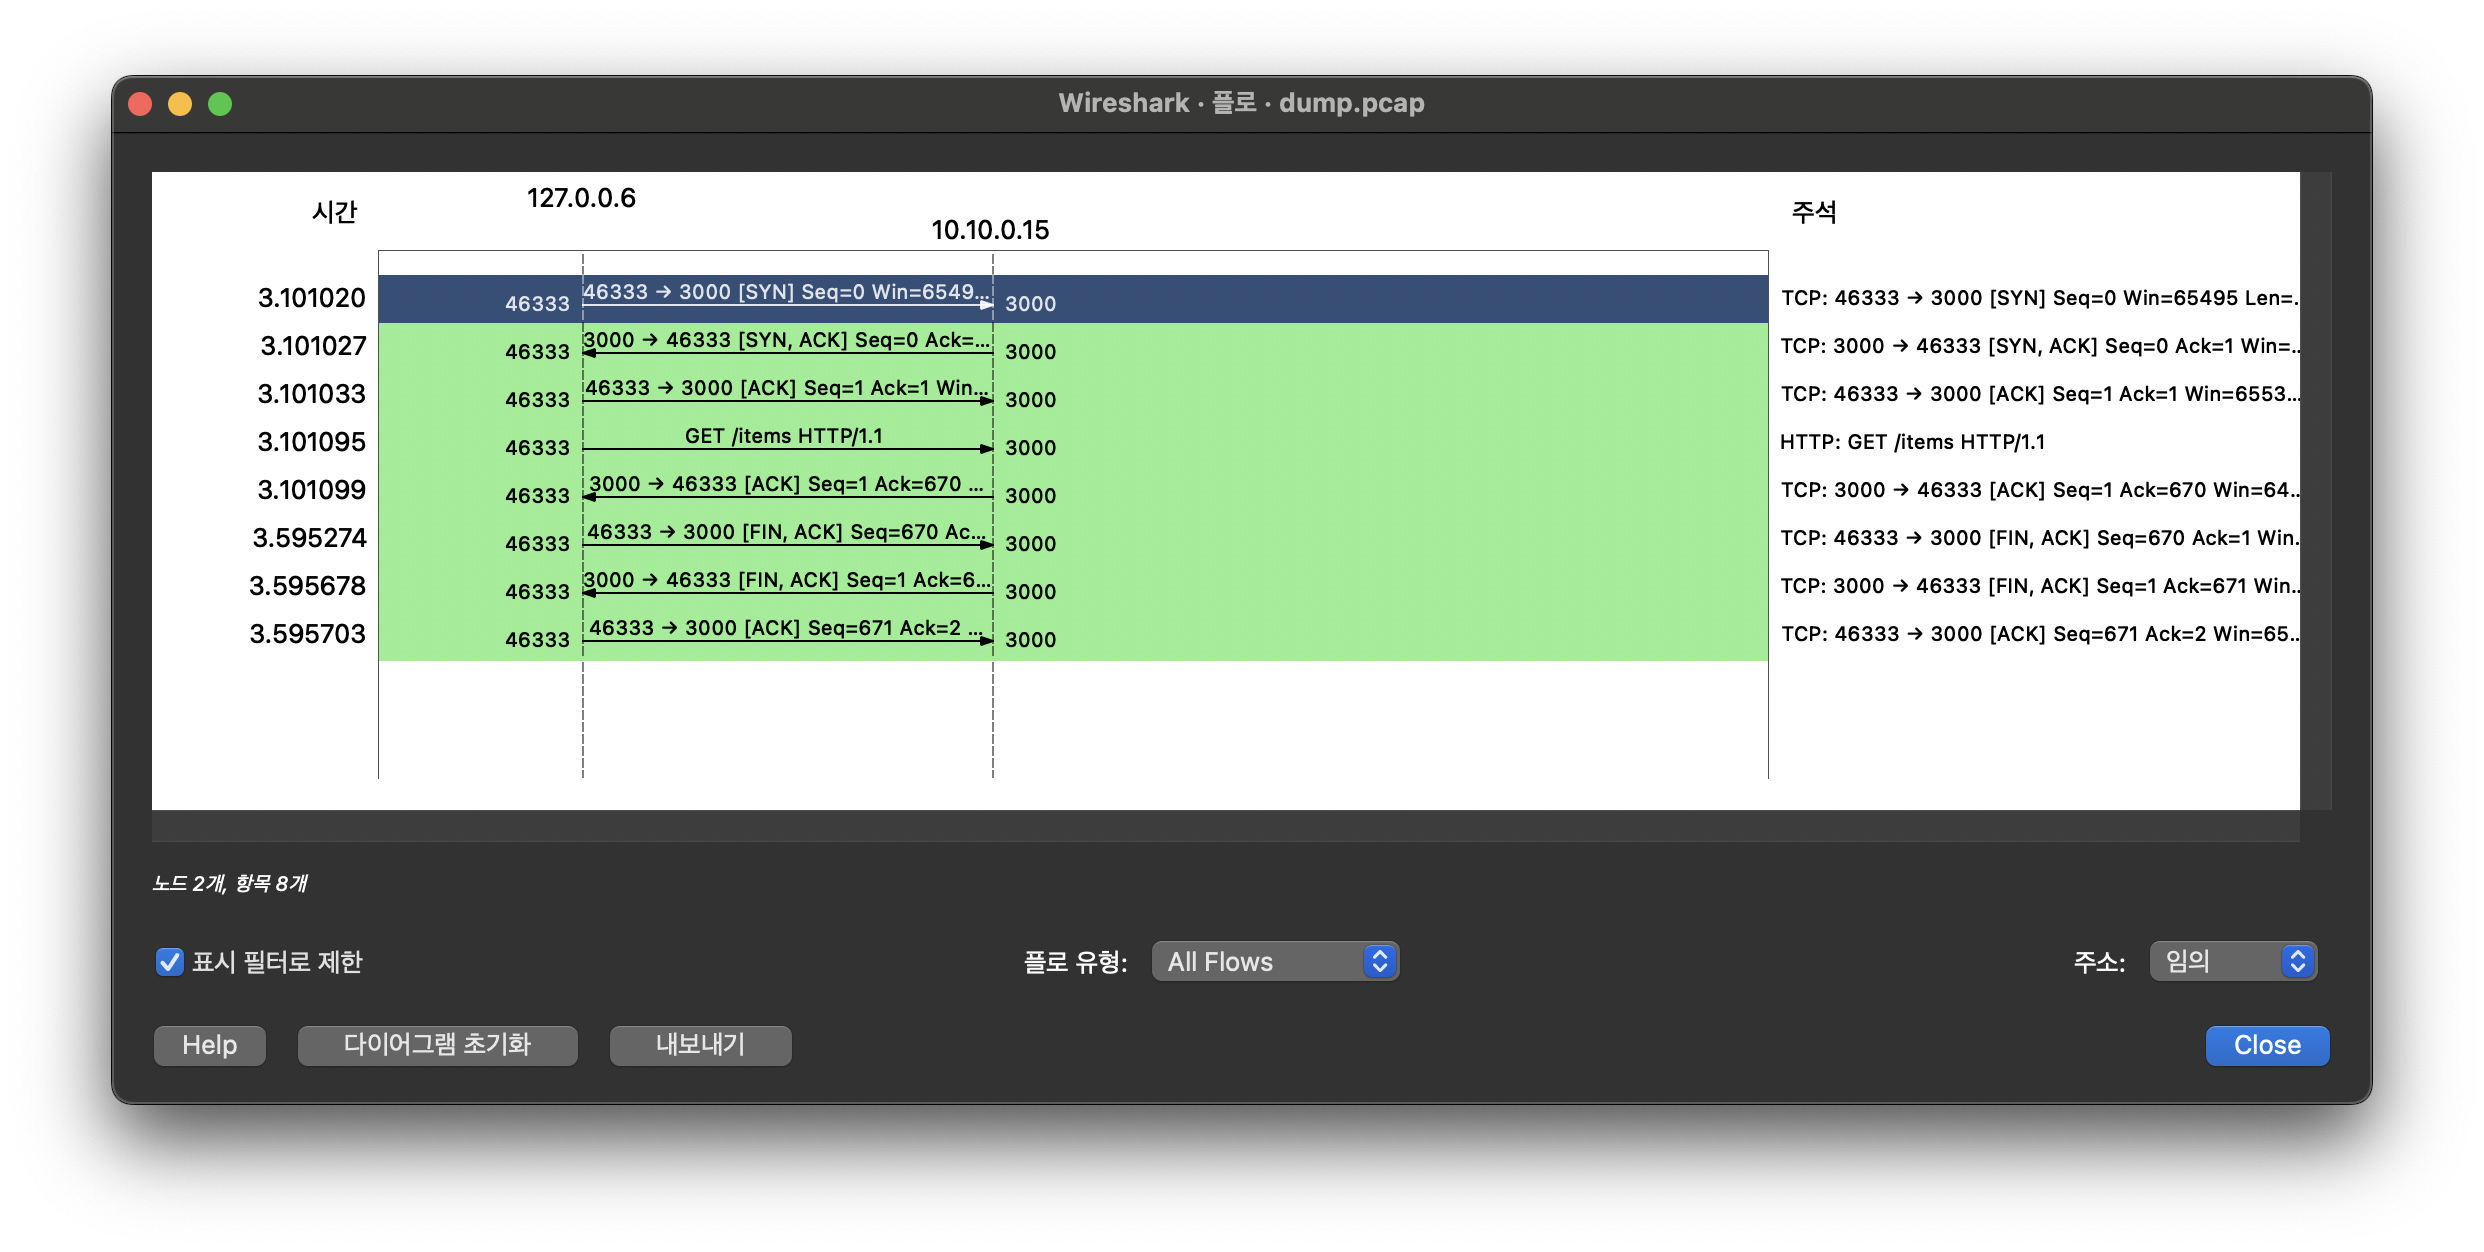
🛠️ 4. catalog v2 가 늦게 응답을 해서 istio-proxy 가 timeout 으로 먼저 종료 확인 -
필터 ((tcp.stream == 1 and http) or tcp.flags == 0x0011 or tcp.flags == 0x0004) : TCP RST, FIN/ACK 플래그 필터링 추가
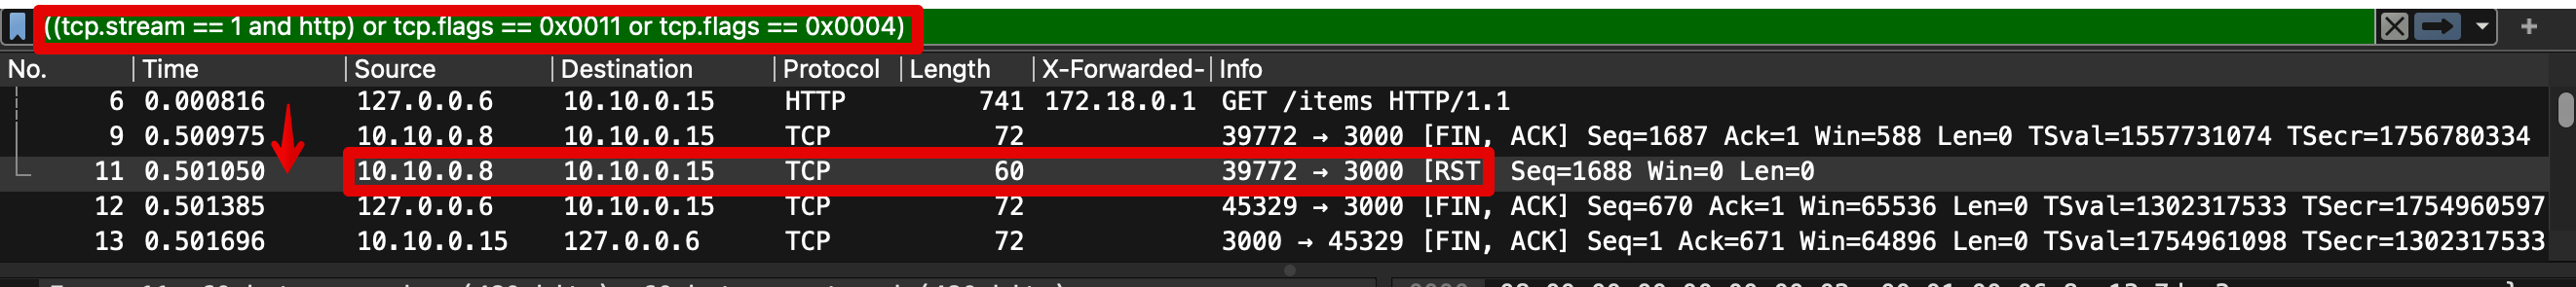
- No. 6번에서 요청 후 0.5초 이상 응답이 없으니 (9번)11번에 istio-ingressgateway istio-proxy 가 TCP RST 로 연결 종료
⇒ 즉, 현재 구성 상 istio-ingressgw → catalog 이므로, istio-ingressgw 가 TCP Timeout 후 종료 처리함 - 이후 12번은 catalog v2 istio-proxy 가 FIN/ACK를 applcation 에게 전달 이후 연결 종료
💁🏻♀️ TCP control flags
TCP 제어 플래그는 커넥션의 특정 상태를 나타낸다. 여기서 볼 수 있는 플래그는 다음과 같다. - Synchronization (SYN)은 커넥션을 새로 수립하는 데 사용한다.
- Acknowledgment (ACK)는 패킷 수신이 성공했음을 확인하는 데 사용한다.
- Finish (FIN)는 커넥션 종료를 요청하는 데 사용한다.
- No. 6번에서 요청 후 0.5초 이상 응답이 없으니 (9번)11번에 istio-ingressgateway istio-proxy 가 TCP RST 로 연결 종료
-
Kiali 확인
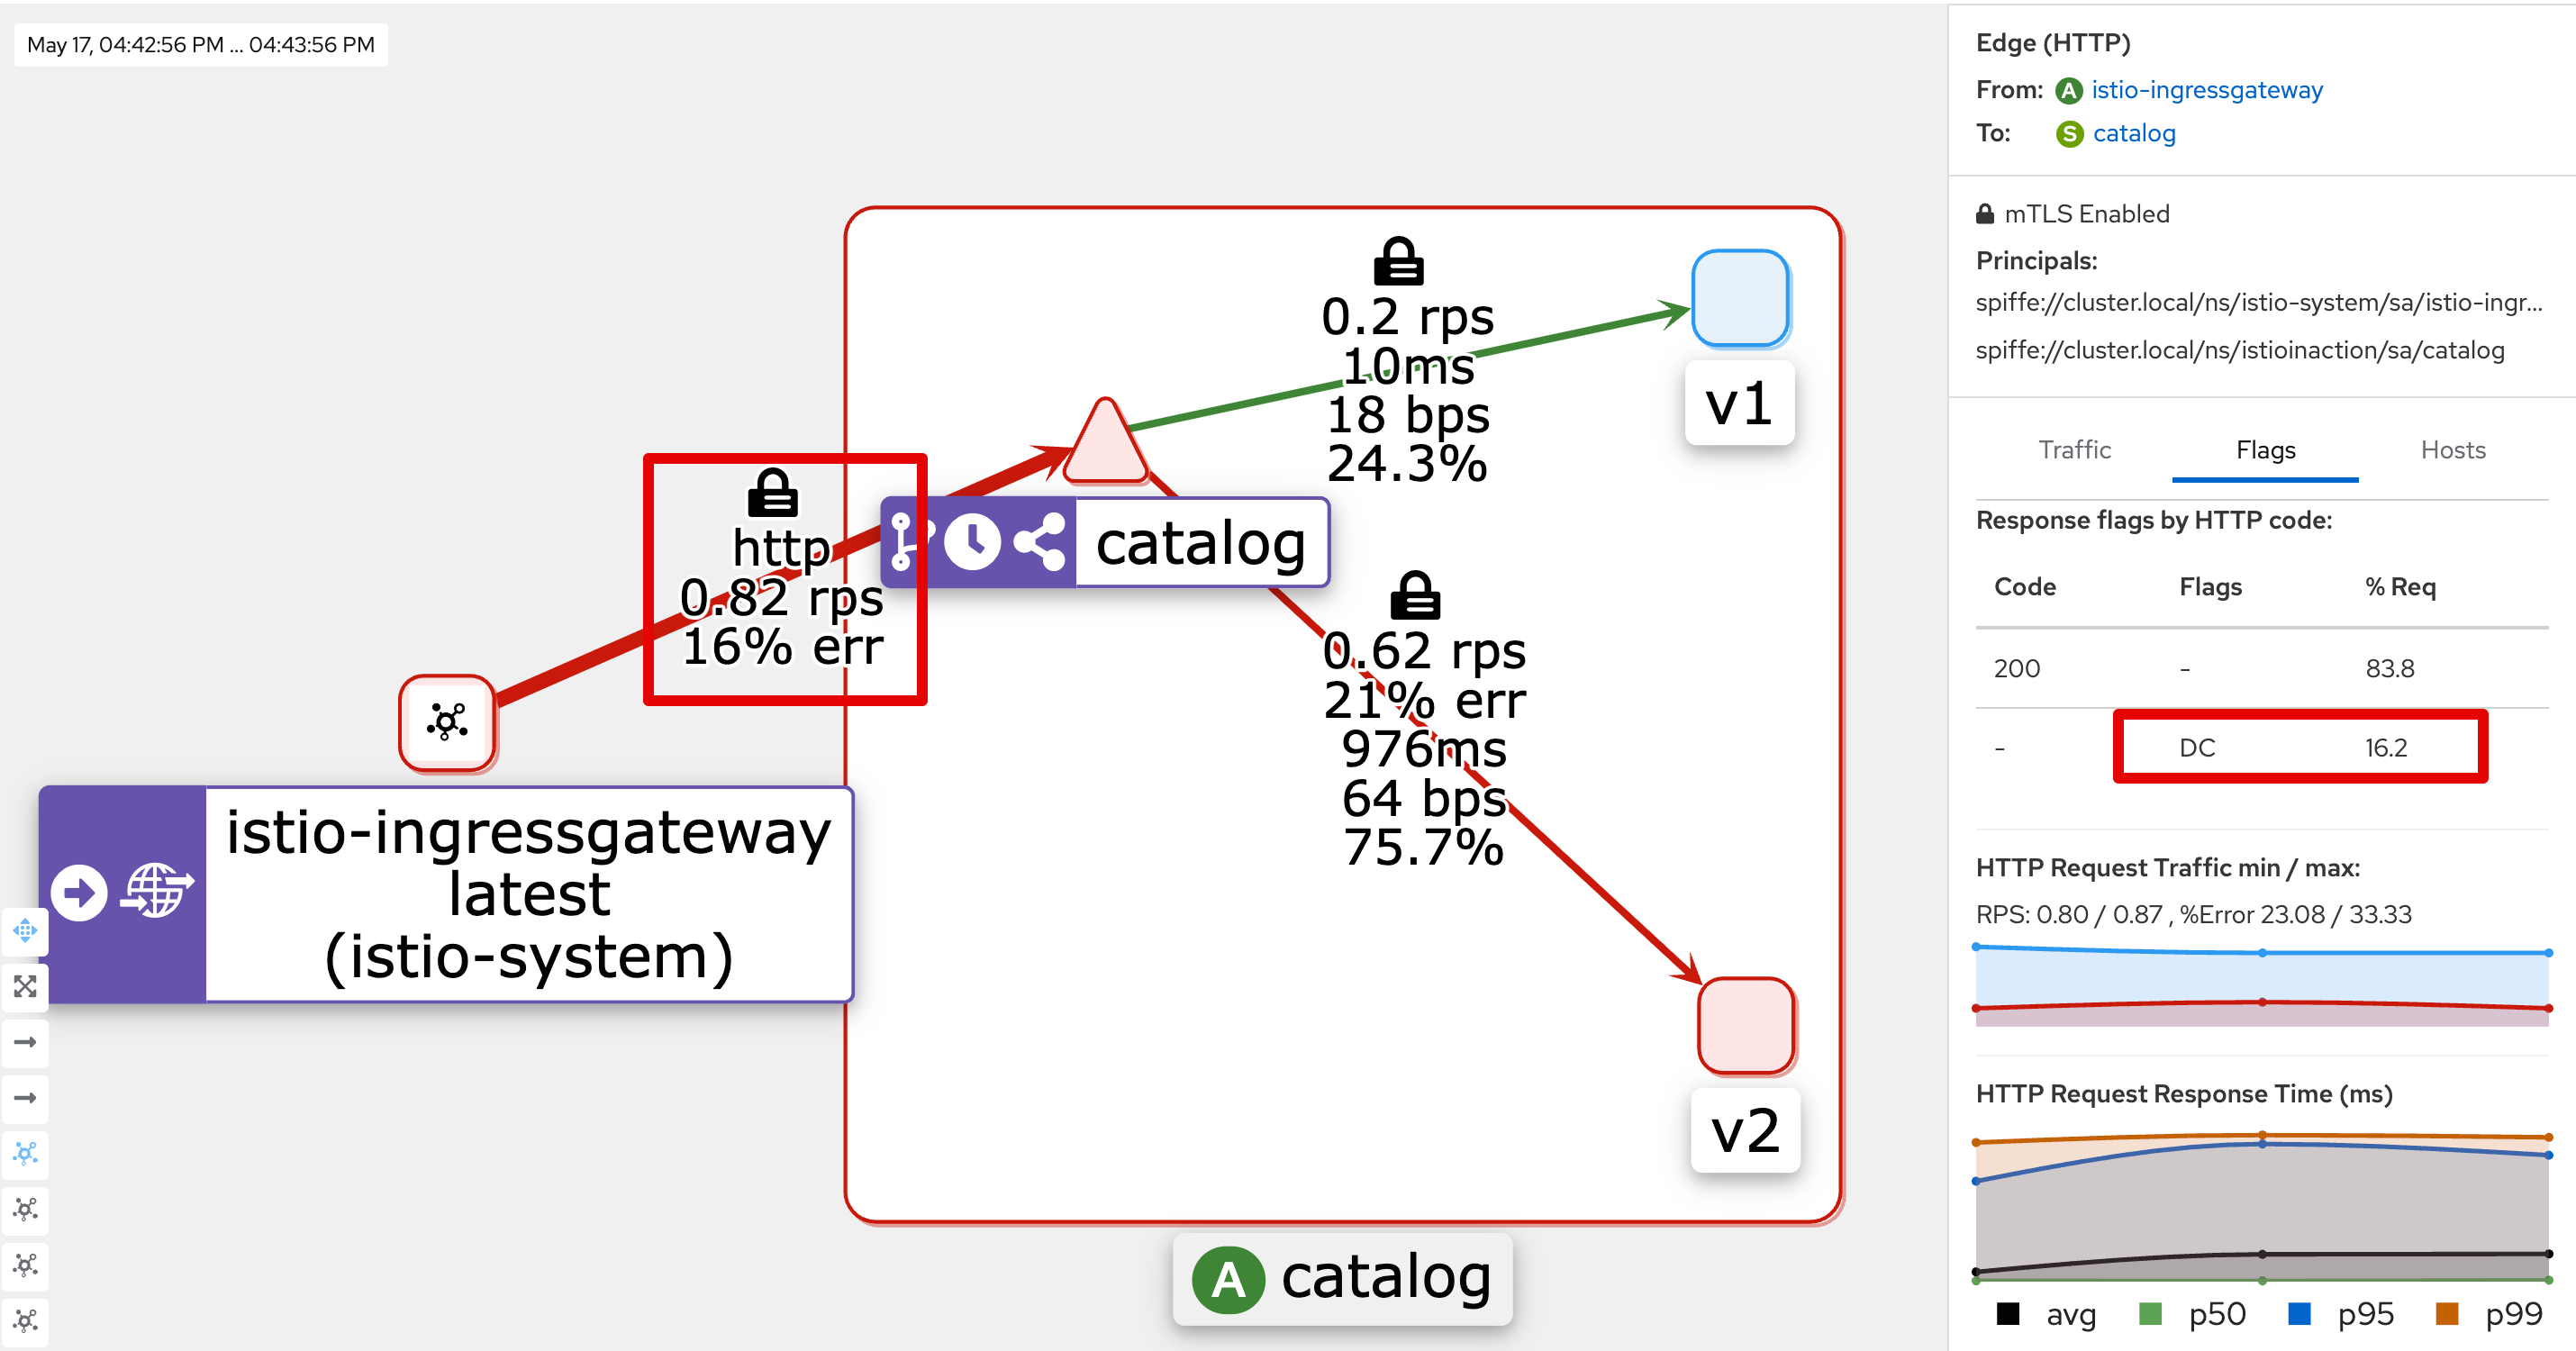
-
Jaeger ui
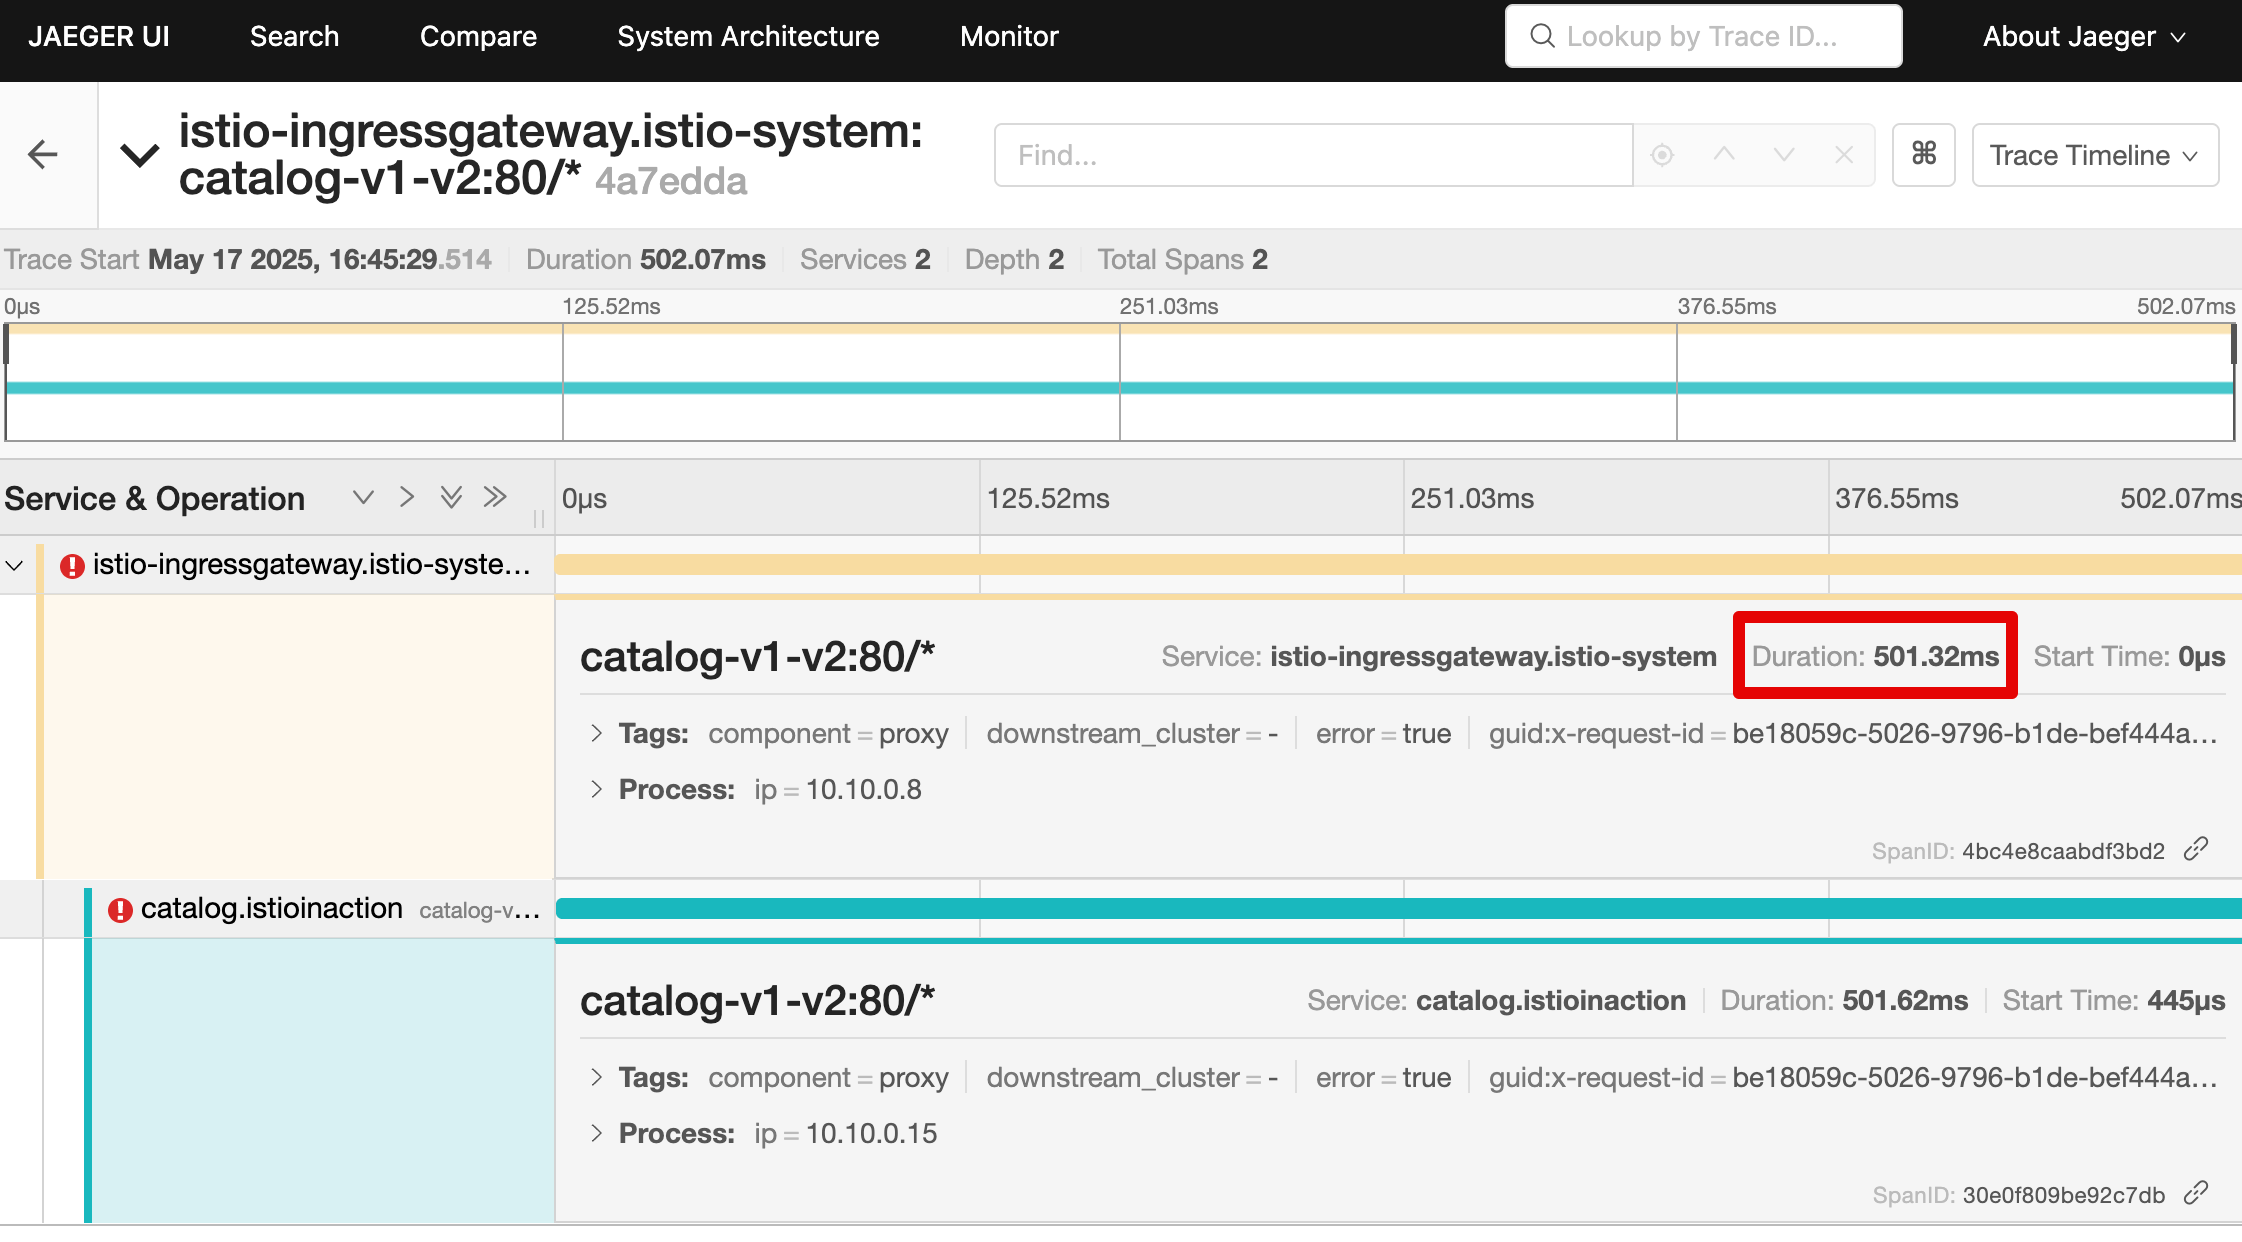
-
네트워크 트래픽을 검사하면 앞 서 관찰한 두 가지를 모두 확인할 수 있다.
-
클라이언트가 커넥션 종료를 시작했고, 서버는 요청 응답이 느렸다.
-
다음 절에서는 이 문제가 드문 문제인지, 즉시 주의를 기울여야 하는 빈번한 문제인지 파악하기 위해 서버 성공률을 조사한다.
2.4 엔보이 텔레메트리로 자신의 애플리케이션 이해하기
2.4.1 그라파나에서 실패한 요청 비율 찾기
- Grafana - Istio Service 대시보드 ⇒ Service(catalog.istioinaction..) , Reporter(source) 선택
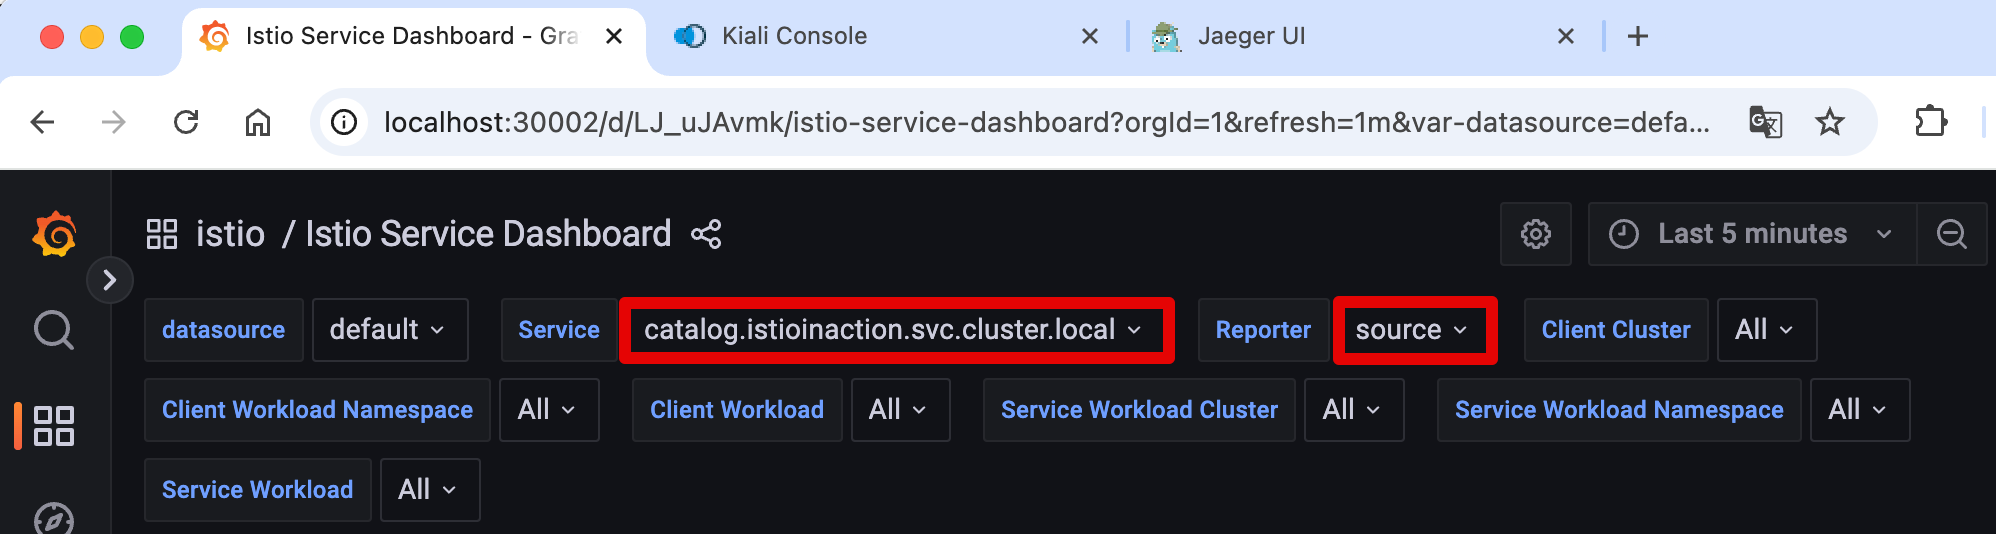
- 클라이언트 성공률은 요청 중 70% 정도(아래 스샷은 79%)로 30% 정도 실패. ⇒ Client 응답에 5xx가 30% 정도 있음
상태 코드 504 (’Gateway timeout’)로 표기되어 클라이언트 측 실패율에 반영.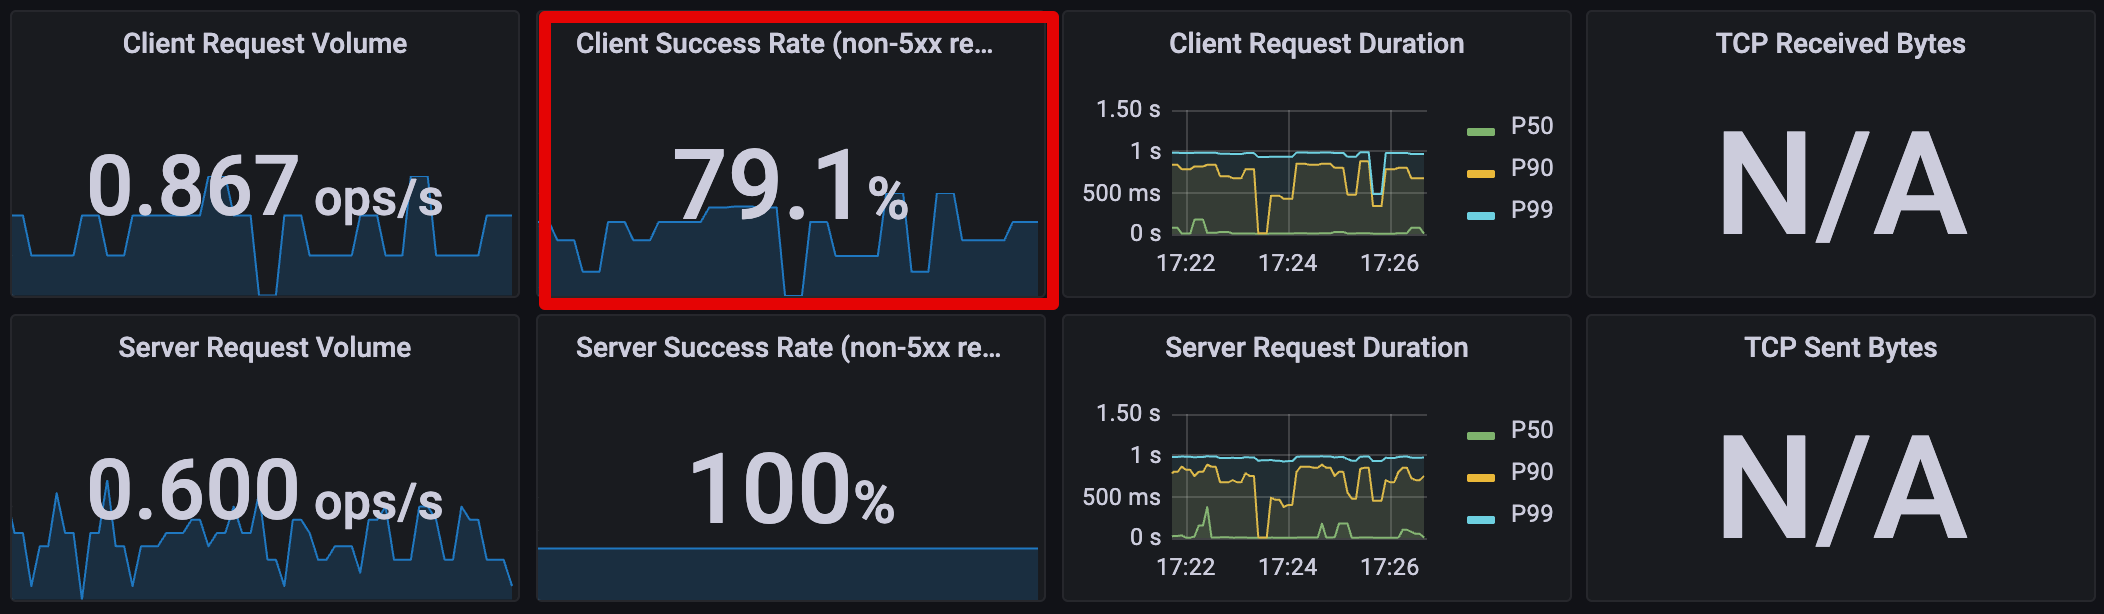
- 서버 성공률은 100%, 즉 서버 문제는 아님 ⇒ Server 응답에는 5xx 없음.
엔보이 프록시가 다운스트림 종료 요청에 대한 응답 코드를 0으로 표시하며, 이는 5xx 응답이 아니라서 실패율에 포함되지 않는다.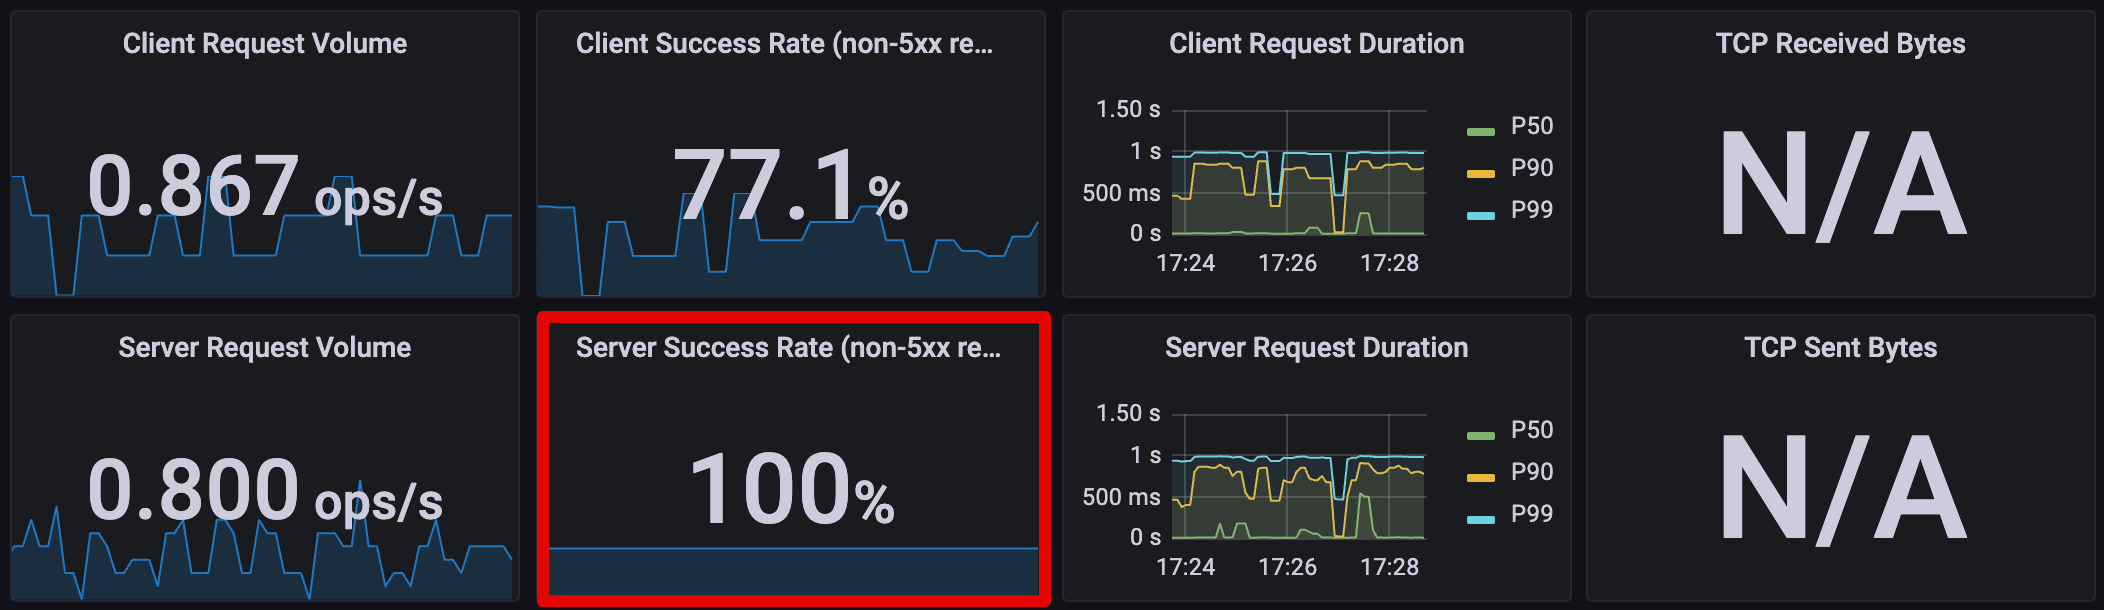
- [인그레스 게이트웨이 : 응답 플래그 UT, 상태 코드 504] ⇒ (요청 타임아웃) ⇒ [catalog v2 : 응답 플래그 DC, 상태 코드 0]
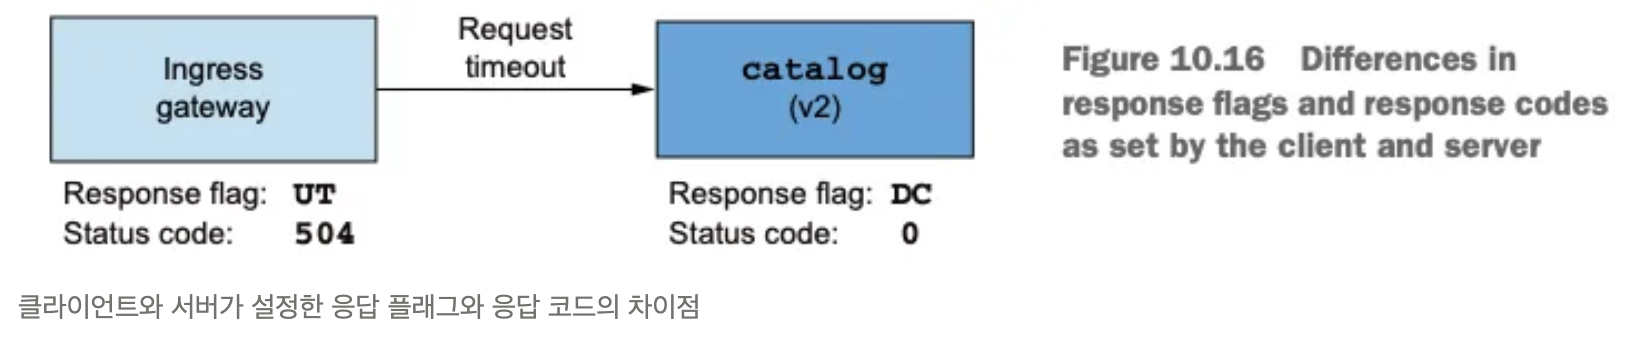
- 정리하면, 올바른 값은 클라이언트가 보고하는 성공률이라는 것을 알 수 있다.
- 실패율이 20~30%이면 즉시 주의를 기울여야 한다!
- 그러나 현재 그라파나 대시보드는 catalog 서비스에 속한 모든 워크로드(v1,v2)의 성공률을 보여준다.
- 문제가 있는 단일 인스턴스를 식별하려면 좀 더 상세한 출력이 필요하다.
2.4.2 프로메테우스를 사용해 영향받는 파드 쿼리하기
- 그라파나 대시보드의 정보가 부족하면 프로메테우스에 직접 쿼리할 수 있다.
- 예를 들어 파드 별 실패율을 쿼리해보자. 다음 기준을 충족하는 메트릭을 쿼리해보자.
- destination 이 보고한 요청
- destination 서비스가 catalog 인 요청
- 응답 플래그가 DC(다운스트림 커넥션 종료)인 요청 ⇒ 서버 입장에서는 응답을 하려는데, 클라이언트가 먼저 끊어 버린 것!
sort_desc( # 가장 높은 값부터 내림차순 정렬
  sum( # irate 값들을 집계
    irate( #  요청 수 초당 증가율
      istio_requests_total {
        reporter="destination",   # 서버(destination) 측에서 보고한 메트릭만 필터링
        destination_service=~"catalog.istioinaction.svc.cluster.local",   # catalog 가 서버(destination)측인 메트릭만 필터링
        response_flags="DC"       # DC (다운스트림 커넥션 종료)로 끝난 메트릭만 필터링
      }[5m]
    )
  )by(response_code, pod, version) # 응답 코드(response_code), 대상 pod, 버전(version) 별로 분리 => sum.. 합산
)
# 쿼리1
istio_requests_total
istio_requests_total{reporter="destination", destination_service=~"catalog.istioinaction.svc.cluster.local"}
istio_requests_total{reporter="destination", destination_service=~"catalog.istioinaction.svc.cluster.local",response_flags="DC"}
# 쿼리2
istio_requests_total{reporter="destination", destination_service=~"catalog.istioinaction.svc.cluster.local",response_flags="DC"}[5m]
irate(istio_requests_total{reporter="destination", destination_service=~"catalog.istioinaction.svc.cluster.local",response_flags="DC"}[5m])
sum(irate(istio_requests_total{reporter="destination", destination_service=~"catalog.istioinaction.svc.cluster.local",response_flags="DC"}[5m]))
# 쿼리3
sum(irate(istio_requests_total{reporter="destination", destination_service=~"catalog.istioinaction.svc.cluster.local",response_flags="DC"}[5m])) by(response_code, pod, version)
sort_desc(sum(irate(istio_requests_total{reporter="destination", destination_service=~"catalog.istioinaction.svc.cluster.local",response_flags="DC"}[5m]))by(response_code, pod, version))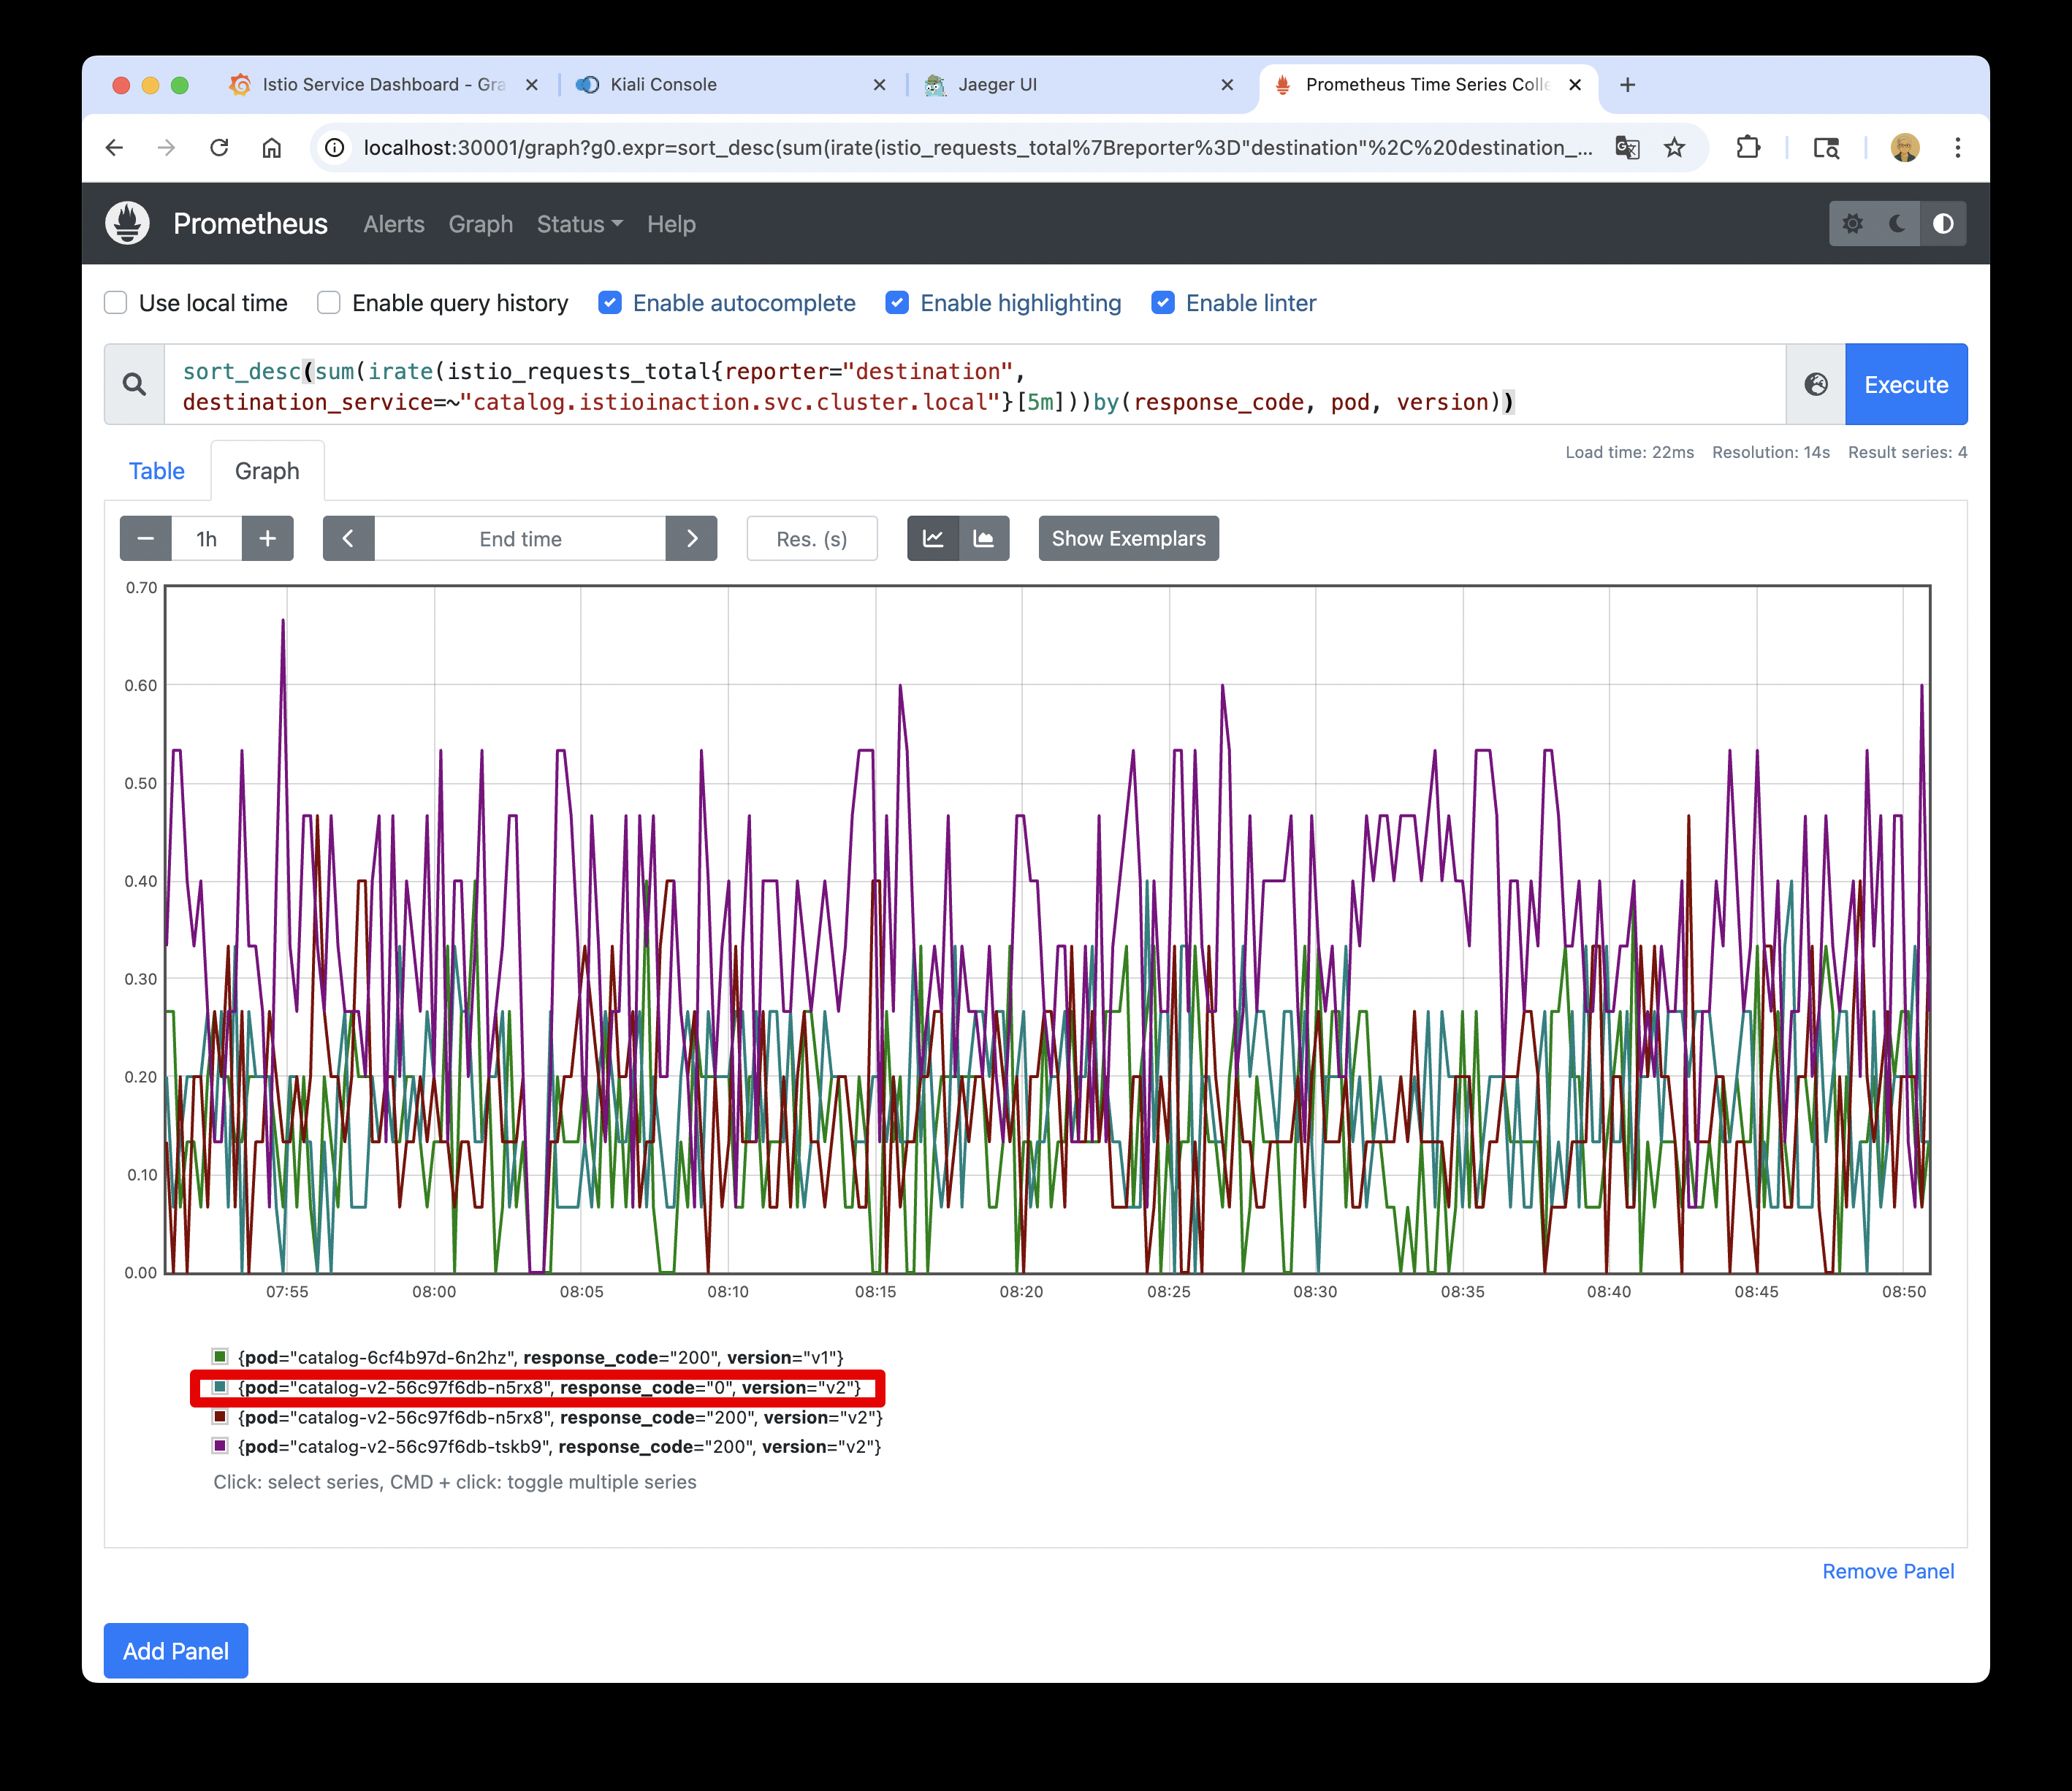
⇒ 해당 그래프는 오직 워크로드 하나만 실패를 보고 하고 있음을 보여준다.
- 퀴리를 조금 수정해서 확인 : 여러 개 파드 중 catalog v2 만 응답 코드 0 기록 확인
sort_desc(sum(irate(istio_requests_total{reporter="destination", destination_service=~"catalog.istioinaction.svc.cluster.local"}[5m]))by(response_code, pod, version))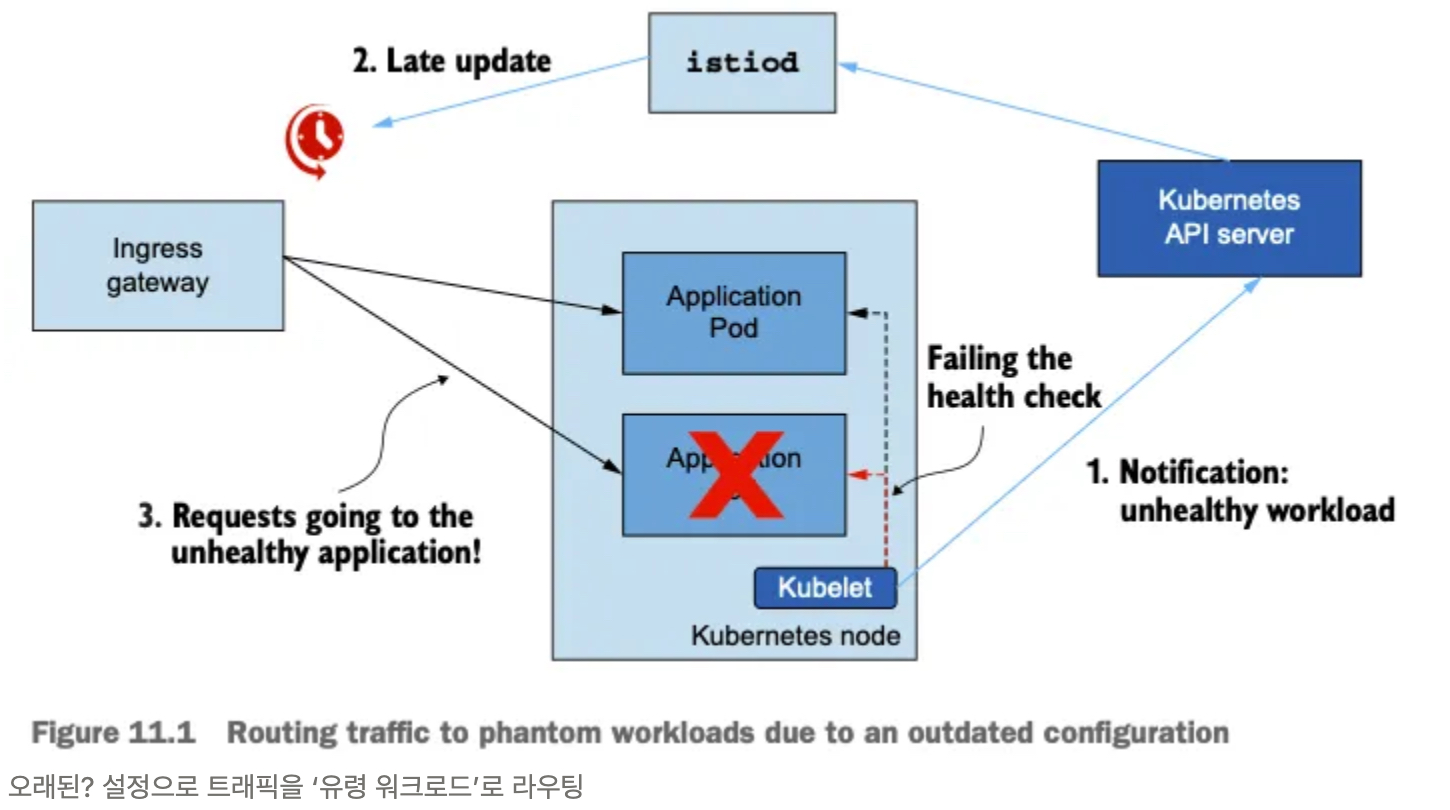
- 이스티오 표준 메트릭에 필요한 정보가 없는 경우 커스텀 메트릭을 추가할 수 있다.
- 또한 프로메테우스 클라이언트 라이브러리를 사용해 애플리케이션에 모니터링을 원하는 대로 설정할 수도 있다.
- 이것으로 데이터 플레인을 트러블슈팅하는 데 흔히 사용하는 도구 탐색을 마치겠다.
- 다양한 데이터 플레인 문제가 이전에는 블랙박스철머 보였을 수 있다.
- 하지만 지금부터 이런 문제를 마주했을 때 자신감을 갖고 명확한 출발점을 찾을 수 있어야 한다.
- 이스터이 작동 방식을 깊이 이해하고 적절한 도구가 있다면, 데이터 플레인 문제 디버깅이 휠씬 쉬워진다. (단, 결코 쉬운 일은 아니다)
- 이후 컨트롤 플레인에서 일어나는 문제를 해결하는 방법을 알아본다.
- 서비스 메시 내 워크로드 개수가 늘어나면 컨트롤 플레인이 따라서 확장될 수 있도록 함으로써, 컨트롤 플레인 성능을 개선하는 방법을 알아본다.
2.4.3 Summary
- istioctl 명령어를 사용해 서비스 메시와 서비스 프록시에 대한 통찰력을 얻는다.
- proxy-status 는 데이터 플레인 동기화 상태의 개요를 보여준다.
- analyze는 서비스 메시 설정을 분석한다.
- describe는 요약을 가져오고 서비스 프록시 설정을 검증한다.
- proxy-config는 서비스 프록시 설정을 쿼리하고 수정한다.
- istioctl analyze 명령을 사용해 클러스터에 적용하기 전에 설정을 검증할 수 있다.
- 키알리와 그 검증 기능을 사용해 일반적인 설정 실수를 잡아낼 수 있다.
- 장애 상황을 살펴보려면 프로메테우스와 수집한 메트릭을 사용하자.
- ksniff(tcpdump)를 사용해 영향을 받는 파드의 네트워크 트래픽을 캡처할 수 있다.
- istioctl proxy-config log 명령어를 사용해 엔보이 프록시의 로깅 수준을 높일 수 있다.
3. 튜닝
3.1 실습환경 구성
3.1.1 k8s(1.23.17) 배포
: NodePort(30000 HTTP, 30005 HTTPS)
#
git clone https://github.com/AcornPublishing/istio-in-action
cd istio-in-action/book-source-code-master
pwd # 각자 자신의 pwd 경로
code .

# 아래 extramounts 생략 시, myk8s-control-plane 컨테이너 sh/bash 진입 후 직접 git clone 가능
kind create cluster --name myk8s --image kindest/node:v1.23.17 --config - <<EOF
kind: Cluster
apiVersion: kind.x-k8s.io/v1alpha4
nodes:
- role: control-plane
  extraPortMappings:
  - containerPort: 30000 # Sample Application (istio-ingrssgateway) HTTP
    hostPort: 30000
  - containerPort: 30001 # Prometheus
    hostPort: 30001
  - containerPort: 30002 # Grafana
    hostPort: 30002
  - containerPort: 30003 # Kiali
    hostPort: 30003
  - containerPort: 30004 # Tracing
    hostPort: 30004
  - containerPort: 30005 # Sample Application (istio-ingrssgateway) HTTPS
    hostPort: 30005
  - containerPort: 30006 # TCP Route
    hostPort: 30006
  - containerPort: 30007 # kube-ops-view
    hostPort: 30007
  extraMounts: # 해당 부분 생략 가능
  - hostPath: /Users/sjkim/Labs/CloudNeta/istio/book-source-code-master # 각자 자신의 pwd 경로로 설정
    containerPath: /istiobook
networking:
  podSubnet: 10.10.0.0/16
  serviceSubnet: 10.200.1.0/22
EOF

# 설치 확인
docker ps

# 노드에 기본 툴 설치
docker exec -it myk8s-control-plane sh -c 'apt update && apt install tree psmisc lsof wget bridge-utils net-tools dnsutils tcpdump ngrep iputils-ping git vim -y'

# (옵션) kube-ops-view
helm repo add geek-cookbook https://geek-cookbook.github.io/charts/
helm install kube-ops-view geek-cookbook/kube-ops-view --version 1.2.2 --set service.main.type=NodePort,service.main.ports.http.nodePort=30007 --set env.TZ="Asia/Seoul" --namespace kube-system
kubectl get deploy,pod,svc,ep -n kube-system -l app.kubernetes.io/instance=kube-ops-view

## kube-ops-view 접속 URL 확인
open "http://localhost:30007/#scale=1.5"
open "http://localhost:30007/#scale=1.3"

# (옵션) metrics-server
helm repo add metrics-server https://kubernetes-sigs.github.io/metrics-server/
helm install metrics-server metrics-server/metrics-server --set 'args[0]=--kubelet-insecure-tls' -n kube-system
kubectl get all -n kube-system -l app.kubernetes.io/instance=metrics-server
3.1.2 [실습 환경 구성] istio 1.17.8 설치
# myk8s-control-plane 진입 후 설치 진행
docker exec -it myk8s-control-plane bash
-----------------------------------
# (옵션) 코드 파일들 마운트 확인
tree /istiobook/ -L 1
혹은
git clone ... /istiobook

# istioctl 설치
export ISTIOV=1.17.8
echo 'export ISTIOV=1.17.8' >> /root/.bashrc

curl -s -L https://istio.io/downloadIstio | ISTIO_VERSION=$ISTIOV sh -
cp istio-$ISTIOV/bin/istioctl /usr/local/bin/istioctl
istioctl version --remote=false

# demo 프로파일 컨트롤 플레인 배포
istioctl install --set profile=demo --set values.global.proxy.privileged=true --set meshConfig.accessLogEncoding=JSON -y

# 보조 도구 설치
kubectl apply -f istio-$ISTIOV/samples/addons

# 빠져나오기
exit
-----------------------------------

# 설치 확인 : istiod, istio-ingressgateway, crd 등
kubectl get istiooperators -n istio-system -o yaml
kubectl get all,svc,ep,sa,cm,secret,pdb -n istio-system
kubectl get cm -n istio-system istio -o yaml
kubectl get crd | grep istio.io | sort

# 실습을 위한 네임스페이스 설정
kubectl create ns istioinaction
kubectl label namespace istioinaction istio-injection=enabled
kubectl get ns --show-labels

# istio-ingressgateway 서비스 : NodePort 변경 및 nodeport 지정 변경 , externalTrafficPolicy 설정 (ClientIP 수집)
kubectl patch svc -n istio-system istio-ingressgateway -p '{"spec": {"type": "NodePort", "ports": [{"port": 80, "targetPort": 8080, "nodePort": 30000}]}}'
kubectl patch svc -n istio-system istio-ingressgateway -p '{"spec": {"type": "NodePort", "ports": [{"port": 443, "targetPort": 8443, "nodePort": 30005}]}}'
kubectl patch svc -n istio-system istio-ingressgateway -p '{"spec":{"externalTrafficPolicy": "Local"}}'
kubectl describe svc -n istio-system istio-ingressgateway

# NodePort 변경 및 nodeport 30001~30003으로 변경 : prometheus(30001), grafana(30002), kiali(30003), tracing(30004)
kubectl patch svc -n istio-system prometheus -p '{"spec": {"type": "NodePort", "ports": [{"port": 9090, "targetPort": 9090, "nodePort": 30001}]}}'
kubectl patch svc -n istio-system grafana -p '{"spec": {"type": "NodePort", "ports": [{"port": 3000, "targetPort": 3000, "nodePort": 30002}]}}'
kubectl patch svc -n istio-system kiali -p '{"spec": {"type": "NodePort", "ports": [{"port": 20001, "targetPort": 20001, "nodePort": 30003}]}}'
kubectl patch svc -n istio-system tracing -p '{"spec": {"type": "NodePort", "ports": [{"port": 80, "targetPort": 16686, "nodePort": 30004}]}}'

# Prometheus 접속 : envoy, istio 메트릭 확인
open http://127.0.0.1:30001

# Grafana 접속
open http://127.0.0.1:30002

# Kiali 접속 1 : NodePort
open http://127.0.0.1:30003

# (옵션) Kiali 접속 2 : Port forward
kubectl port-forward deployment/kiali -n istio-system 20001:20001 &
open http://127.0.0.1:20001

# tracing 접속 : 예거 트레이싱 대시보드
open http://127.0.0.1:30004
3.2 컨트롤 플레인의 주요목표
3.2.1 들어가며 : 유령 워크로드와 대응 방안
🤔 유령 워크로드(Phantom Workload)는 컨트롤 플레인이 런타임 환경의 변화를 제때 반영하지 못할 때 발생하는 성능 저하 현상입니다. 요약하면 다음과 같습니다:
- Istio 컨트롤 플레인은 Kubernetes 이벤트를 수신해 메시 설정을 동기화합니다.
- 이 동기화 과정이 지연되면, 메시 설정은 실제 상태와 불일치하게 됩니다.
- 그 결과, 이미 종료된 엔드포인트로 트래픽을 라우팅하게 되어 요청 실패가 발생하며, 이를 유령 워크로드라고 부릅니다.
- 이는 메시가 이미 변경된 워크로드 상태를 제대로 반영하지 못해 발생합니다.
이처럼 유령 워크로드는 메시 설정이 실제 환경을 따라가지 못할 때 생기는 대표적인 문제입니다.
- 비정상이 된 워크로드가 이벤트를 트리거한다.
- 업데이트가 지연되면 서비스가 낡은 설정을 지니게 된다.
- 오래된? 설정 때문에 서비스가 트래픽이 존재하지 않은 워크로드로 라우팅한다.
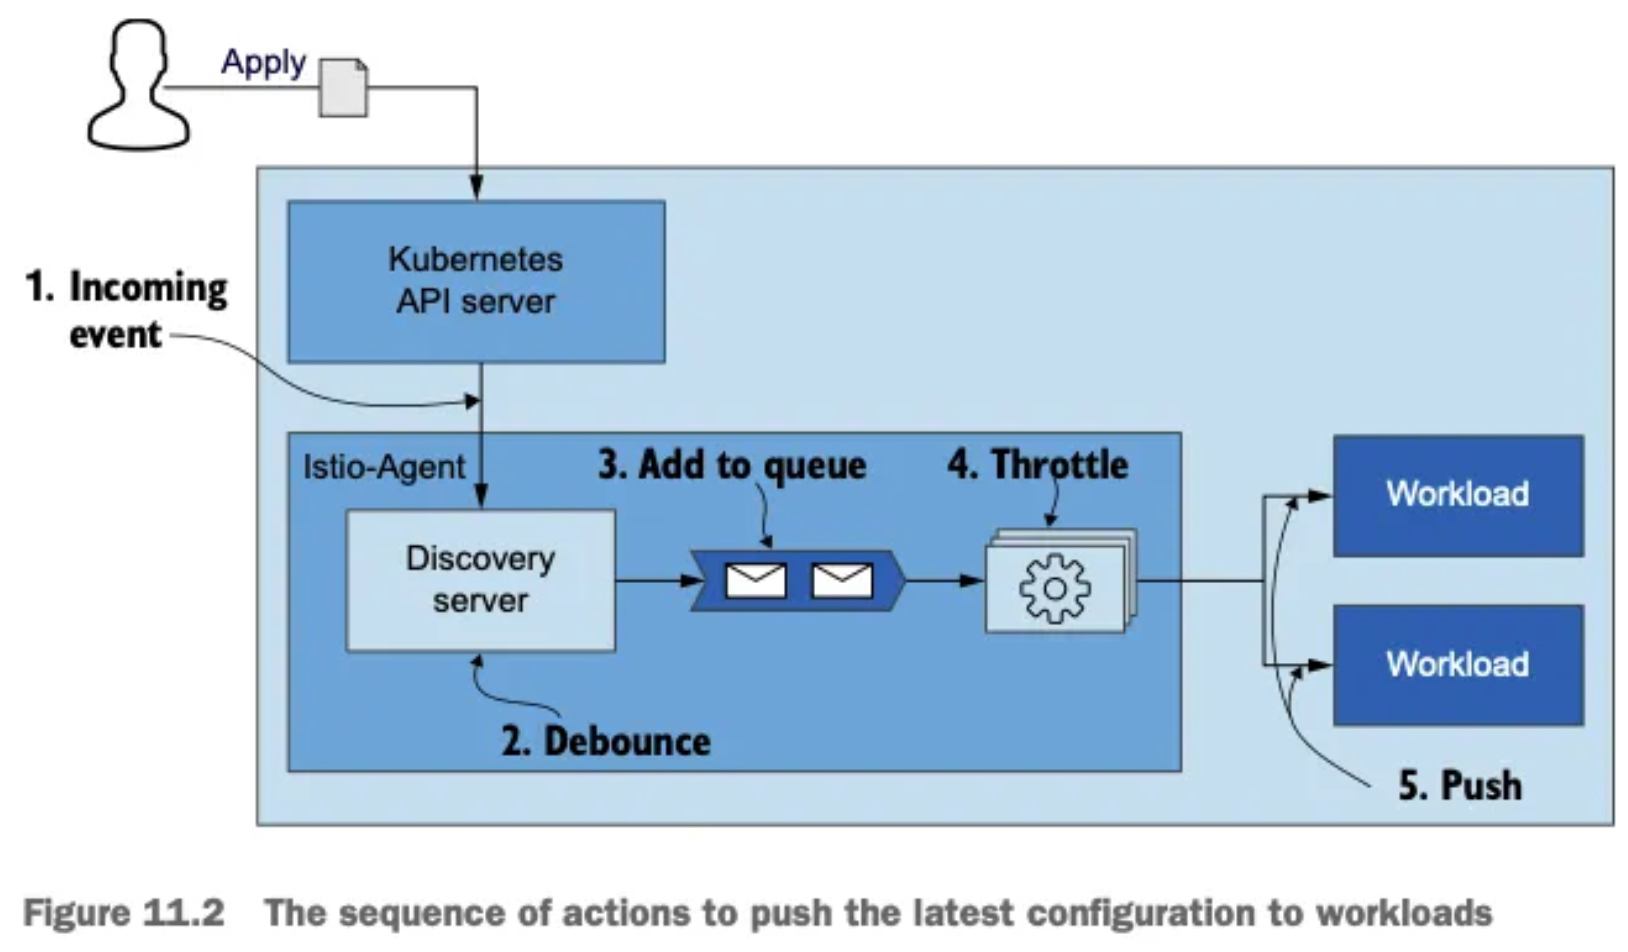
- 데이터 플레인의 궁극적 일관성 eventually consistent 성질 덕분에 설정이 잠깐 낡은 것은 그리 문제가 되지 않는다.
- 다른 보호 기체를 사용할 수 있기 때문이다. as other protective mechanisms can be employed.
- 예를 들어 네트워크 문제로 요청이 실패하면 요청은 기본적으로 두 번 재시도되므로, 아마도 다른 정상 엔드포인트가 처리할 것이다.
- 또 다른 교정 방법으로는 이상값 감지가 있는데, 엔드포인트로 보낸 요청이 실패했을 때 클러스터에서 엔드포인트를 배제하는 것이다.
- 그러나 지연이 몇 초를 넘어가면 최종 사용자에게 부정적인 영향을 미칠 수 있으므로 반드시 피해야 한다.
3.2.2 데이터 플레인 동기화 단계 이해하기
- 데이터 플레인을 원하는 상태로 동기화하는 과정은 여러 단계로 수행된다.
- 컨트롤 플레인은 쿠버네티스에서 이벤트를 수신한다.
- 이벤트는 엔보이 설정으로 변환돼 데이터 플레인의 서비스 프록시로 푸시된다.
- 이 과정을 이해하면 컨트롤 플레인 성능을 미세 조정하고 최적화할 때 이뤄지는 의사결정에 도움이 된다.
- 그림 11.2는 들어오는 변경 사항에 맞춰 데이터 플레인을 동기화하는 단계를 순서대로 보여준다.
- 들어오는 이벤트가 동기화 과정을 시작한다.
- istiod 의 DiscoveryServer 구성 요소가 이 이벤트들을 수신한다.
- 성능을 향상시키기 위해, 푸시 대기열에 이벤트를 추가하는 작업을 일정 시간 미루고 그 동안의 후속 이벤트를 병합해 일괄 처리한다.
- 이를 ‘디바운스 debounce 한다’고 말하는데, 디바운스는 시간을 잡아먹는 작업이 너무 자주 실행되지 않도록 해준다.
- 지연 시간이 만료되면, DiscoveryServer가 병합된 이벤트를 푸시 대기열에 추가한다. 푸시 대기열은 처리 대기 중인 푸시 목록을 유지 관리한다.
- istiod 서버는 동시에 처리되는 푸시 요청 개수를 제한 throttle 하는데, 이는 처리 중인 항목이 더 빨리 처리되도록 보장하고 CPU 시간이 작업 간 콘텍스트 스위칭에 낭비되는 것을 방지한다.ext switching between the tasks.*
- 처리된 항목은 엔보이 설정으로 변환돼 워크로드로 푸시된다.
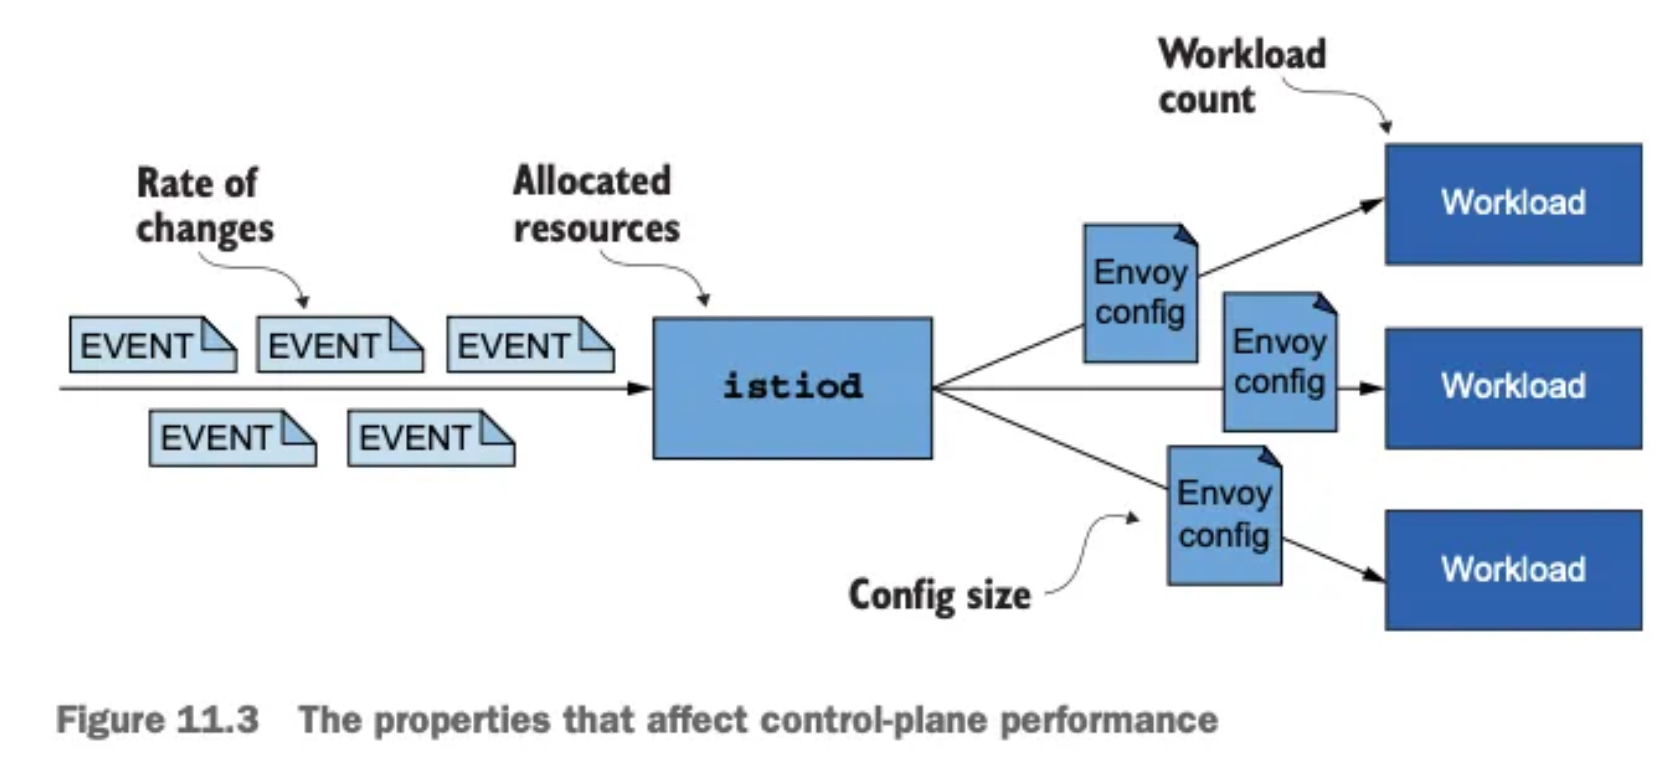
- 여기서는 이스티오가 디바운스(디바운싱 debouncing)와 스로틀링 throttling 이라는 두 가지 방법을 사용해 과부하되지 않도록 스스로를 보호하는 방법을 다룬다.
- 추후 살펴보겠지만 디바운스와 스로틀링은 성능을 향상시키기 위해 설정할 수 있는 것이다.
3.2.3 성능을 결정짓는 요소
변경 속도, 할당된 리소스, 업데이트할 워크로드 개수, 설정 크기
-
동기화 프로세스를 잘 이해하면, 컨트롤 플레인의 성능에 영향을 미치는 요소를 자세히 설명할 수 있다.
- 변경 속도
- 변경 속도가 빠를수록 데이터 플레인을 동기화 상태로 유지하는 데 더 많은 처리가 필요하다.
- 할당된 리소스
- 수요가 istiod에 할당된 리소스를 넘어서면 작업을 대기열에 넣어야하므로 업데이트 배포가 느려진다.
- 업데이트할 워크로드 개수
- 더 많은 워크로드에 업데이트를 배포하려면 네트워크 대역폭과 처리 능력이 더 많이 필요하다.
- 설정 크기
- 더 큰 엔보이 구성을 배포하려면 처리 능력과 네트워크 대역폭이 더 많이 필요하다.
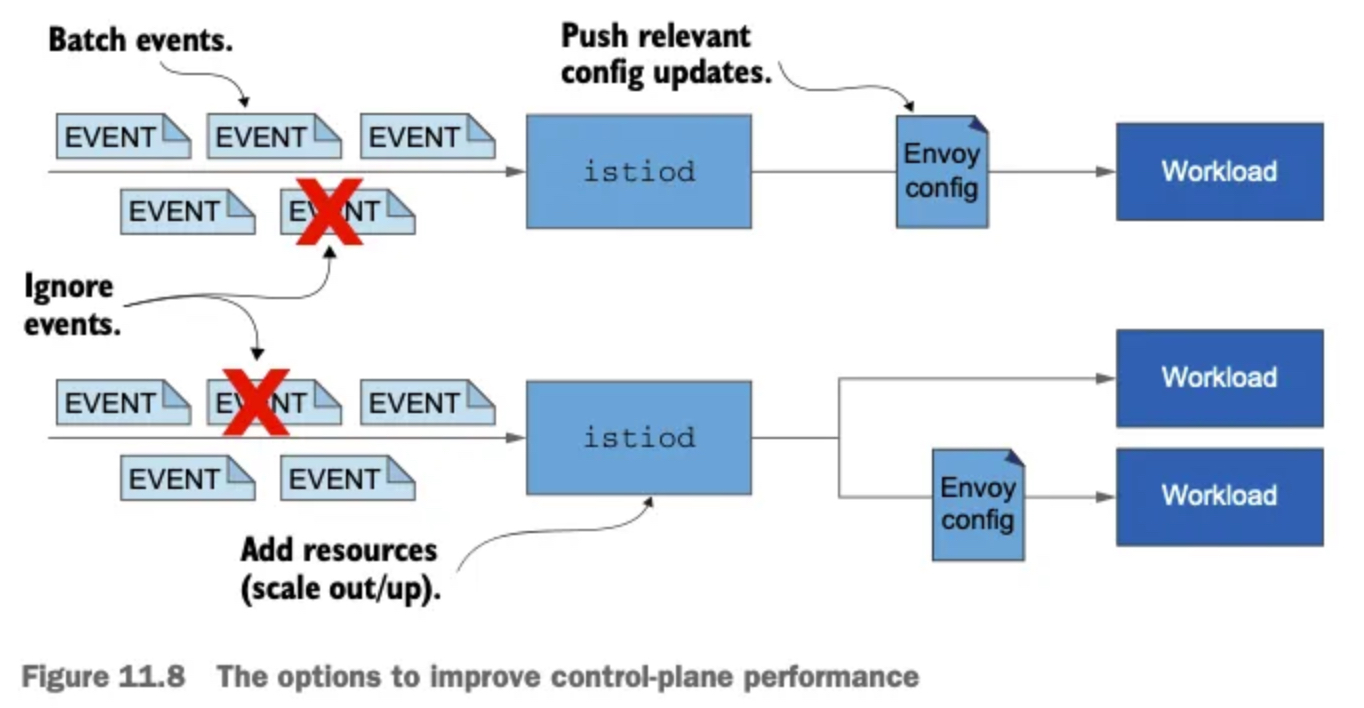
- 변경 속도
-
이 요소들에 맞게 성능을 최적화하는 방법을 다룰 것이다.
-
그러니 그 전에 프로메테우스가 istiod에서 수집한 메트릭을 시각화한 그라파나 대시보드를 사용해 병목 지점을 판단하는 방법을 배워보자.
3.3 컨트롤 플레인 모니터링하기
3.3.1 들어가며 : Monitoring the control plane
- istiod는 핵심 성능 지표의 지속 시간 및 빈도를 측정하는 메트릭을 노출하는데, 여기에는 리소스 사용률, 수신 또는 발신 트래픽으로 인한 부하, 오류 비율 등이 있다.
- 이런 지표들은 제어 평면의 성능이 어떤지, 어떤 것이 곧 문제를 일으킬지, 이미 올바르게 동작하지 않는 것을 어떻게 트러블슈팅해야 하는지를 밝히는 데 도움을 준다.
- 노출되는 메트릭들은 이스티오 공식 문서에 기술돼 있는데, 메트릭 개수는 방대하다 - Docs
- 여기서는 주목해야 할 핵심 메트릭을 식별하고, 네 가지 황금 신호에 대략 맞도록 메트릭을 정리해볼 것이다.
3.3.2 컨트롤 플레인의 네 가지 황금 신호
🛠️ 들어가며 : 실습 환경 초기화
- 구글 SRE 책에서 정의한 네 가지 황금 신호란 서비스가 어떻게 동작하는지에 대한 외부의 시각을 이해하기 위해 모니터링해야 하는 네 가지 주요 메트릭을 말한다.
- 특정 서비스가 자신의 서비스 수준 목표 SLO 에서 벗어난 경우, 황금 메트릭을 통해 원인을 분석하는 통찰력을 얻을 수 있다.
- 네 가지 신호는 지연 시간, 포화도, 오류, 트래픽이다.
- 컨트롤 플레인의 메트릭을 빠르게 살펴보려면 다음 명령어로 쿼리하면 된다.
# 실습 환경 준비
kubectl -n istioinaction apply -f services/catalog/kubernetes/catalog.yaml
kubectl -n istioinaction apply -f ch11/catalog-virtualservice.yaml
kubectl -n istioinaction apply -f ch11/catalog-gateway.yaml

# 확인
kubectl get deploy,gw,vs -n istioinaction

# 반복 설정 해두기
while true; do curl -s http://catalog.istioinaction.io:30000/items ; date "+%Y-%m-%d %H:%M:%S" ; sleep 1; echo; done


# 컨트롤 플레인 메트릭 확인
kubectl exec -it -n istio-system deploy/istiod -- curl localhost:15014/metrics
# HELP citadel_server_csr_count The number of CSRs received by Citadel server.
# TYPE citadel_server_csr_count counter
citadel_server_csr_count 3
...
🎯 지연 시간: 데이터 플레인을 업데이트하는 데 필요한 시간 LATENCY
🎯 포화도: 컨트롤 플레인이 얼마나(CPU, MEM 리소스) 가득 차 있는가? SATURATION
🎯 트래픽: 컨트롤 플레인의 부하는 어느 정도인가? TRAFFIC:
🎯 오류: 컨트롤 플레인의 실패율은 어떻게 되는가? ERRORS
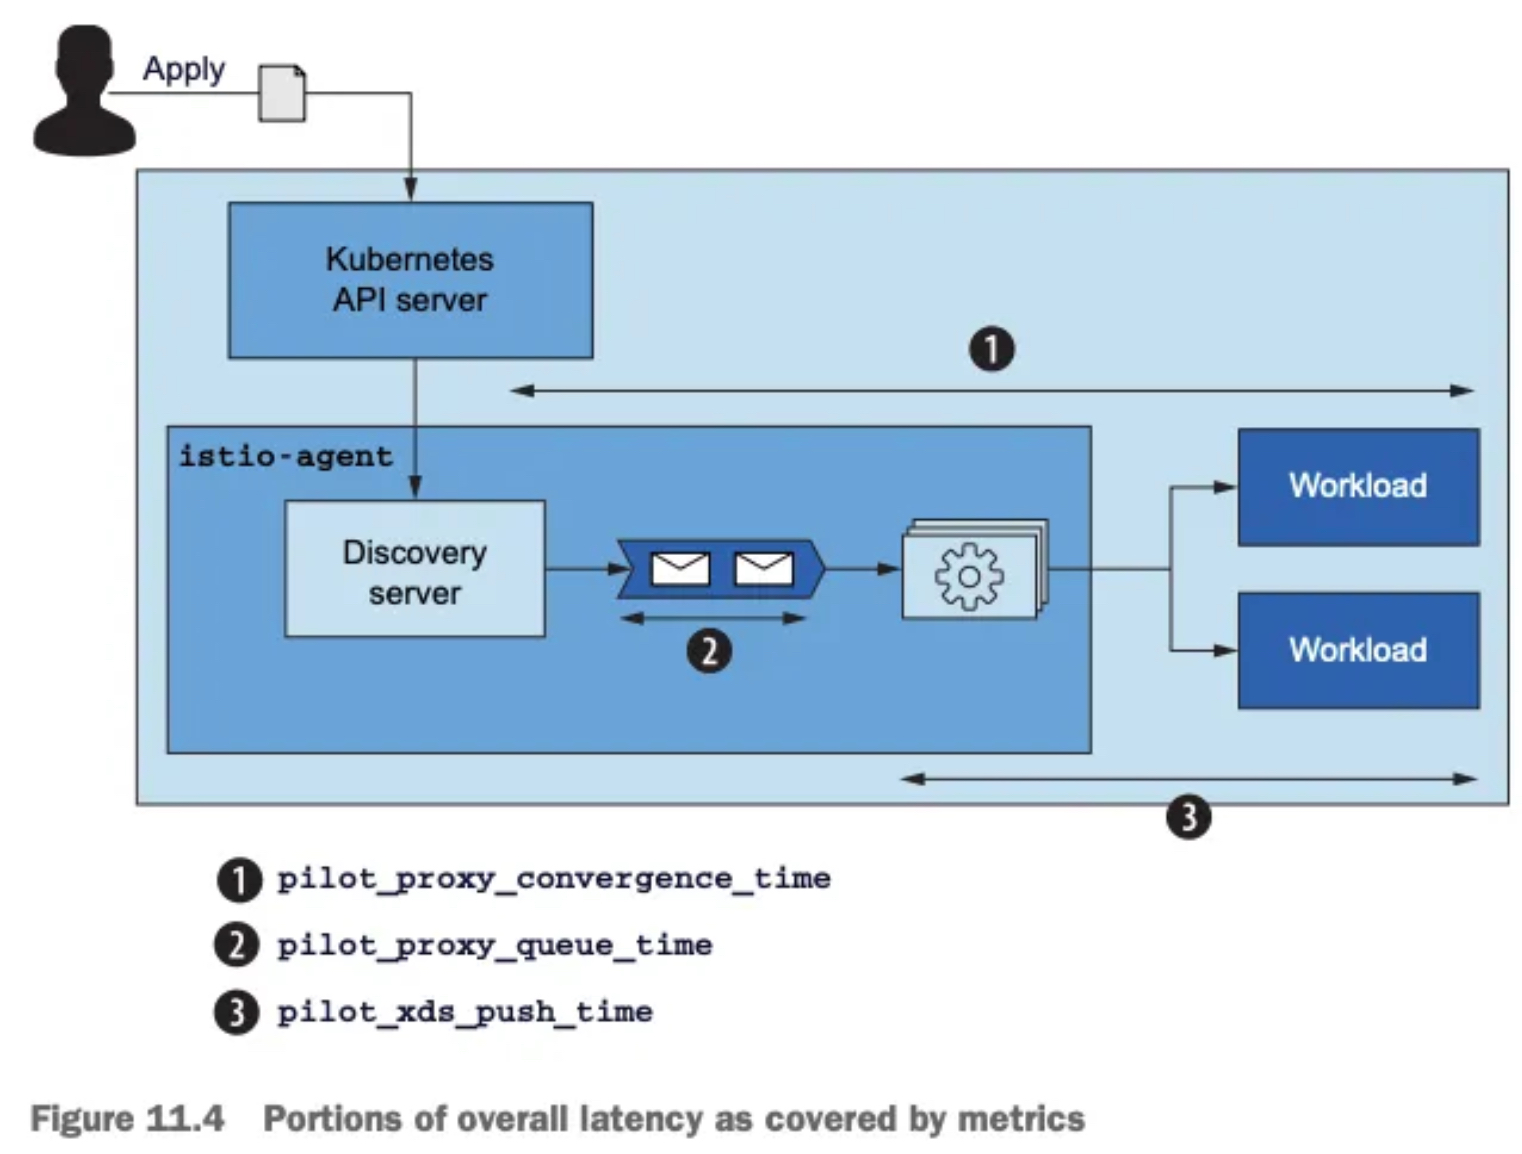
3.4 성능 튜닝하기
3.4.1 들어가며 : 컨트롤 플레인 성능의 변수
- 컨트롤 플레인의 성능 요인은 클러스터/환경의 변화 속도, 리소스 할당량, 관리하는 워크로드 개수, 그 워크로드로 푸시하는 설정 크기 라는 점을 돌이켜보자.
- 이들 중 하나라도 병목이 되면, 성능을 개선할 수 있는 방법은 그림 11.8처럼 여러 가지가 있다.
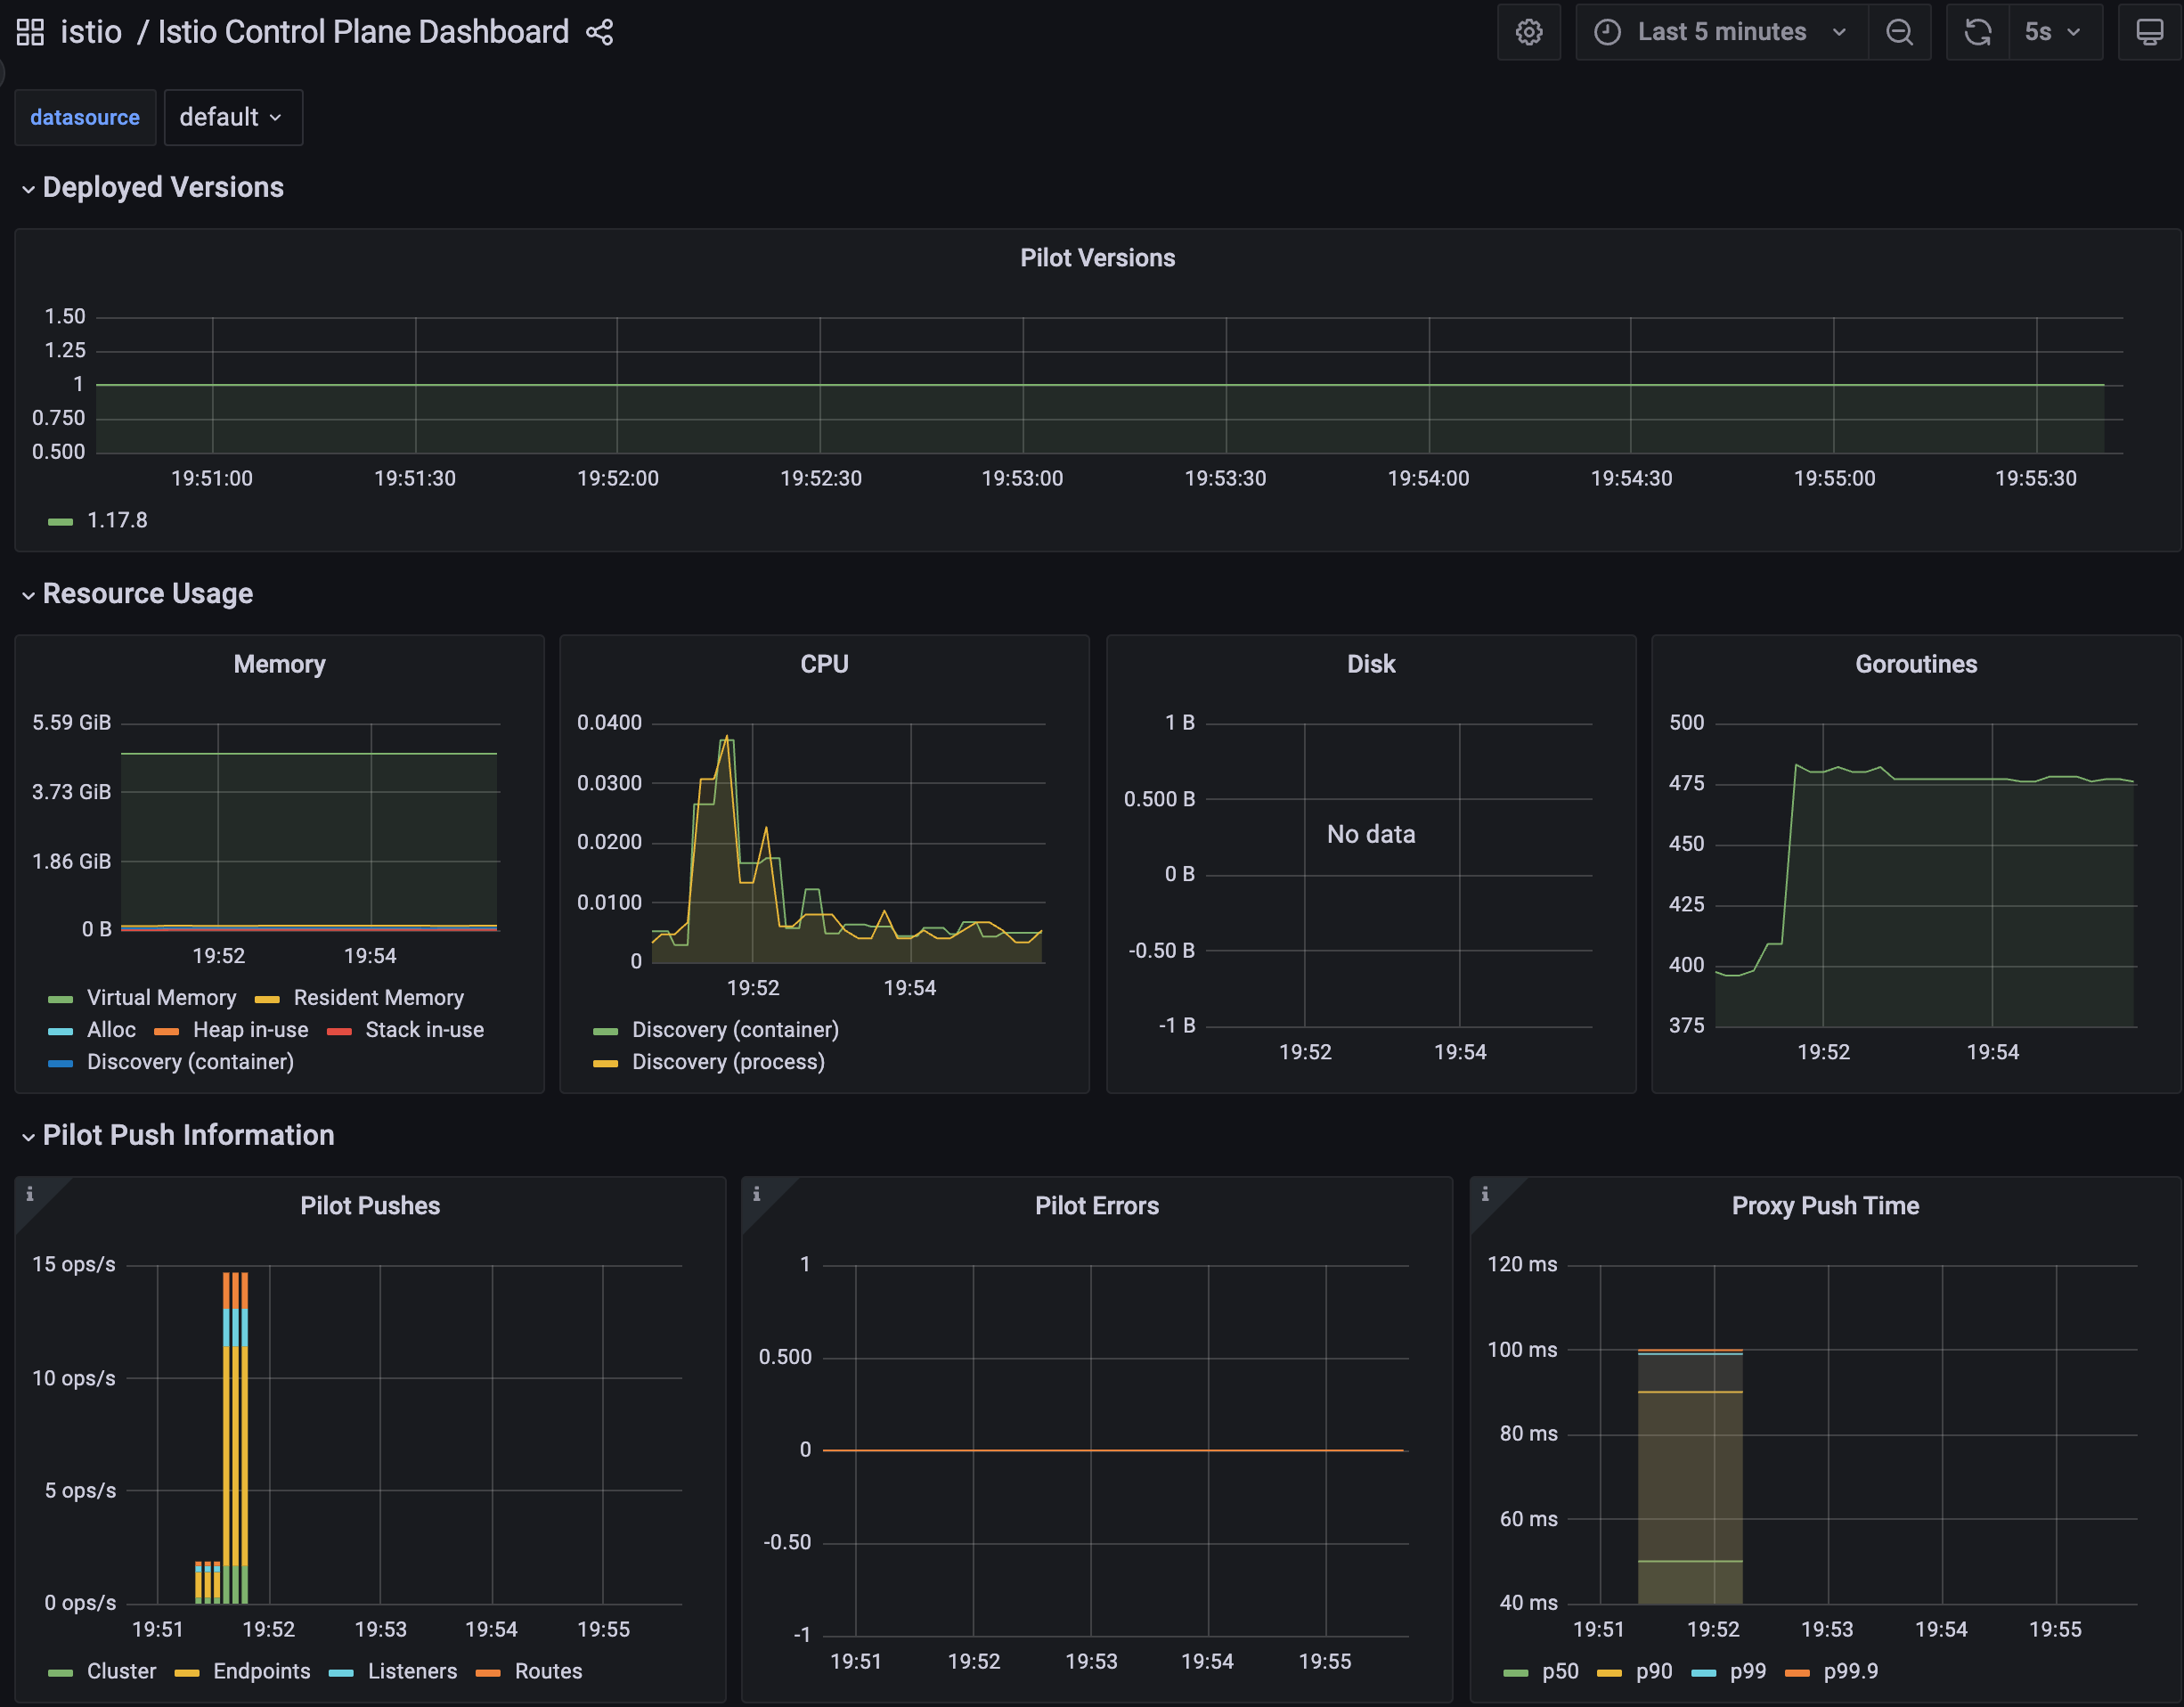
- 컨트롤 플레인 성능의 변수
- 서비스 메시와 관련 없는 이벤트 무시하기.
- 이벤트 배치 처리 기간을 좀 더 늘려 데이터 플레인 업데이트에 필요한 푸시 횟수 줄이기
- 다음 방법으로 리소스 추가 할당
- istiod 디플로이먼트 스케일 아웃하기 : 관리하는 워크로드를 파일럿 인스턴스들에 나눠 부하를 경감
- istiod 디플로이먼트 스케일 업하기 : 엔보이 설정 생성 속도를 높이고 더 많은 푸시 요청을 동시에 처리
- 워크로드가 관련 있는 설정을 컨트롤 플레인에게 알리는 사이드카 설정을 정의해 관련 있는 업데이트만 워크로드로 푸시하기. 2가지 이점.
- 해당 프로세스에 필요한 최소한의 요청만을 보냄으로써 서비스 프록시에 보내는 설정 크기를 줄인다.
- 이벤트 하나로 업데이트되는 프록시 개수를 줄인다.
- 이런 방법으로 어떻게 성능을 개선하는지 보여줄 수 있도록 클러스터에 서비스를 준비하고 성능 테스트를 정의해보자.
3.4.2 워크스페이스 준비하기
: 실습 환경 준비 - 더미 워크로드와 서비스 생성
- istiod에게 관리할 워크로드를 주기 위해 catalog 워크로드와 더미 워크로드 10개를 만들어보자
# 실습 환경 준비 : 이미 설정함
kubectl -n istioinaction apply -f services/catalog/kubernetes/catalog.yaml
kubectl -n istioinaction apply -f ch11/catalog-virtualservice.yaml
kubectl -n istioinaction apply -f ch11/catalog-gateway.yaml
kubectl get deploy,gw,vs -n istioinaction

# 반복 설정 해두기
while true; do curl -s http://catalog.istioinaction.io:30000/items ; date "+%Y-%m-%d %H:%M:%S" ; sleep 1; echo; done

# 모니터링
while true; do kubectl top pod -n istio-system -l app=istiod --containers=true ; date "+%Y-%m-%d %H:%M:%S" ; sleep 1; echo; done
POD                     NAME        CPU(cores)   MEMORY(bytes)
istiod-8d74787f-mbzjl   discovery   5m           48Mi
2025-05-17 19:50:15

POD                     NAME        CPU(cores)   MEMORY(bytes)
istiod-8d74787f-mbzjl   discovery   5m           48Mi
2025-05-17 19:50:16
...


# 더미 워크로드 10개 생성
cat ch11/sleep-dummy-workloads.yaml
...
apiVersion: v1
kind: Service
...
spec:
  ports:
  - port: 80
    name: http
  selector:
    app: sleep
---
apiVersion: apps/v1
kind: Deployment
...
    spec:
      serviceAccountName: sleep
      containers:
      - name: sleep
        image: governmentpaas/curl-ssl
        command: ["/bin/sleep", "3650d"]
        imagePullPolicy: IfNotPresent
...

kubectl -n istioinaction apply -f ch11/sleep-dummy-workloads.yaml


# 확인
kubectl get deploy,svc,pod -n istioinaction
NAME                      READY   UP-TO-DATE   AVAILABLE   AGE
deployment.apps/catalog   1/1     1            1           41m
deployment.apps/sleep     10/10   10           10          31s

NAME              TYPE        CLUSTER-IP    EXTERNAL-IP   PORT(S)   AGE
service/catalog   ClusterIP   10.200.0.37   <none>        80/TCP    18m
service/sleep     ClusterIP   10.200.0.54   <none>        80/TCP    31s

NAME                         READY   STATUS    RESTARTS   AGE
pod/catalog-6cf4b97d-9wv6m   2/2     Running   0          41m
pod/sleep-6f8cfb8c8f-225tx   2/2     Running   0          30s
pod/sleep-6f8cfb8c8f-7xjrw   2/2     Running   0          30s
pod/sleep-6f8cfb8c8f-b9p8m   2/2     Running   0          30s
pod/sleep-6f8cfb8c8f-f7rwl   2/2     Running   0          30s
pod/sleep-6f8cfb8c8f-jq8rh   2/2     Running   0          30s
pod/sleep-6f8cfb8c8f-n6k6c   2/2     Running   0          31s
pod/sleep-6f8cfb8c8f-nq992   2/2     Running   0          31s
pod/sleep-6f8cfb8c8f-ntbpn   2/2     Running   0          31s
pod/sleep-6f8cfb8c8f-p7v7f   2/2     Running   0          31s
pod/sleep-6f8cfb8c8f-rhpqf   2/2     Running   0          30s
...

docker exec -it myk8s-control-plane istioctl proxy-status
NAME                                                   CLUSTER        CDS        LDS        EDS        RDS          ECDS         ISTIOD                    VERSION
catalog-6cf4b97d-9wv6m.istioinaction                   Kubernetes     SYNCED     SYNCED     SYNCED     SYNCED       NOT SENT     istiod-8d74787f-mbzjl     1.17.8
istio-egressgateway-85df6b84b7-kdw6m.istio-system      Kubernetes     SYNCED     SYNCED     SYNCED     NOT SENT     NOT SENT     istiod-8d74787f-mbzjl     1.17.8
istio-ingressgateway-6bb8fb6549-2s22k.istio-system     Kubernetes     SYNCED     SYNCED     SYNCED     SYNCED       NOT SENT     istiod-8d74787f-mbzjl     1.17.8
sleep-6f8cfb8c8f-225tx.istioinaction                   Kubernetes     SYNCED     SYNCED     SYNCED     SYNCED       NOT SENT     istiod-8d74787f-mbzjl     1.17.8
sleep-6f8cfb8c8f-7xjrw.istioinaction                   Kubernetes     SYNCED     SYNCED     SYNCED     SYNCED       NOT SENT     istiod-8d74787f-mbzjl     1.17.8
sleep-6f8cfb8c8f-b9p8m.istioinaction                   Kubernetes     SYNCED     SYNCED     SYNCED     SYNCED       NOT SENT     istiod-8d74787f-mbzjl     1.17.8
sleep-6f8cfb8c8f-f7rwl.istioinaction                   Kubernetes     SYNCED     SYNCED     SYNCED     SYNCED       NOT SENT     istiod-8d74787f-mbzjl     1.17.8
sleep-6f8cfb8c8f-jq8rh.istioinaction                   Kubernetes     SYNCED     SYNCED     SYNCED     SYNCED       NOT SENT     istiod-8d74787f-mbzjl     1.17.8
sleep-6f8cfb8c8f-n6k6c.istioinaction                   Kubernetes     SYNCED     SYNCED     SYNCED     SYNCED       NOT SENT     istiod-8d74787f-mbzjl     1.17.8
sleep-6f8cfb8c8f-nq992.istioinaction                   Kubernetes     SYNCED     SYNCED     SYNCED     SYNCED       NOT SENT     istiod-8d74787f-mbzjl     1.17.8
sleep-6f8cfb8c8f-ntbpn.istioinaction                   Kubernetes     SYNCED     SYNCED     SYNCED     SYNCED       NOT SENT     istiod-8d74787f-mbzjl     1.17.8
sleep-6f8cfb8c8f-p7v7f.istioinaction                   Kubernetes     SYNCED     SYNCED     SYNCED     SYNCED       NOT SENT     istiod-8d74787f-mbzjl     1.17.8
sleep-6f8cfb8c8f-rhpqf.istioinaction                   Kubernetes     SYNCED     SYNCED     SYNCED     SYNCED       NOT SENT     istiod-8d74787f-mbzjl     1.17.8
#
docker exec -it myk8s-control-plane istioctl proxy-config cluster deploy/catalog.istioinaction --fqdn sleep.istioinaction.svc.cluster.local
SERVICE FQDN                              PORT     SUBSET     DIRECTION     TYPE     DESTINATION RULE
sleep.istioinaction.svc.cluster.local     80       -          outbound      EDS

docker exec -it myk8s-control-plane istioctl proxy-config endpoint deploy/catalog.istioinaction
ENDPOINT                                                STATUS      OUTLIER CHECK     CLUSTER
10.10.0.10:9090                                         HEALTHY     OK                outbound|9090||kiali.istio-system.svc.cluster.local
10.10.0.10:20001                                        HEALTHY     OK                outbound|20001||kiali.istio-system.svc.cluster.local
10.10.0.11:9090                                         HEALTHY     OK                outbound|9090||prometheus.istio-system.svc.cluster.local
10.10.0.12:3000                                         HEALTHY     OK                inbound|3000||
10.10.0.12:3000                                         HEALTHY     OK                outbound|80||catalog.istioinaction.svc.cluster.local
10.10.0.13:10250                                        HEALTHY     OK                outbound|443||metrics-server.kube-system.svc.cluster.local
10.10.0.14:80                                           HEALTHY     OK                outbound|80||sleep.istioinaction.svc.cluster.local
10.10.0.15:80                                           HEALTHY     OK                outbound|80||sleep.istioinaction.svc.cluster.local
10.10.0.16:80                                           HEALTHY     OK                outbound|80||sleep.istioinaction.svc.cluster.local
10.10.0.17:80                                           HEALTHY     OK                outbound|80||sleep.istioinaction.svc.cluster.local
10.10.0.18:80                                           HEALTHY     OK                outbound|80||sleep.istioinaction.svc.cluster.local
10.10.0.19:80                                           HEALTHY     OK                outbound|80||sleep.istioinaction.svc.cluster.local
10.10.0.2:53                                            HEALTHY     OK                outbound|53||kube-dns.kube-system.svc.cluster.local
10.10.0.2:9153                                          HEALTHY     OK                outbound|9153||kube-dns.kube-system.svc.cluster.local
10.10.0.20:80                                           HEALTHY     OK                outbound|80||sleep.istioinaction.svc.cluster.local
10.10.0.21:80                                           HEALTHY     OK                outbound|80||sleep.istioinaction.svc.cluster.local
10.10.0.22:80                                           HEALTHY     OK                outbound|80||sleep.istioinaction.svc.cluster.local
10.10.0.23:80                                           HEALTHY     OK                outbound|80||sleep.istioinaction.svc.cluster.local
10.10.0.3:53                                            HEALTHY     OK                outbound|53||kube-dns.kube-system.svc.cluster.local
10.10.0.3:9153                                          HEALTHY     OK                outbound|9153||kube-dns.kube-system.svc.cluster.local
10.10.0.5:15010                                         HEALTHY     OK                outbound|15010||istiod.istio-system.svc.cluster.local
10.10.0.5:15012                                         HEALTHY     OK                outbound|15012||istiod.istio-system.svc.cluster.local
10.10.0.5:15014                                         HEALTHY     OK                outbound|15014||istiod.istio-system.svc.cluster.local
10.10.0.5:15017                                         HEALTHY     OK                outbound|443||istiod.istio-system.svc.cluster.local
10.10.0.6:8080                                          HEALTHY     OK                outbound|80||istio-ingressgateway.istio-system.svc.cluster.local
10.10.0.6:8443                                          HEALTHY     OK                outbound|443||istio-ingressgateway.istio-system.svc.cluster.local
10.10.0.6:15021                                         HEALTHY     OK                outbound|15021||istio-ingressgateway.istio-system.svc.cluster.local
10.10.0.6:15443                                         HEALTHY     OK                outbound|15443||istio-ingressgateway.istio-system.svc.cluster.local
10.10.0.6:31400                                         HEALTHY     OK                outbound|31400||istio-ingressgateway.istio-system.svc.cluster.local
10.10.0.7:8080                                          HEALTHY     OK                outbound|80||istio-egressgateway.istio-system.svc.cluster.local
10.10.0.7:8443                                          HEALTHY     OK                outbound|443||istio-egressgateway.istio-system.svc.cluster.local
10.10.0.8:3000                                          HEALTHY     OK                outbound|3000||grafana.istio-system.svc.cluster.local
10.10.0.9:9411                                          HEALTHY     OK                outbound|9411||jaeger-collector.istio-system.svc.cluster.local
10.10.0.9:9411                                          HEALTHY     OK                outbound|9411||zipkin.istio-system.svc.cluster.local
10.10.0.9:14250                                         HEALTHY     OK                outbound|14250||jaeger-collector.istio-system.svc.cluster.local
10.10.0.9:14268                                         HEALTHY     OK                outbound|14268||jaeger-collector.istio-system.svc.cluster.local
10.10.0.9:16685                                         HEALTHY     OK                outbound|16685||tracing.istio-system.svc.cluster.local
10.10.0.9:16686                                         HEALTHY     OK                outbound|80||tracing.istio-system.svc.cluster.local
10.200.3.63:9411                                        HEALTHY     OK                zipkin
127.0.0.1:15000                                         HEALTHY     OK                prometheus_stats
127.0.0.1:15020                                         HEALTHY     OK                agent
172.18.0.2:6443                                         HEALTHY     OK                outbound|443||kubernetes.default.svc.cluster.local
unix://./etc/istio/proxy/XDS                            HEALTHY     OK                xds-grpc
unix://./var/run/secrets/workload-spiffe-uds/socket HEALTHY OK sds-grpc- 그라파나 대시보드 : Last 5 minutes
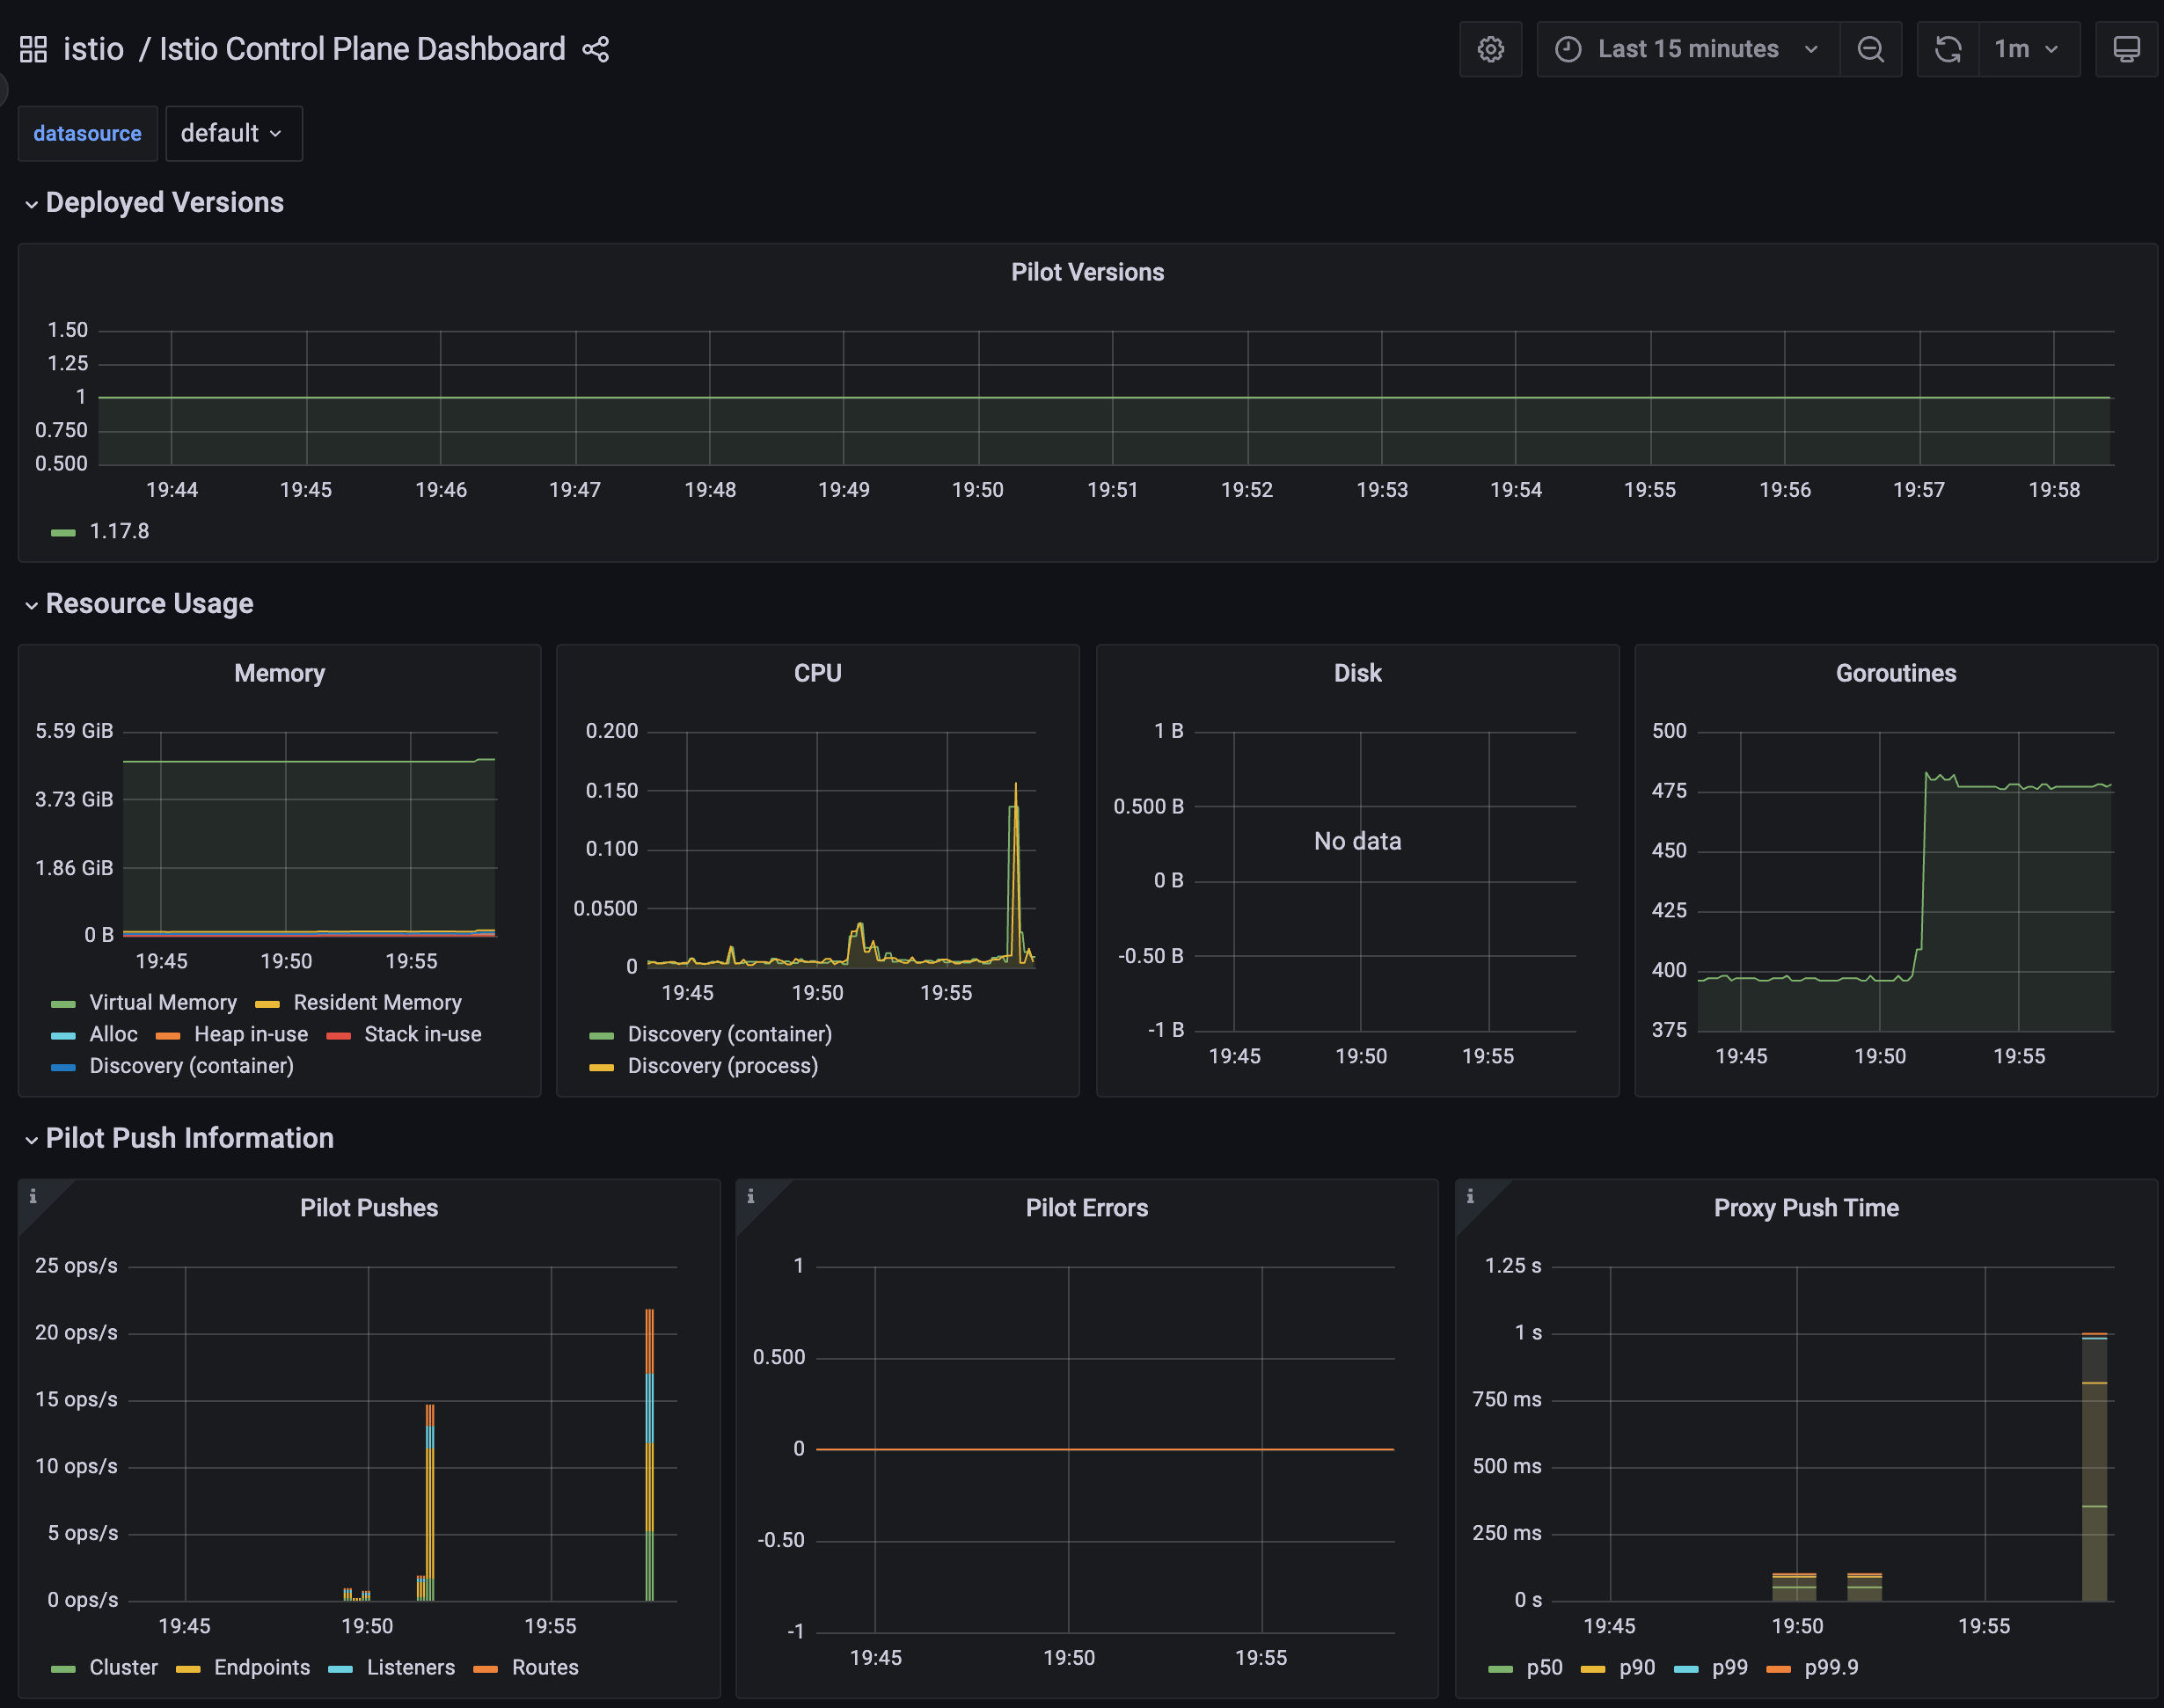
- 이 정도는 파일럿에게 아직도 너무 쉽다. 몇 가지 더미 서비스로 엔보이 설정을 부풀려 상황을 악화시켜보자 : svc 200개, vs 200개, gw 200개
#
cat ch11/resources-600.yaml
cat ch11/resources-600.yaml | wc -l
    9200

# 각각 200개
cat ch11/resources-600.yaml | grep 'kind: Service' | wc -l
cat ch11/resources-600.yaml | grep 'kind: Gateway' | wc -l
cat ch11/resources-600.yaml | grep 'kind: VirtualService' | wc -l
     200

# 배포 : svc 200개, vs 200개, gw 200개
kubectl -n istioinaction apply -f ch11/resources-600.yaml


# 확인
kubectl get deploy,svc,pod -n istioinaction
...

# k8s service 개수 202개
kubectl get svc -n istioinaction --no-headers=true | wc -l
     202

kubectl get gw,vs -n istioinaction
...

#
docker exec -it myk8s-control-plane istioctl proxy-status
docker exec -it myk8s-control-plane istioctl proxy-config listener deploy/catalog.istioinaction
docker exec -it myk8s-control-plane istioctl proxy-config route deploy/catalog.istioinaction
docker exec -it myk8s-control-plane istioctl proxy-config cluster deploy/catalog.istioinaction
docker exec -it myk8s-control-plane istioctl proxy-config endpoint deploy/catalog.istioinaction- 그라파나 대시보드 : Last 15 minutes
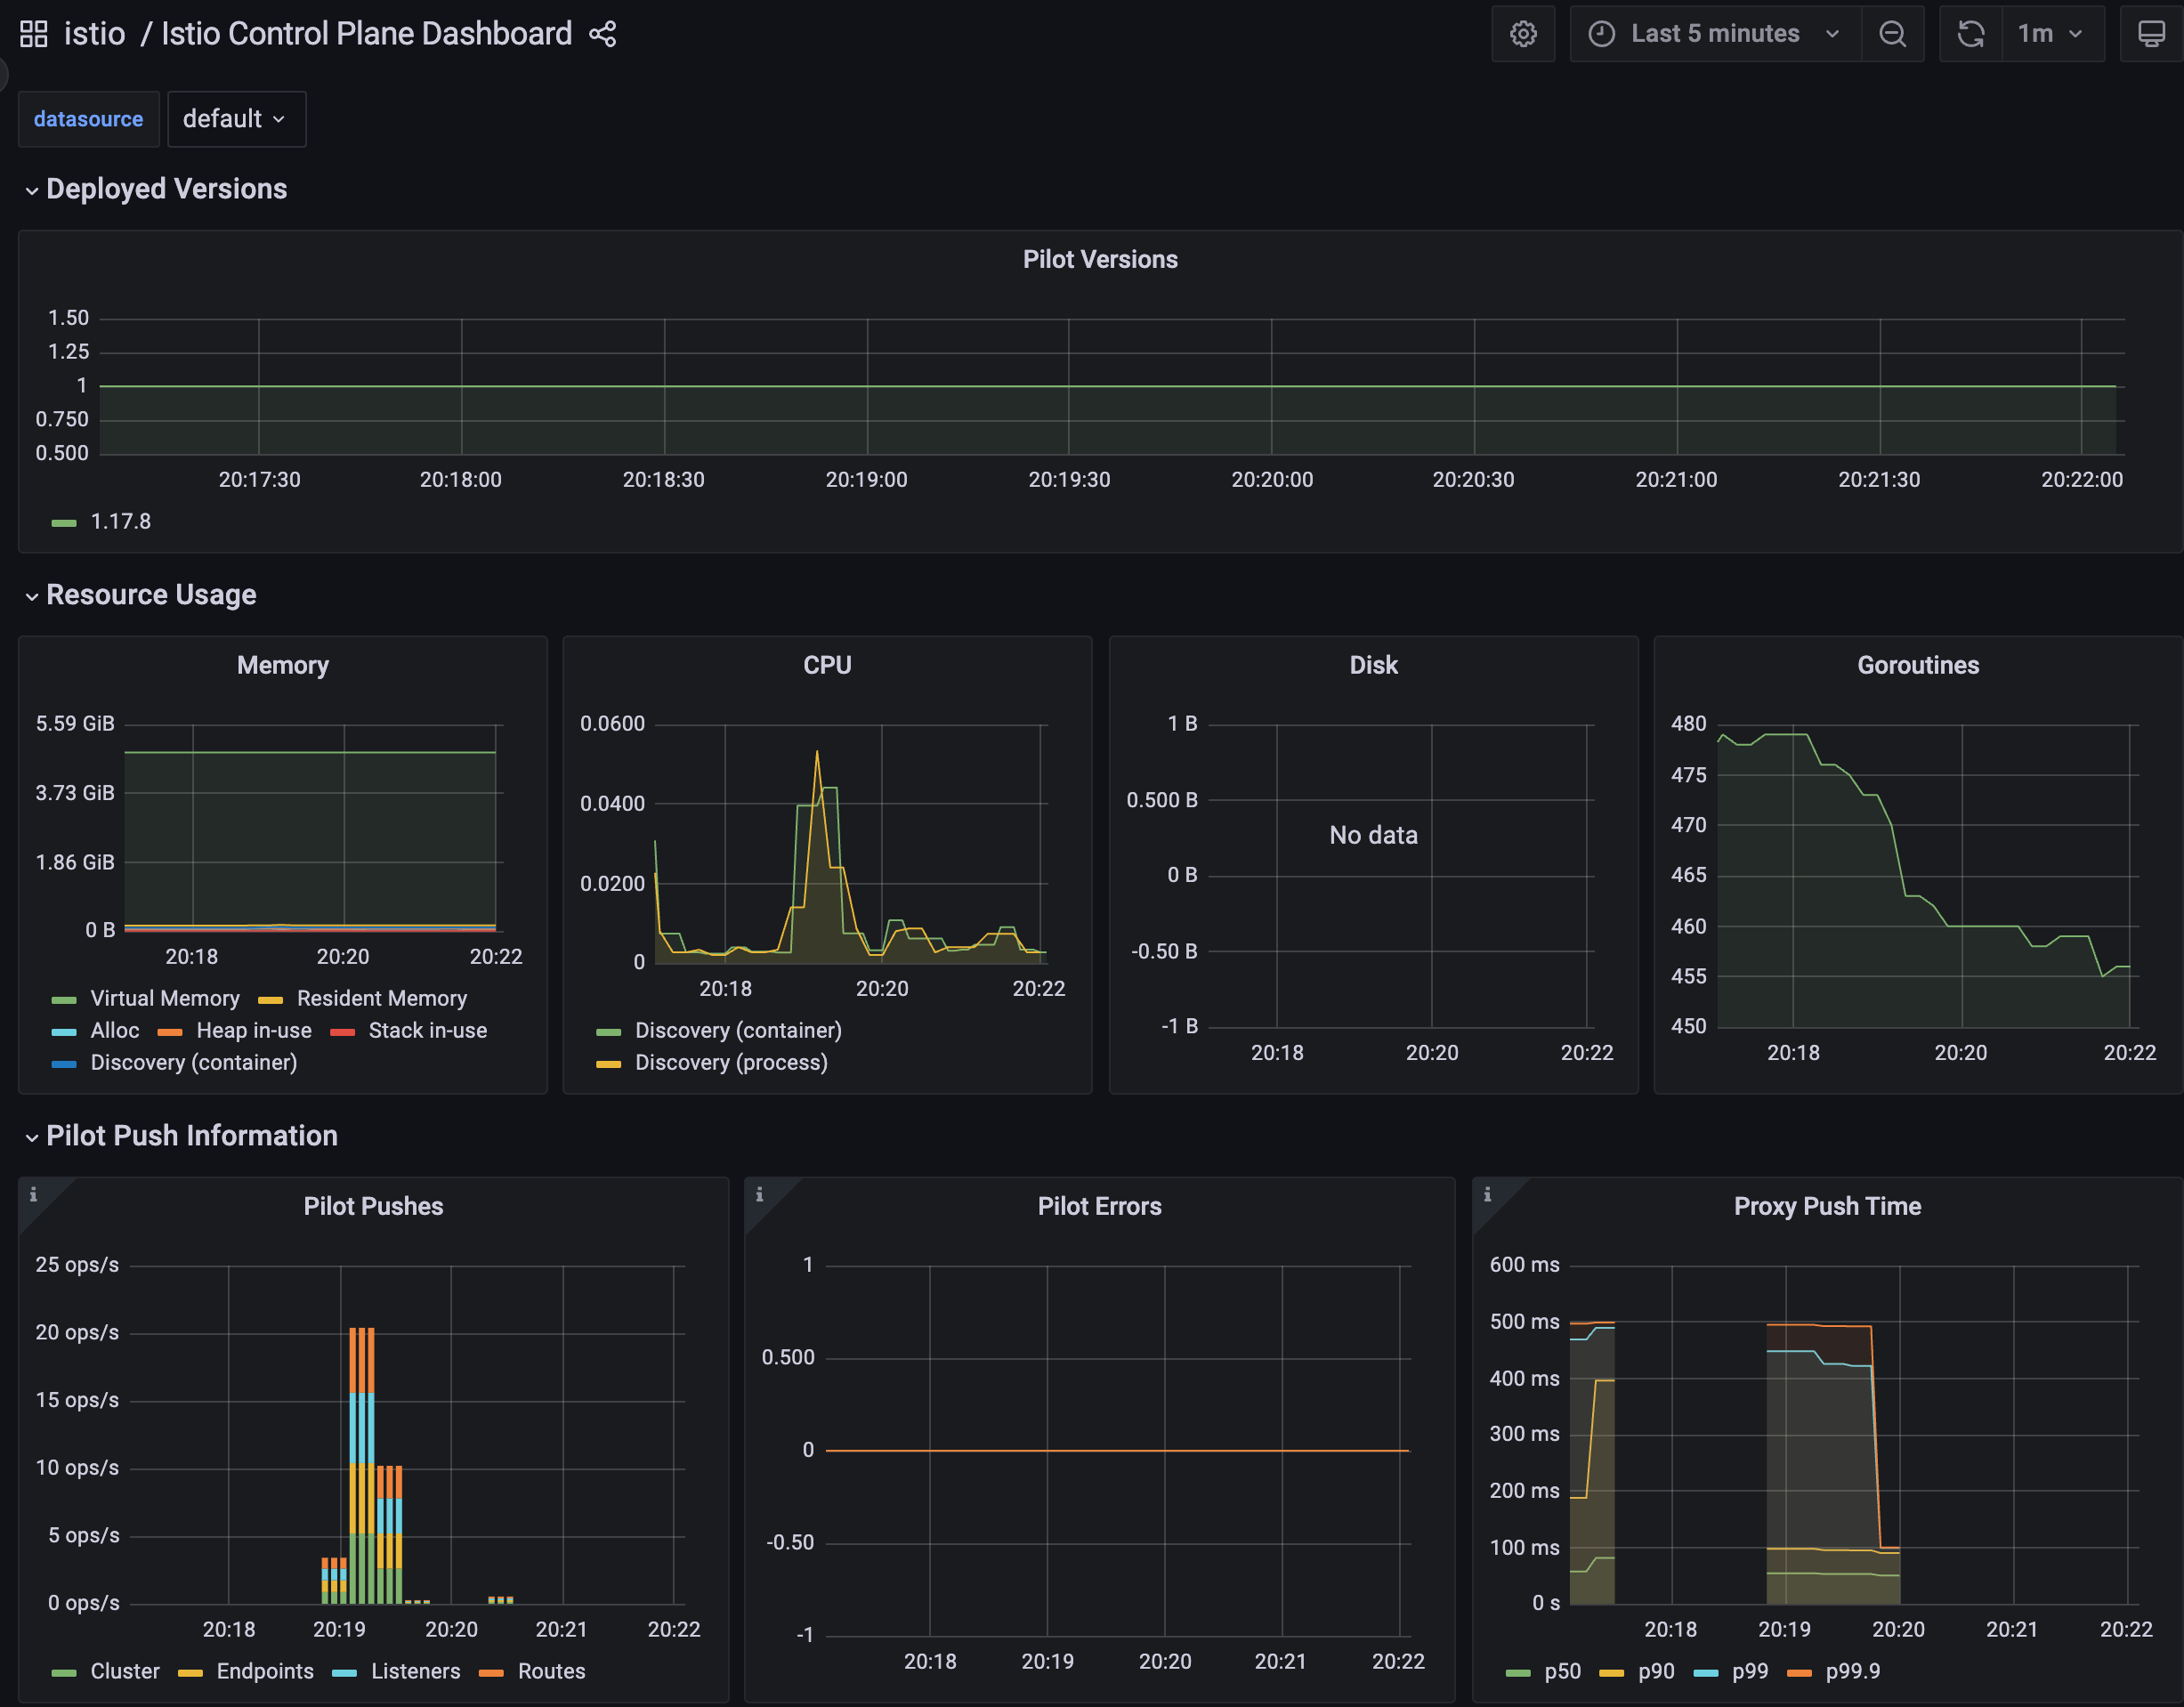
- 그래서 이제 istiod 인스턴스 하나가 인그레스 및 이그레스 게이트웨이를 포함해 워크로드(istio-proxy 동작)를 13개 관리하며, 서비스는 총 600개(svc + vs + gw) 인지하고 있다.
- 서비스 개수는 엔보이 설정을 만드는 데 필요한 처리량을 늘리고, 워크로드로 보내야 하는 설정을 부풀린다.
3.4.3 최적화 전 성능 측정하기
- 들어가며 : 테스트 실행
- 이제 테스트로 컨트롤 플레인 성능을 판단할 것이다.
- 테스트는 서비스를 반복적으로 만들어 부하를 생성하고, 프록시에 설정을 업데이트하는 데 걸리는 지연 시간과 P99 값과 푸시 개수를 측정한다.
P99 이해하기
- P99(또는 percentile 백분위 99)는 업데이트 전파 중 가장 빠른 99%의 최대 지연 시간을 측정한다.
- 예를 들어 ‘P99 지연 시간이 80ms이다’는 요청 중 99%가 80ms 보다 빠르게 전파됐음을 말한다!
- 각 요청이 정확히 어떻게 분포하는지는 알지 못하며, 대부분은 수 ms 범위일 수 있다.
- 그러나 가장 빠른 99%만을 고려할 때 가장 느린 요청도 80ms안에 처리됐음을 알 수 있다.
✅ (첫 번째) 테스트를 10회 반복하되, 반복 사이에 2.5초 간격을 두자.
✅ 이는 변경을 흩뿌려 배치 처리되는 상황을 피하려는 것이다
- bin/performance-test.sh : 파일 수정 해두기! $GATEWAY:30000/items
#!/bin/bash

main(){
  ## Pass input args for initialization
  init_args "$@"

  SLEEP_POD=$(kubectl -n istioinaction get pod -l app=sleep -o jsonpath={.items..metadata.name} -n istioinaction | cut -d ' ' -f 1)

  PRE_PUSHES=$(kubectl exec -n istio-system deploy/istiod -- curl -s localhost:15014/metrics | grep pilot_xds_pushes | awk '{total += $2} END {print total}')

  if [[ -z "$PRE_PUSHES" ]]; then
    echo "Failed to query Pilot Pushes from prometheus."
    echo "Have you installed prometheus as shown in chapter 7?"
    exit 1
  fi

  echo "Pre Pushes: $PRE_PUSHES"

  INDEX="0"
  while [[ $INDEX -lt $REPS ]]; do
    SERVICE_NAME="service-`openssl rand -hex 2`-$INDEX"

    create_random_resource $SERVICE_NAME &
    sleep $DELAY
    INDEX=$[$INDEX+1]
  done

  ## Wait until the last item is distributed
  while [[ "$(curl --max-time 0.5 -s -o /dev/null -H "Host: $SERVICE_NAME.istioinaction.io" -w ''%{http_code}'' $GATEWAY:30000/items)" != "200" ]]; do
    # curl --max-time 0.5 -s -o /dev/null -H "Host: $SERVICE_NAME.istioinaction.io" $GATEWAY/items
    sleep .2
  done

  echo ==============

  sleep 10

  POST_PUSHES=$(kubectl exec -n istio-system deploy/istiod -- curl -s localhost:15014/metrics | grep pilot_xds_pushes | awk '{total += $2} END {print total}')

  echo

  LATENCY=$(kubectl -n istioinaction exec -it $SLEEP_POD -c sleep -- curl "$PROM_URL/api/v1/query" --data-urlencode "query=histogram_quantile(0.99, sum(rate(pilot_proxy_convergence_time_bucket[1m])) by (le))" | jq  '.. |."value"? | select(. != null) | .[1]' -r)

  echo "Push count:" `expr $POST_PUSHES - $PRE_PUSHES`
  echo "Latency in the last minute: `printf "%.2f\n" $LATENCY` seconds"
}

create_random_resource() {
  SERVICE_NAME=$1
  cat <<EOF | kubectl apply -f -
---
kind: Gateway
apiVersion: networking.istio.io/v1alpha3
metadata:
  name: $SERVICE_NAME
  namespace: $NAMESPACE
spec:
  servers:
    - hosts:
        - "$SERVICE_NAME.istioinaction.io"
      port:
        name: http
        number: 80
        protocol: HTTP
  selector:
    istio: ingressgateway
---
apiVersion: v1
kind: Service
metadata:
  labels:
    app: catalog
  name: $SERVICE_NAME
  namespace: $NAMESPACE
spec:
  ports:
  - name: http
    port: 80
    protocol: TCP
    targetPort: 3000
  selector:
    app: catalog
---
apiVersion: networking.istio.io/v1alpha3
kind: VirtualService
metadata:
  name: $SERVICE_NAME
  namespace: $NAMESPACE
spec:
  hosts:
  - "$SERVICE_NAME.istioinaction.io"
  gateways:
  - "$SERVICE_NAME"
  http:
  - route:
    - destination:
        host: $SERVICE_NAME.istioinaction.svc.cluster.local
        port:
          number: 80
---
EOF
}

help() {
    cat <<EOF
Poor Man's Performance Test creates Services, Gateways and VirtualServices and measures Latency and Push Count needed to distribute the updates to the data plane.
       --reps         The number of services that will be created. E.g. --reps 20 creates services [0..19]. Default '20'
       --delay        The time to wait prior to proceeding with another repetition. Default '0'
       --gateway      URL of the ingress gateway. Defaults to 'localhost'
       --namespace    Namespace in which to create the resources. Default 'istioinaction'
       --prom-url     Prometheus URL to query metrics. Defaults to 'prom-kube-prometheus-stack-prometheus.prometheus:9090'
EOF
    exit 1
}

init_args() {
  while [[ $# -gt 0 ]]; do
      case ${1} in
          --reps)
              REPS="$2"
              shift
              ;;
          --delay)
              DELAY="$2"
              shift
              ;;
          --gateway)
              GATEWAY="$2"
              shift
              ;;
          --namespace)
              NAMESPACE="$2"
              shift
              ;;
          --prom-url)
              PROM_URL="$2"
              shift
              ;;
          *)
              help
              ;;
      esac
      shift
  done

  [ -z "${REPS}" ] &&  REPS="20"
  [ -z "${DELAY}" ] &&  DELAY=0
  [ -z "${GATEWAY}" ] &&  GATEWAY=localhost
  [ -z "${NAMESPACE}" ] &&  NAMESPACE=istioinaction
  [ -z "${PROM_URL}" ] &&  PROM_URL="prom-kube-prometheus-stack-prometheus.prometheus.svc.cluster.local:9090"
}

main "$@"- 여러 개의 임의 서비스 리소스를 생성 → Istio의 xDS Push 횟수 증가량 측정, Prometheus에서 프록시 구성 수렴 시간(latency) 확인 ⇒ 최종적으로 Push 성능과 latency를 평가
# (참고) 호출
curl -H "Host: catalog.istioinaction.io" localhost:30000/items

# 확인
kubectl get svc -n istioinaction --no-headers=true | wc -l
kubectl get gw -n istioinaction --no-headers=true | wc -l
kubectl get vs -n istioinaction --no-headers=true | wc -l

# :30000 포트 정보 추가해둘것!
cat bin/performance-test.sh
...
Poor Man's Performance Test creates Services, Gateways and VirtualServices and measures Latency and Push Count needed to distribute the updates to the data plane.
       --reps         The number of services that will be created. E.g. --reps 20 creates services [0..19]. Default '20'
       --delay        The time to wait prior to proceeding with another repetition. Default '0'
       --gateway      URL of the ingress gateway. Defaults to 'localhost'
       --namespace    Namespace in which to create the resources. Default 'istioinaction'
       --prom-url     Prometheus URL to query metrics. Defaults to 'prom-kube-prometheus-stack-prometheus.prometheus:9090'
...

# 성능 테스트 스크립트 실행!
./bin/performance-test.sh --reps 10 --delay 2.5 --prom-url prometheus.istio-system.svc.cluster.local:9090
Pre Pushes: 335
...
gateway.networking.istio.io/service-00a9-9 created
service/service-00a9-9 created
virtualservice.networking.istio.io/service-00a9-9 created
==============

Push count: 514 # 변경 사항을 적용하기 위한 푸시 함수
Latency in the last minute: 0.43 seconds # 마지막 1분 동안의 지연 시간


# 확인
kubectl get svc -n istioinaction --no-headers=true | wc -l
242
kubectl get gw -n istioinaction --no-headers=true | wc -l
241
kubectl get vs -n istioinaction --no-headers=true | wc -l
241- 그라파나 : Last 5분
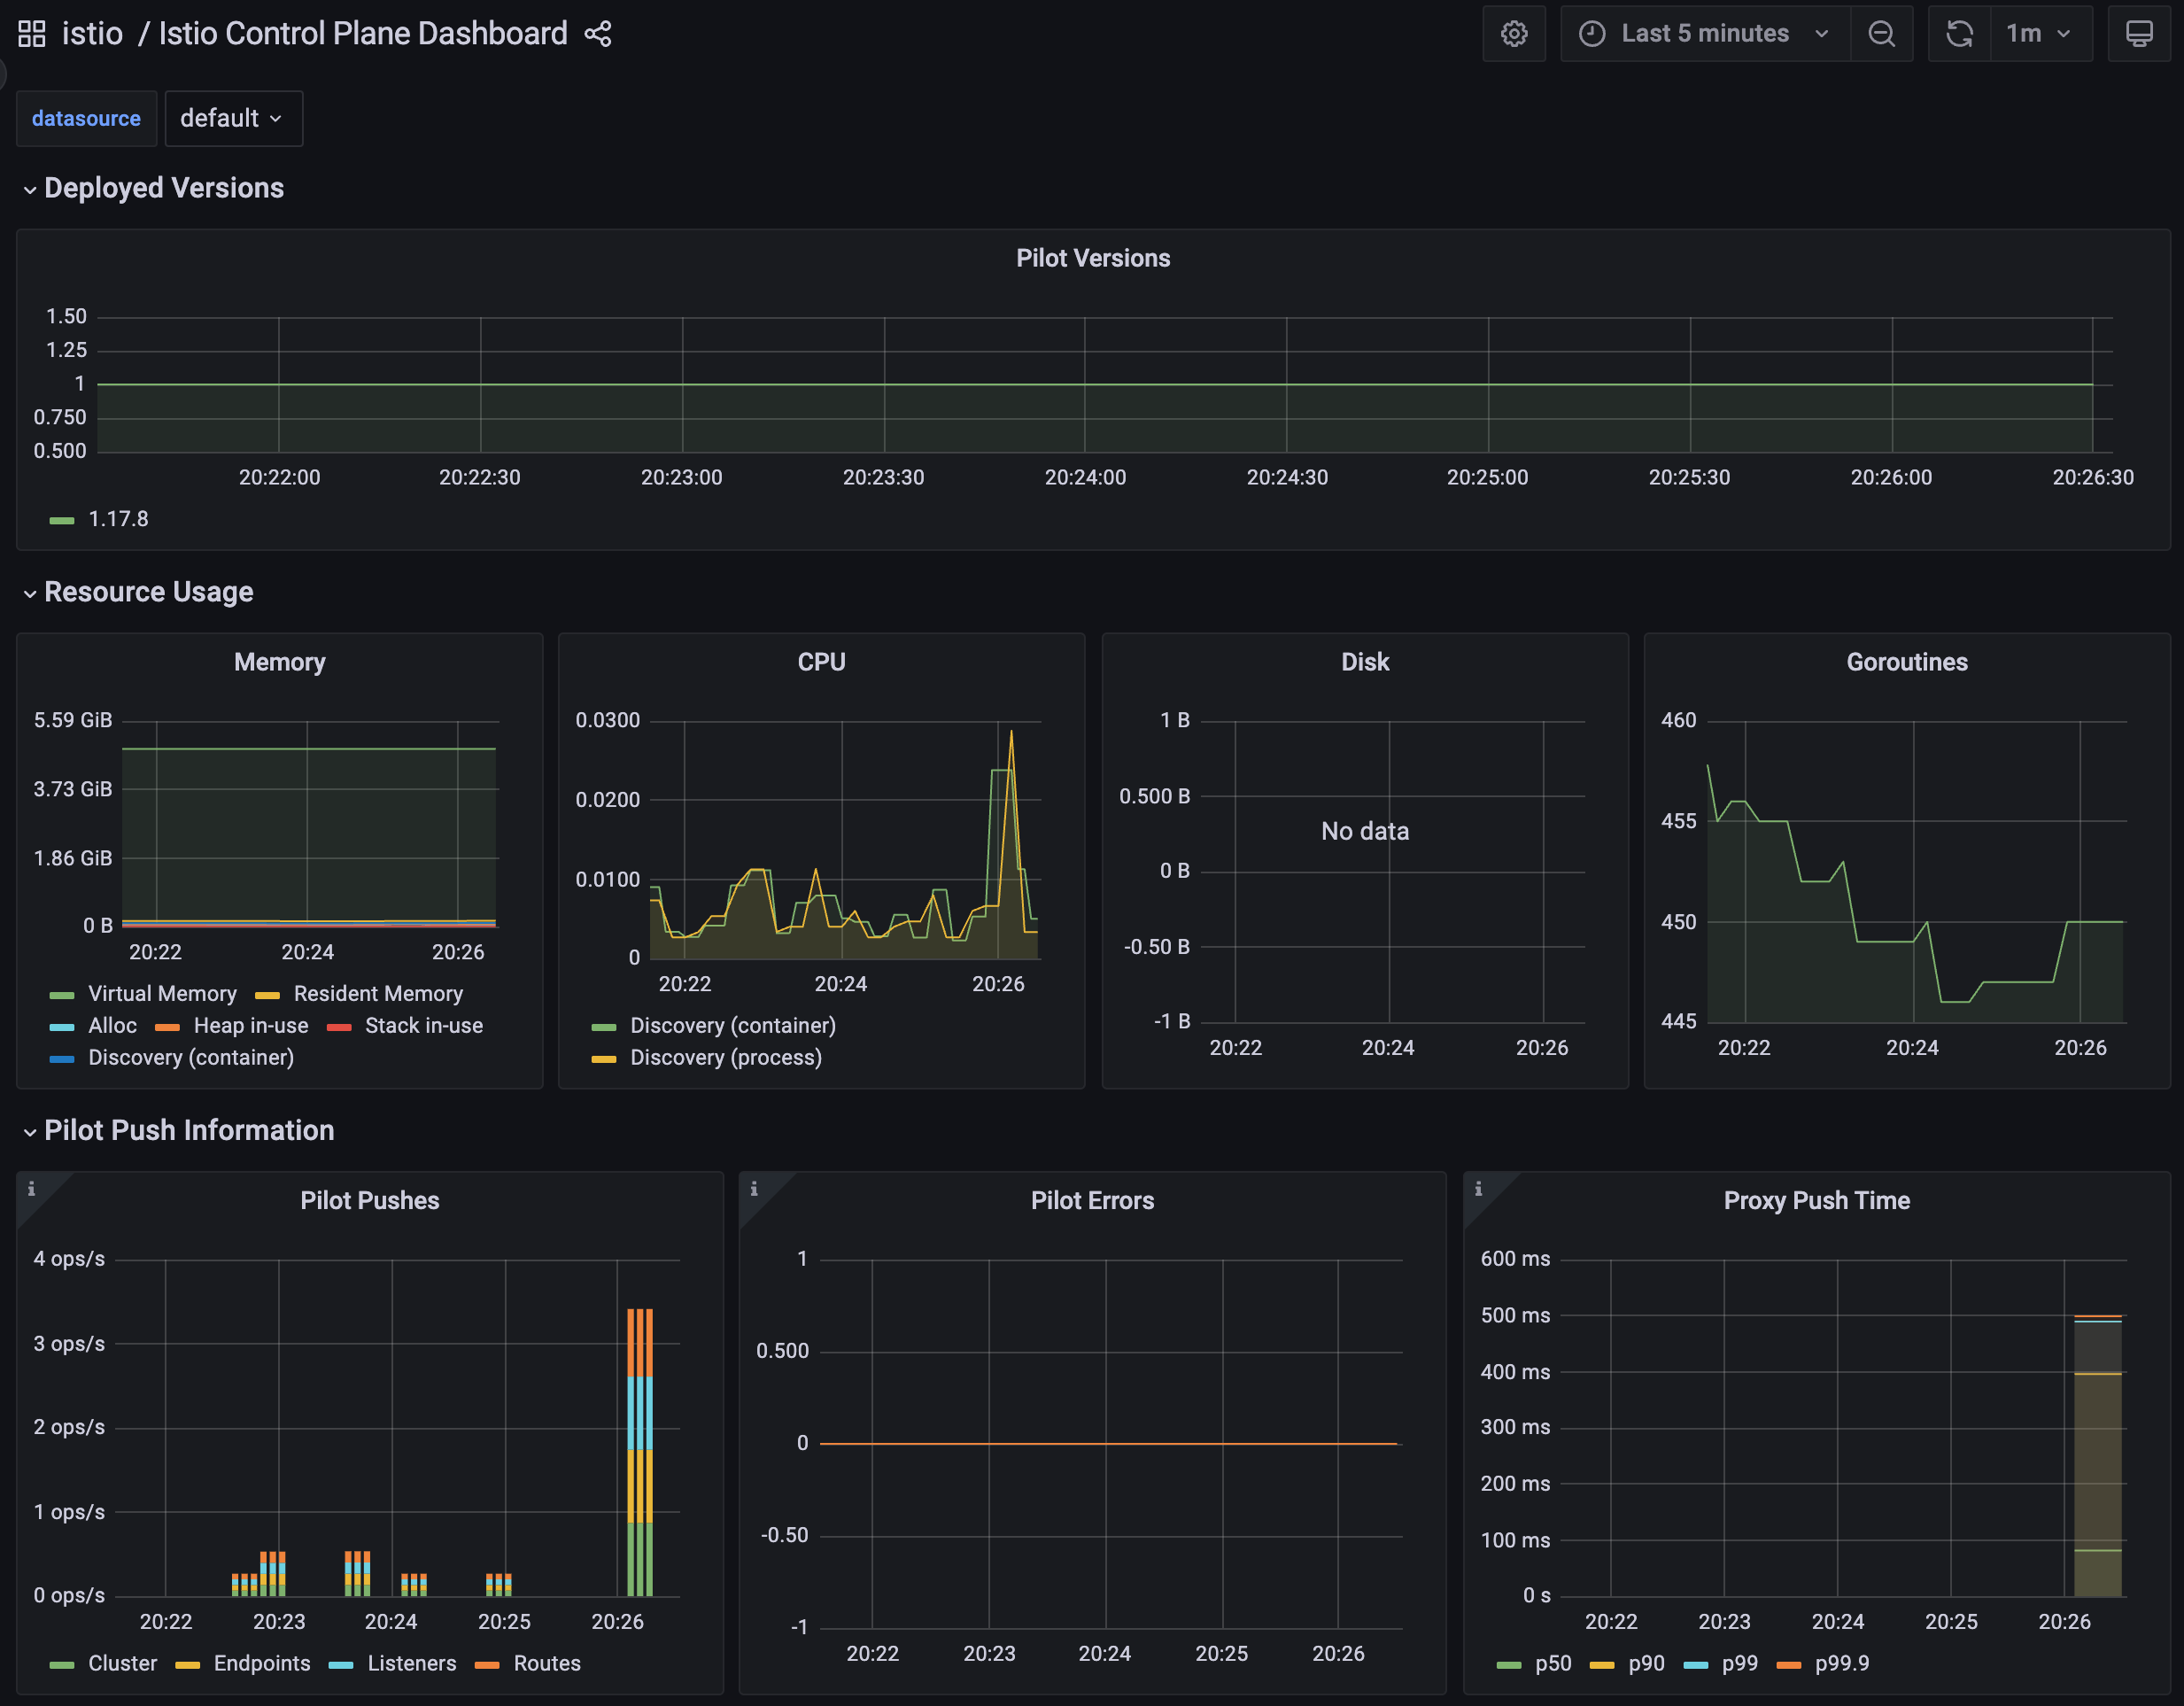
✅ (두 번째) 딜레이 없이 실행
# 성능 테스트 스크립트 실행 : 딜레이 없이
./bin/performance-test.sh --reps 10 --prom-url prometheus.istio-system.svc.cluster.local:9090
Push count: 51
Latency in the last minute: 0.47 seconds

# 확인
kubectl get svc -n istioinaction --no-headers=true | wc -l
kubectl get gw -n istioinaction --no-headers=true | wc -l
kubectl get vs -n istioinaction --no-headers=true | wc -l
✅ (세 번째) 딜레이 좀 더 늘려서 실행
# 성능 테스트 스크립트 실행 : 딜레이 없이
./bin/performance-test.sh --reps 10 --delay 5 --prom-url prometheus.istio-system.svc.cluster.local:9090
Push count: 510
Latency in the last minute: 0.43 seconds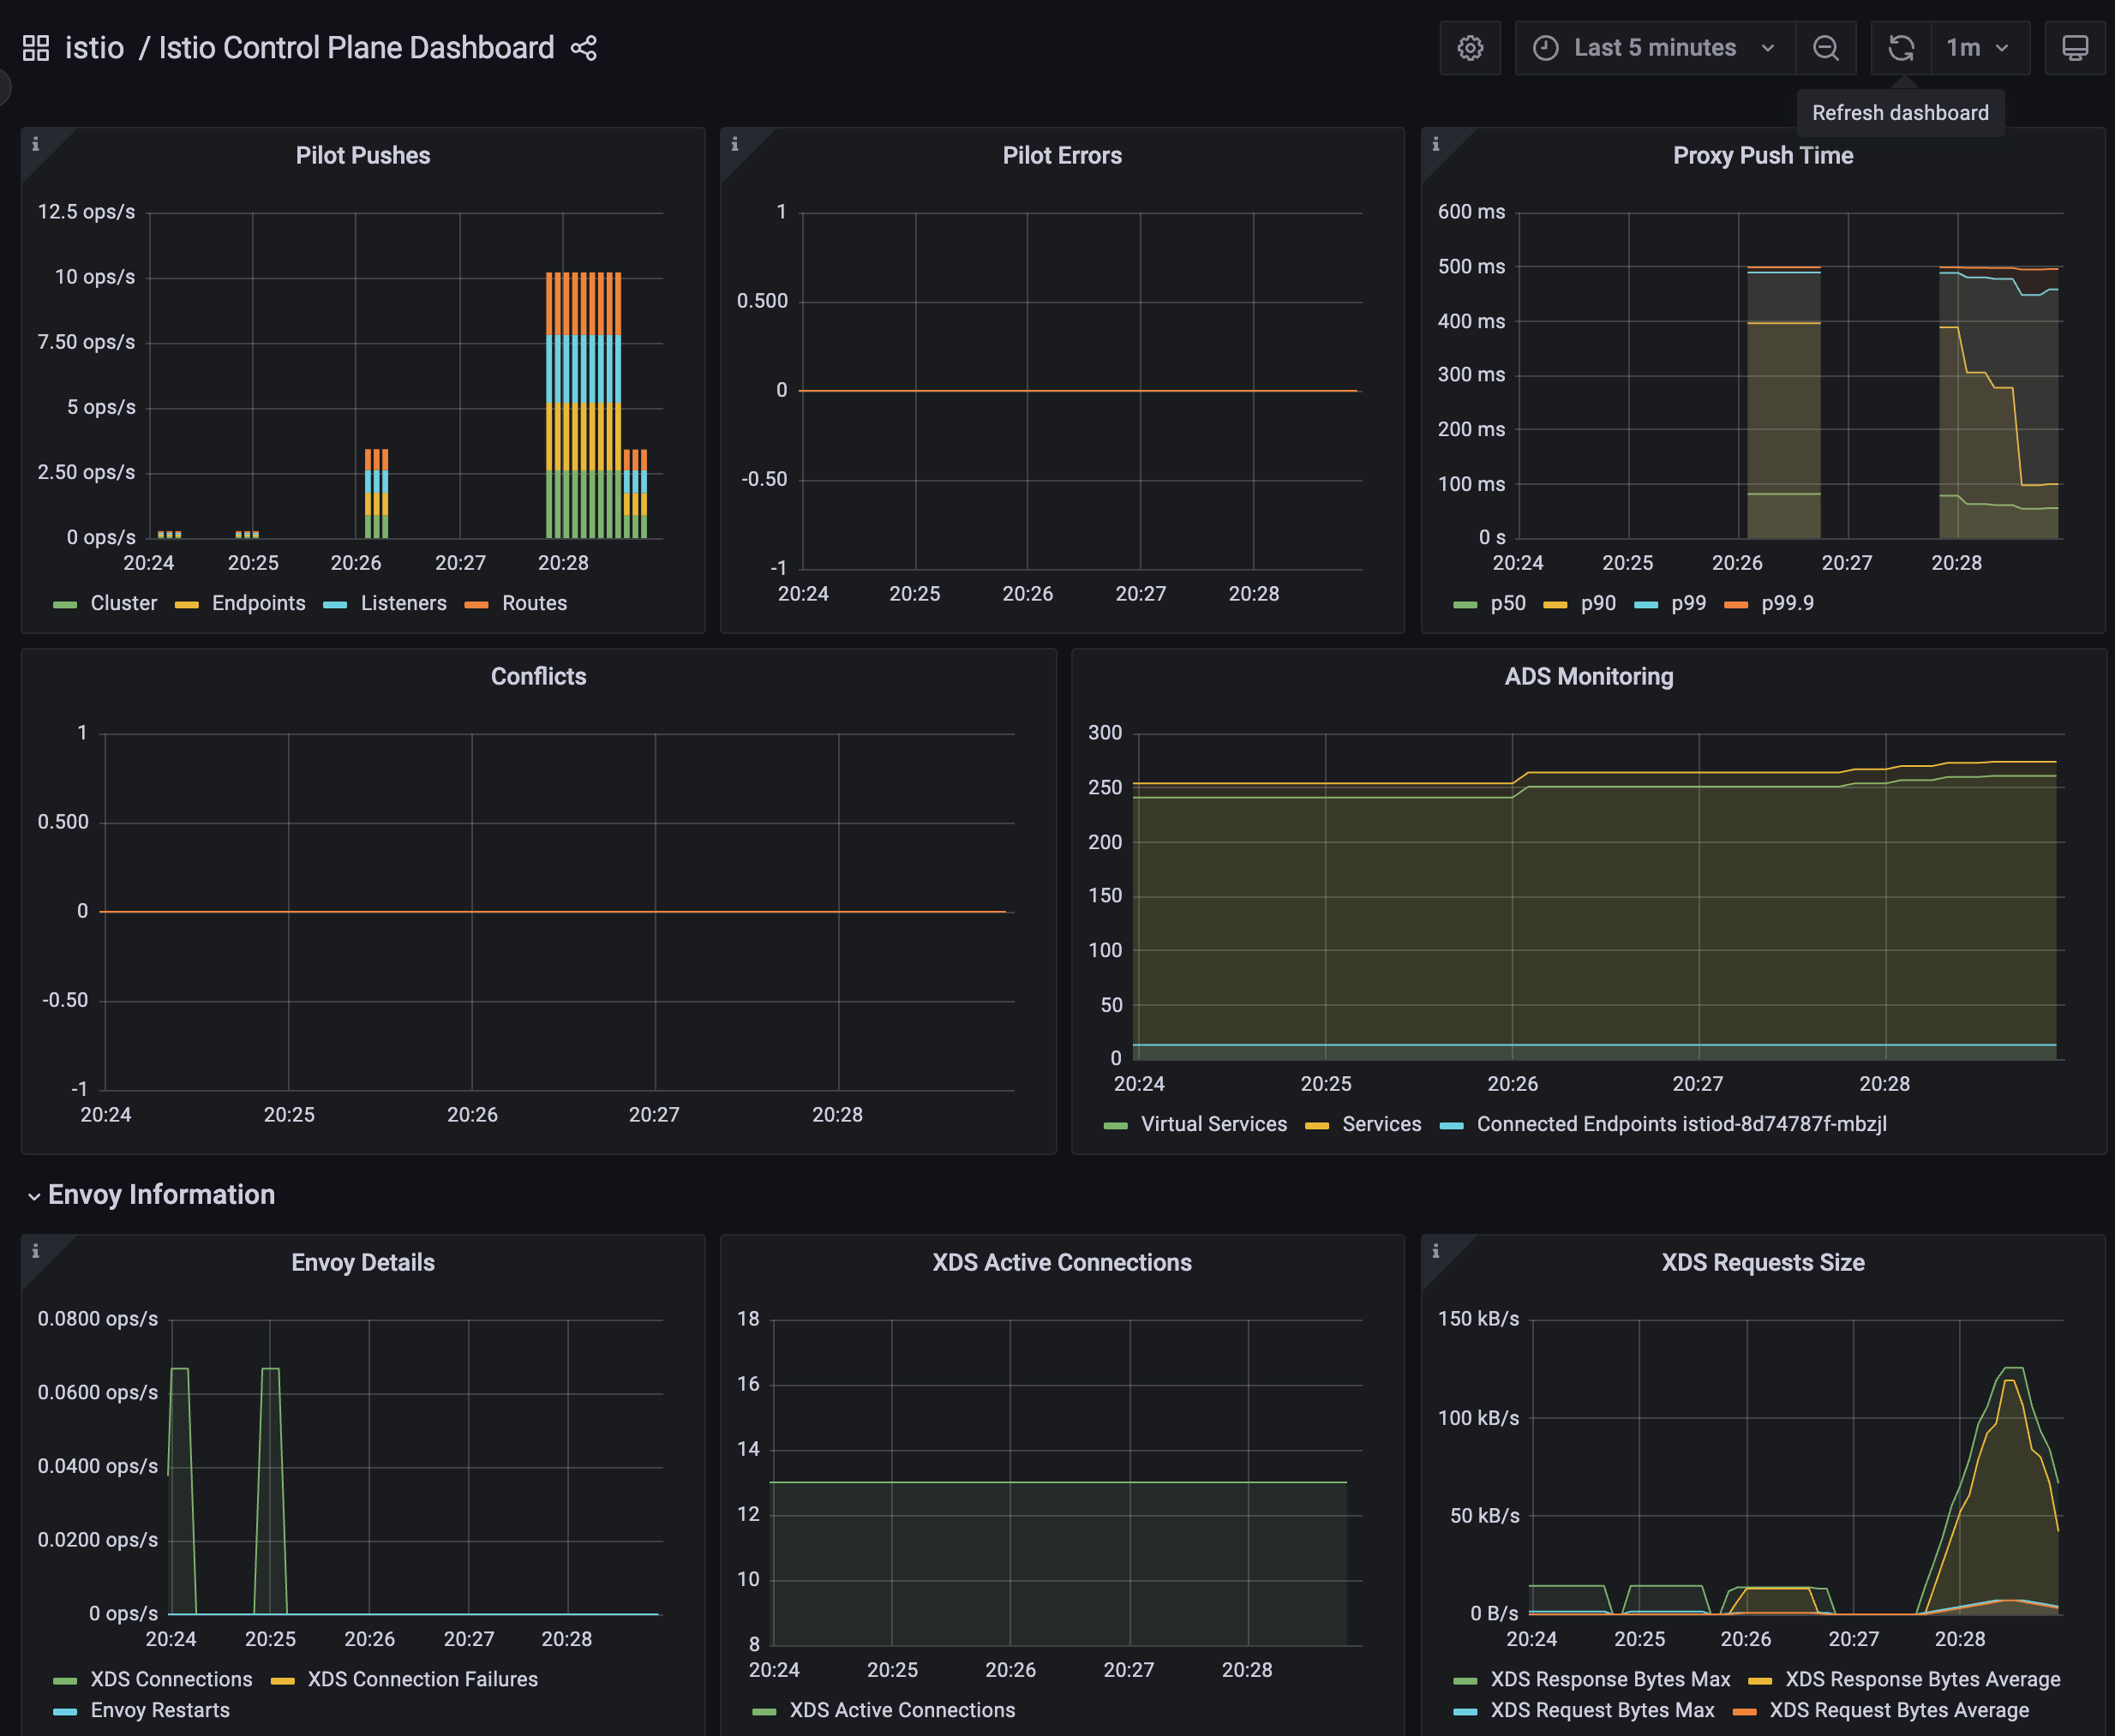
✅ 테스트 정리
- (첫 번째) 테스트에 따르면, 현재 설정으로는 510회의 푸시가 P99 지연 시간 0.45초로 수행됐다.
- (두 번째) 테스트에 따르면, 서비스 간의 간격을 없애면, 푸시 횟수와 지연 시간 모두 떨어지는 것을 볼 수 있다. 이는 이벤트가 배치 처리돼서 더 적은 작업량으로 처리되기 때문이다.
- 당신의 측정값은 다를 수 있지만, 괜찮다
- 이 테스트의 목표는 후속 절들에서 최적화를 실행한 후의 성능 향상을 검증할 수 있는 ‘충분히 좋은’ 측정을 하는 것이다.
▶️ 사이드카를 사용해 푸시 횟수 및 설정 크기 줄이기
▶️ Sidecar 리소스
▶️ 메시 범위 사이드카 설정으로 더 나은 기본값 정의하기
3.4.4 이벤트 무시하기
: 디스커버리 셀렉터로 디스커버리 범위 줄이기
- 이스티오 컨트롤 플레인이 기본적으로 K8S 모든 네임스페이스의 파드, 서비스와 기타 리소스의 생성 이벤트를 감지한다는 것은 놀라운 일이다!
- 대규모 클러스터에서 이런 동작은 컨트롤 플레인에 부담을 줄 수 있다.
- 데이터 플레인을 최신 상태로 유지하기 위해 모든 이벤트마다 엔보이 설정을 처리하고 생성하기 때문이다.
- 이런 부담을 줄이기 위해
Istio 1.10에는 네임스페이스 디스커비리 셀렉터 discovery selector 라는 기능이 새로이 추가돼 istiod 컨트롤 플레인이 감시할 이벤트를 세밀하게 조정할 수 있다. - 이 기능을 사용하면 워크로드와 엔드포인트를 감시할 네임스페이스를 명시적으로 지정할 수 있다.
- 네임스페이스 셀렉터 접근법을 사용하면 동적으로 네임스페이스와 해당 네임스페이스의 각 워크로드를 포함하거나, 메시에서 처리하지 않도록 제외할 수 있다.
- K8S 클러스터에 메시 내 워크로드가 절대 라우팅하지 않을 워크로드가 많거나, 계속 변하는 워크로드가 있는 경우(스파크 잡 spark job 이 계속 생성되고 종료되는 등) 특히 유용한다.
- 이 경우 컨트롤 플레인이 이 워크로드들에서 만들어지는 이벤트를 무시하게 만들고 싶을 것이다.
- 다음과 같이 IstioOperator 파일을 사용해 시작 시 디스커버리 설렉터 기능을 활성화할 수 있다.
- 컨트롤 플레인이 처리할 네임스페이스를 istio-discovery: enabled 레이블이 있는 것으로 한정한다. 네임스페이스에 이 레이블이 없으면 무시한다
apiVersion: install.istio.io/v1alpha1
kind: IstioOperator
metadata:
  namespace: istio-system
spec:
  meshConfig:
    discoverySelectors: # 디스커버리 셀렉터 활성화
      - matchLabels:
istio-discovery: enabled # 사용할 레이블 지정- 네임스페이스 대부분을 포함하고 소규모만 제외하려는 경우에는 레이블 비교 표현식을 사용해 어떤 네임스페이스를 포함하지 않을 수 있다.
apiVersion: install.istio.io/v1alpha1
kind: IstioOperator
metadata:
  namespace: istio-system
spec:
  meshConfig:
    discoverySelectors:
      - matchExpressions:
        - key: istio-exclude
          operator: NotIn
          values:
- "true"- 모든 항목을 살피는 기존 동작을 방해하지 않고 istio-exclude: true 레이블이 있는 네임스페이스만 제외하도록 다음과 같이 업데이트할 수 있다.
#
cat ch11/istio-discovery-selector.yaml
apiVersion: install.istio.io/v1alpha1
kind: IstioOperator
metadata:
  namespace: istio-system
spec:
  profile: demo
  meshConfig:
    discoverySelectors:
      - matchExpressions:
        - key: istio-exclude
          operator: NotIn
          values:
            - "true"
#
docker exec -it myk8s-control-plane cat /istiobook/ch11/istio-discovery-selector.yaml
docker exec -it myk8s-control-plane istioctl install -y -f /istiobook/ch11/istio-discovery-selector.yaml

#
kubectl get istiooperators.install.istio.io -A -o json
...
                "meshConfig": {
                    "accessLogEncoding": "JSON",
                    "accessLogFile": "/dev/stdout",
                    "defaultConfig": {
                        "proxyMetadata": {}
                    },
                    "discoverySelectors": [
                        {
                            "matchExpressions": [
                                {
                                    "key": "istio-exclude",
                                    "operator": "NotIn",
                                    "values": [
                                        "true"
...- 간단 실습 해보기
#
kubectl create ns new-ns
kubectl label namespace new-ns istio-injection=enabled
kubectl get ns --show-labels

# 테스트를 위해 샘플 nginx 배포
cat << EOF | kubectl apply -n new-ns -f -
apiVersion: apps/v1
kind: Deployment
metadata:
  name: nginx
  labels:
    app: nginx
spec:
  replicas: 1
  selector:
    matchLabels:
      app: nginx
  template:
    metadata:
      labels:
        app: nginx
    spec:
      containers:
      - name: nginx
        image: nginx:alpine
        ports:
        - containerPort: 80
---
apiVersion: v1
kind: Service
metadata:
  name: nginx
spec:
  selector:
    app: nginx
  ports:
  - protocol: TCP
    port: 80
    targetPort: 80
  type: ClusterIP
EOF

# 확인
kubectl get deploy,svc,pod -n new-ns
NAME                    READY   UP-TO-DATE   AVAILABLE   AGE
deployment.apps/nginx   1/1     1            1           26s

NAME            TYPE        CLUSTER-IP    EXTERNAL-IP   PORT(S)   AGE
service/nginx   ClusterIP   10.200.0.45   <none>        80/TCP    26s

NAME                       READY   STATUS    RESTARTS   AGE
pod/nginx-9fbb7d78-2m9zb   2/2     Running   0          26s

docker exec -it myk8s-control-plane istioctl proxy-config endpoint deploy/istio-ingressgateway.istio-system | grep nginx
10.10.0.24:80                                           HEALTHY     OK                outbound|80||nginx.new-ns.svc.cluster.local

# 설정
kubectl label ns new-ns istio-exclude=true
kubectl get ns --show-labels
NAME                 STATUS   AGE     LABELS
default              Active   3h42m   kubernetes.io/metadata.name=default
istio-system         Active   3h39m   kubernetes.io/metadata.name=istio-system
istioinaction        Active   3h38m   istio-injection=enabled,kubernetes.io/metadata.name=istioinaction
kube-node-lease      Active   3h42m   kubernetes.io/metadata.name=kube-node-lease
kube-public          Active   3h42m   kubernetes.io/metadata.name=kube-public
kube-system          Active   3h42m   kubernetes.io/metadata.name=kube-system
local-path-storage   Active   3h42m   kubernetes.io/metadata.name=local-path-storage
new-ns               Active   2m33s   istio-exclude=true,istio-injection=enabled,kubernetes.io/metadata.name=new-ns

# 다시 확인
docker exec -it myk8s-control-plane istioctl proxy-config endpoint deploy/istio-ingressgateway.istio-system | grep nginx- discoverySelectors를 사용해 디스커버리 범위를 관련 있는 네임스페이스로 줄였는데도 컨트롤 플레인이 여전히 포화 상태인 경우, 다음으로 고려해볼 방법은 각 이벤트를 개별적으로 해결하는 대신 이벤트를 배치 처리해 묶음으로 해결하는 것이다.
3.4.5 이벤트 배치 처리 및 푸시 스로틀링 속성
✅ 들어가며 : 디바운스 기반
- 데이터 플레인 설정을 바꾸는 런타임 환경 이벤트는 보통 운영자가 제어할 수 없는 것이다.
- 새로운 서비스가 온라인 상태가 되는 것, 복제본 스케일 아웃, 서비스가 비정상이 되는 것 같은 이벤트들은 모두 컨트롤 플레인이 감지해 데이터 플레인 프록시를 조정한다.
- 그래도 업데이트를 얼마나 지연해서 배치 처리할지 정도는 어느 정도 제어할 수 있다.
- 배치 처리하면, 이벤트를 한 묶음으로 처리함으로써 엔보이 설정을 한 번만 만들어 데이터 플레인 프록시로 한 번에 푸시할 수 있다는 이점이 있다.
- 그림 11.9의 순서도는 이벤트 수신이 서비스 프록시로 변경 사항을 푸시하는 작업을 어떻게 지연시키는지(디바운스)를 보여준다.
- 디바운스 기반을 더 늘리면, 지연 기간에서 제외됐던 마지막 이벤트도 배치에 포함시켜 모든 이벤트를 하나의 배치로 합침으로써 하나의 요청으로 푸시할 수 있게된다.
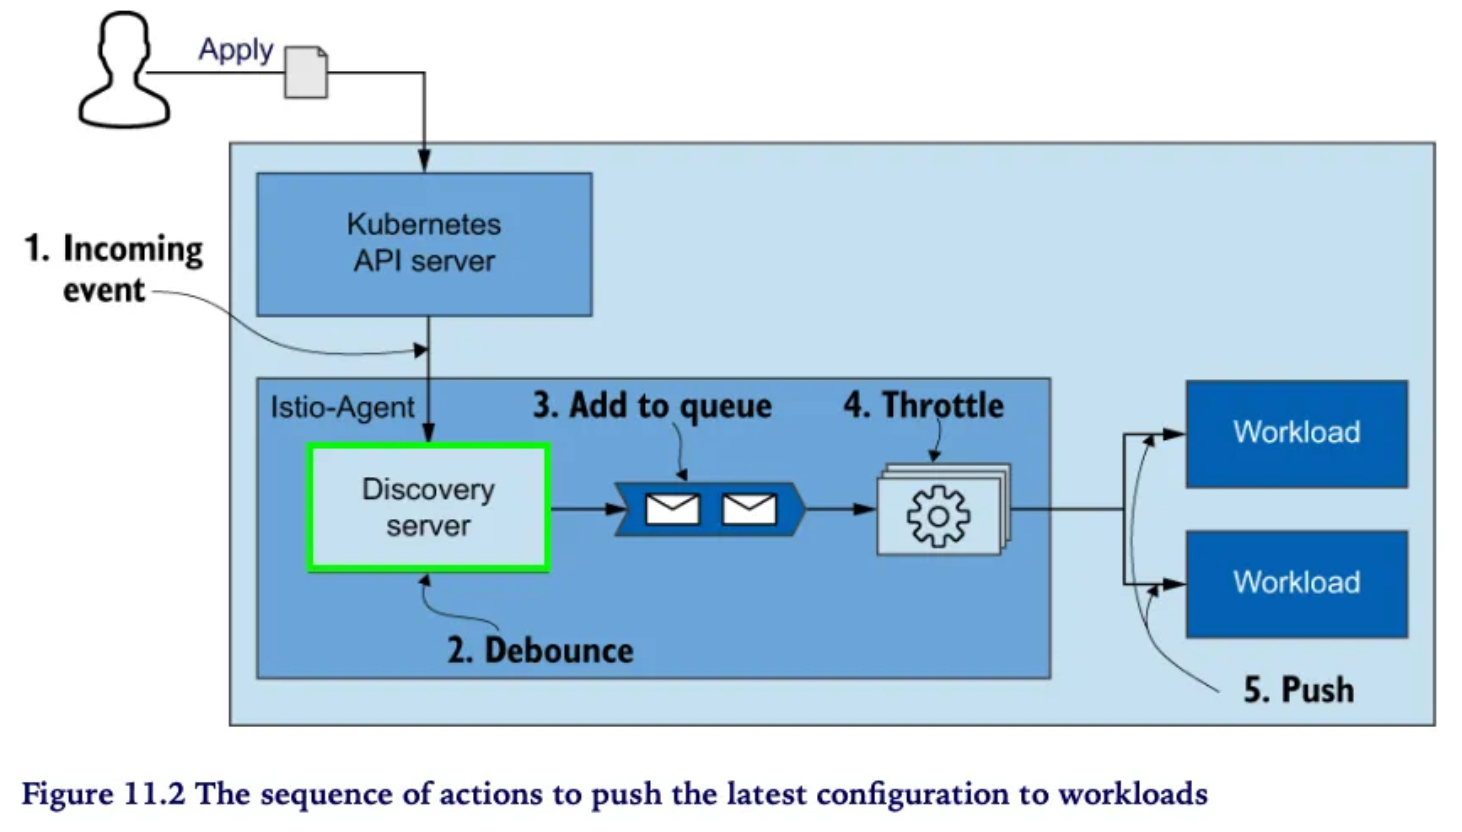
- 그러나 푸시를 너무 미루면 데이터 플레인 설정이 오래돼 최신 상태가 아니게 될 수 있는데, 상술한 것처럼 이런 상황 역시 원하는 바가 아니다.
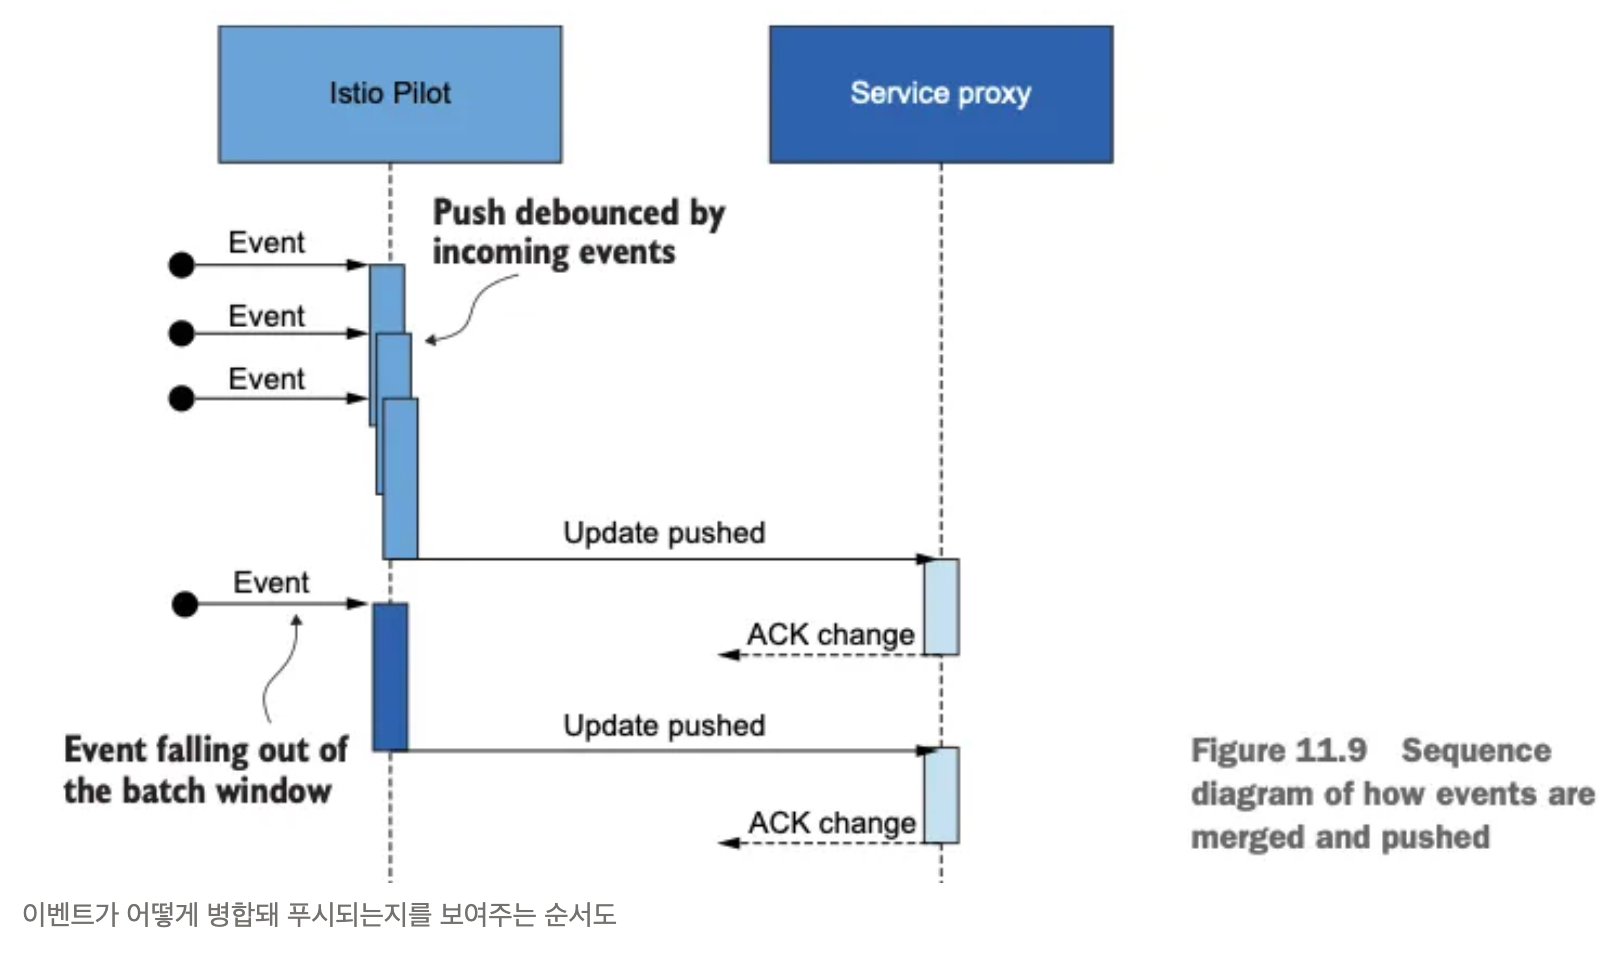
- 한편, 반대로 기간을 줄이면 업데이트가 더 빠르게 수행되는 것이 보장된다.
- 그러나 그렇게 하면 컨트롤 플레인이 미처 배포할 수 없을 정도로 푸시 요청이 많아진다.
- 이런 요청들은 푸시 대기열에서 스로틀링돼 대기 시간 증가로 이어지게 될 것이다.
✅ 배치 기간과 푸시 스로틀링을 정의하는 환경 변수
- 배치 기간을 정의하는 환경 변수는 다음과 같다 ****- Docs
- PILOT_DEBOUNCE_AFTER
- 이벤트를 푸시 대기열에 추가하는 디바운스할 시간을 지정한다. Specifies the time to debounce, adding an event to the push queue.
- 기본값은 100ms인데, 그 의미는 컨트롤 플레인이 이벤트를 받았을 때 푸시 대기열에 추가하는 행동을 100ms 디바운스한다는 것이다.
- 이 기간 동안에 추가로 발생하는 이벤트는 앞서 발생한 이벤트에 통합돼 작업이 다시 디바운스한다.
- 이 기간 동안 이벤트가 발생하지 않으면, 결과 배치가 푸시 대기열에 추가돼 처리할 준비가 된다.
- 예) 100ms (기본값) 이내에 새로운 이벤트가 없으면 queue에 추가하고, 있으면 merge 후 다시 100ms 동안 대기 + 단, 최대 PILOT_DEBOUNCE_MAX 이내에서 허용
- PILOT_DEBOUNCE_MAX
- 이벤트 디바운스를 허용할 최대 시간을 지정한다.
- 이 시간이 지나면 현재 병합된 이벤트가 푸시 대기열에 추가된다. 이 변수의 기본값은 10초다.
- PILOT_ENABLE_EDS_DEBOUNCE
- 엔드포인트 업데이트가 디바운스 규칙을 준수할지, 우선권을 줘 푸시 대기열에 즉시 배치할지를 지정한다.
- 이 변수의 기본값은 true이며, 엔드포인트 업데이트도 디바운스된다는 의미다.
- PILOT_PUSH_THROTTLE
- istiod가 동시에 처리하는 푸시 요청 개수를 지정한다.
- 이 변수의 기본값은 100개의 동시 푸시다. CPU 사용률이 낮은 경우, 스로틀 값을 높여서 업데이트를 더 빠르게 할 수 있다.
- PILOT_DEBOUNCE_AFTER
- 다음은 이런 설정 옵션을 사용할 때의 일반적인 지침 general guidance 이다.
- 컨트롤 플레인이 포화 상태이고 수신 트래픽이 성능 병목을 야기하는 경우 이벤트 배치 처리를 늘린다.
- 목표가 업데이트 전파를 더 빠르게 하는 것이면 이벤트 배치 처리를 줄이고 동시에 푸시하는 개수를 늘린다. 단, 이 방식은 컨트롤 플레인이 포화 상태가 아닐 때만 권장한다.
- 컨트롤 플레인이 포화 상태이고 송신 트래픽이 성능 병목인 경우 동시에 푸시하는 개수를 줄인다.
- 컨트롤 플레인이 포화 상태가 아니거나, 스케일 업을 했고 빠른 업데이트를 원하는 경우 동시에 푸시하는 개수를 늘린다.
✅ 배치 기간 늘리기
- 배치의 효과를 보여주기 위해 PILOT_DEBOUNCE_AFTER 값을 말도 안 되게 높은 값인 2.5초로 지정하자. (기본값은 100ms == 0.1초)
- 여기서 ‘말도 안 되게’라는 수식어는 운영 환경에서는 이렇게 하면 안된다는 것이다. 학습을 위한 실습용 설정임.
- PILOT_DEBOUNCE_MAX 로 정의한 한계값을 넘지 않는 한 모든 이벤트는 병합돼 푸시 큐에 더해지는데, 덕분에 푸시 횟수가 현저히 줄어들었다.
- 푸시 횟수가 겨우 28회로 줄었다!
- 엔보이 설정을 만들고 워크로드로 푸시하는 추가 작업을 모두 피해 CPU 사용률과 네트워크 대역폭 소모가 줄어든다.
# myk8s-control-plane 진입 후 설치 진행
docker exec -it myk8s-control-plane bash
-----------------------------------
# demo 프로파일 컨트롤 플레인 배포 시 적용
istioctl install --set profile=demo --set values.pilot.env.PILOT_DEBOUNCE_AFTER="2500ms" --set values.global.proxy.privileged=true --set meshConfig.accessLogEncoding=JSON -y
exit
-----------------------------------

#
kubectl get deploy/istiod -n istio-system -o yaml
...
        - name: PILOT_DEBOUNCE_AFTER
          value: 2500ms
...

# 성능 테스트 스크립트 실행!
./bin/performance-test.sh --reps 10 --delay 2.5 --prom-url prometheus.istio-system.svc.cluster.local:9090
Push count: 28 # 변경 사항을 적용하기 위한 푸시 함수
Latency in the last minute: 0.10 seconds # 마지막 1분 동안의 지연 시간- 이 예제는 이벤트 디바운스 효과를 설명하기 위한 것이지 일반적으로 사용할 수 있는 istiod 설정이 아니라는 점을 명심하자.
- 이스티오 컨트롤 플레인 설정은 관찰한 메트릭과 환경에 맞춰 조정할 것을 권장한다.
- 그리고 설정을 변경할 때는 컨트롤 플레인의 성능에 부정적인 영향을 줄 수 있는 큰 변화 대신에 조금씩 조절하는 것이 더 안전하다.
✅ 지연 시간 메트릭은 디바운스 기간을 고려하지 않는다!
- 디바운스 기간을 늘린 후 지연 시간 메트릭에 푸시 배포가 10ms 걸린 것으로 나타났지만, 사실은 그렇지 않다.
- 지연 시간 메트릭이 측정하는 기간은 푸시 요청이 푸시 대기열에 추가된 시점부터 시작됨을 기억하자.
- 즉, 이벤트들이 디바운드되는 동안 업데이트는 전달되지 않았다.
- 따라서 업데이트를 푸시하는 시간은 늘어났지만, 이는 지연 시간 메트릭에서는 나타나지 않는다!
- 이렇게 이벤트를 너무 오래 디바운스해 지연 시간이 늘어나면 성능이 낮을 때와 마찬가지로 설정이 낡게(오래되게) 된다.
- 따라서 배치 속성을 조정할 때는 한 번에 너무 크게 변경하는 것보다는 조금씩 변경하는 것이 좋다.
데이터 플레인은 보통 늦은 엔드포인트 업데이트에 영향을 받는다.
환경 변수 PILOT_ENABLE_EDS_DEBOUNCE를 false로 설정하면 엔드포인트 업데이트가 디바운스 기간을 건너뛰어 지연되지 않음을 보장할 수 있다.
✅ 컨트롤 플레인에 리소스 추가 할당하기
- Sidecar 리소스를 정의하고 discovery selectors를 사용하고 배치를 설정한 후, 성능을 향상 시킬 수 있는 유일한 방법은 컨트롤 플레인에 리소스를 더 할당하는 것이다.
- 리소스를 더 할당할 때는 istiod 인스턴스를 추가해 스케일 아웃하거나, 모든 istiod 인스턴스에 리소스를 추가로 제공해 스케일 업할 수 있다.
- 스케일 아웃을 할지 스케일 업을 할지는 성능 병목 원인에 따라 결정된다.
- 송신 트래픽이 병목일 때는 스케일 아웃하자.
- 이는 istiod 인스턴스당 관리하는 워크로드가 많을 때만 일어난다.
- 스케일 아웃은 istiod 인스턴스가 관리하는 워크로드 개수를 줄인다.
- 수신 트래픽이 병목일 때는 스케일 업하자.
- 이는 엔보이 설정을 생성하는 데 리소스(Service, VS, DR 등)을 많이 처리할 때만 일어난다.
- 스케일 업하면 istiod 인스턴스에 처리 능력을 더 제공한다.
- 송신 트래픽이 병목일 때는 스케일 아웃하자.
- 다음 명령으로 복제본 2 스케일 아웃과 리소스 스케일 업해보자
#
kubectl get pod -n istio-system -l app=istiod
istiod-55bfbd4574-stw9b   1/1     Running   0          9m9s

kubectl describe pod -n istio-system -l app=istiod
...
    Requests:
      cpu:      10m
      memory:   100Mi
...

kubectl resource-capacity -n istio-system -u -l app=istiod
NODE                  CPU REQUESTS   CPU LIMITS   CPU UTIL   MEMORY REQUESTS   MEMORY LIMITS   MEMORY UTIL
myk8s-control-plane   10m (0%)       0m (0%)      6m (0%)    100Mi (0%)        0Mi (0%)        73Mi (0%)

# myk8s-control-plane 진입 후 설치 진행
docker exec -it myk8s-control-plane bash
-----------------------------------
# demo 프로파일 컨트롤 플레인 배포 시 적용
istioctl install --set profile=demo \
--set values.pilot.resources.requests.cpu=1000m \
--set values.pilot.resources.requests.memory=1Gi \
--set values.pilot.replicaCount=2 -y

exit
-----------------------------------

#
kubectl get pod -n istio-system -l app=istiod
NAME                      READY   STATUS    RESTARTS   AGE
istiod-5485dd8c48-g99mk   1/1     Running   0          15s
istiod-5485dd8c48-hkxzx   1/1     Running   0          15s

NODE                  CPU REQUESTS   CPU LIMITS   CPU UTIL   MEMORY REQUESTS   MEMORY LIMITS   MEMORY UTIL
myk8s-control-plane   2000m (33%)    0m (0%)      7m (0%)    2048Mi (12%)      0Mi (0%)        127Mi (0%)

kubectl describe pod -n istio-system -l app=istiod
...
    Requests:
      cpu:      1
      memory:   1Gi
...- 컨트롤 플레인 성능 최적화의 요점은 다음과 같다.
- 항상 워크로드에 사이드카 설정을 정의하자. 이것만으로도 대부분의 이점을 얻을 수 있다.
- 컨트롤 플레인이 포화 상태인데 이미 리소스를 많이 할당한 경우에만 이벤트 배치를 수정하자.
- 병목이 송신 트래픽일 때 istiod 스케일 아웃하자.
- 병목이 수신 트래픽일 때 istiod 스케일 업하자.
✅ Istiod 디플로이먼트 오토스케일링
- 오토스케일링은 일반적으로 리소스 소모를 최적화할 수 있는 좋은 아이디어다. 이스티오 컨트롤 플레인과 같이 부하가 급증할 수 있는 워크로드의 경우에는 특히 그렇다.
- 그러나 현재로서는 istiod에 효과적이지 않은데, isiotd가 워크로드와 30분 커넥션을 시작하기 때문이다???. 이 커넥션은 ADS로 프록시를 설정하고 업데이트하는 데 사용하는 것이다.
- 따라서 새로이 생성된 istiod 복제본은 서비스 프록시와 종전 파일럿 사이의 커넥션이 만료될 때까지는 아무런 부하를 받지 않는다.
- 아무런 부하를 받지 않으니 새 istiod 복제본은 축소된다.
- 이로 인해 아래 그림과 같이 디플로이먼트가 반복적으로 확장됐다가 축소되는 퍼덕거림(flapping)이 일어나게 된다.
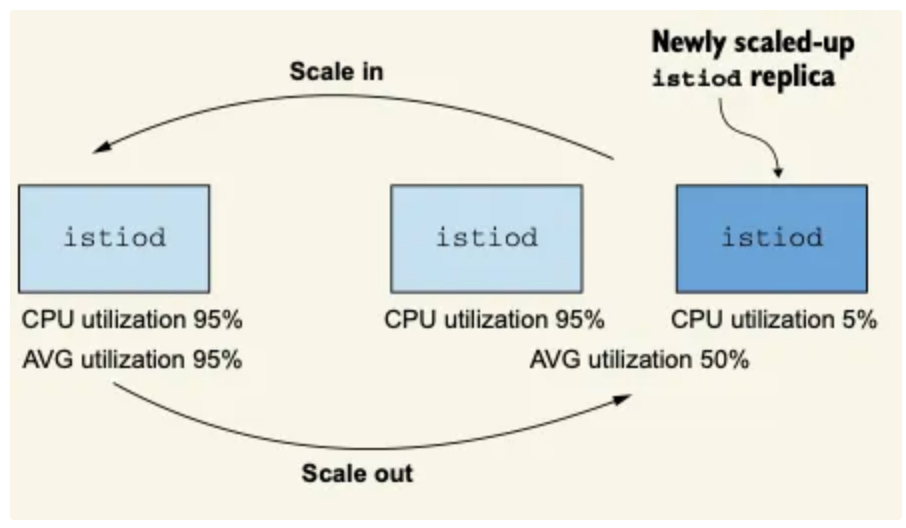
- 현재로서 오토스케일링을 구성하는 가장 좋은 방법은 점진적인 부하 증가에 맞추는 것이다.
- 며칠, 몇주, 심지어는 몇 달 단위에 걸쳐서 말이다.
- 이렇게 하면 성능을 지속적으로 모니터링하고 디폴리어먼트 스케일링 결정을 내려야 하는 인적 자원의 부담을 줄일 수 있다.
3.5 성능 튜닝 가이드라인
3.5.1 들어가기
- 성능을 튜닝하기 전에 이스티오는 성능이 정말 좋다는 것을 명심하자.
- 이스티오 팀은 다음과 같은 파라미터로 모든 릴리스를 테스트한다.
- 엔보이 설정을 부풀리는 쿠버네티스 서비스 1,000개
- 동기화해야 하는 워크로드 2,000개
- 서비스 메시 전체에서 초당 요청 70,000개
- 이 정도 부하로도 메시 전체를 동기화하는 이스티오 파일럿 인스턴스 하나가 겨우 가상 코어 하나와 메모리 1.5GB만을 사용한다.
- 대부분의 운영 환경 클러스터에는 복제본 셋에 vCPU 2개와 2GB 정도쯤되는 적당한 할당으로도 충분하다.
3.5.2 컨트롤 플레인 성능 튜닝 가이드라인
- 이것이 성능 문제인지 확인하자. 다음과 같은 질문에 답하자.
- 데이터 플레인에서 컨트롤 플레인으로 연결이 제대로 이뤄지고 있는가?
- 플랫폼 문제인가? 이를테면 쿠버네티스에서 API 서버가 정상인가?
- 변경 범위를 지정하도록 Sidecar 리소스를 정의했는가?
- 성능 병목 지점을 파악하자. 수집된 지연 시간, 포화도, 트래픽에 대한 메트릭을 사용해 튜닝 결정을 내리자.
- 컨트롤 플레인이 포화 상태도 아닌데 지연 시간이 증가하면 리소스가 최적으로 활용되지 않고 있다는 것을 나타낸다.
- 더 많은 푸시가 동시에 처리되도록 동시 푸시 임계값을 늘릴 수 있다.
- 사용률은 낮지만 부하가 걸렸을 때 빠르게 포화 상태가 되면 변경 사항이 매우 폭발적임을 나타낸다.
- 즉, 변경 사항이 없는 기간이 길다가 짧은 시간에 이벤트가 급증하는 것이다.
- 이스티오 파일럿의 복제본 수를 늘리거나, 업데이트를 미룰 여지가 있는 경우 배치 속성을 조정한다.
- 변경은 점진적으로 수행하자. 병목을 파악한 후 점진적으로 변경하자.
- 예를 들어, 컨트롤 플레인이 긴 시간 동안 계속해서 이벤트를 받는 경우에는 디바운스 기간을 두배, 심지어는 네 배로 늘리고 싶은 유혹이 있을 수 있다.
- 하지만 그렇게 하면 데이터 플레인이 낡기 쉽다. 대신 설정을 10~30% 범위에서 늘리거나 줄이는 등 조금만 바꾸자.
- 그런 다음, 며칠 동안 이점(또는 성능 저하)를 지켜보고 새로운 데이터를 바탕으로 결정을 내리자.
- 안전은 최우선으로 생각하자.
- 이스티오 파일럿은 메시 전체의 네트워크를 관리하므로, 다운타임은 중단으로 이어지기 십상이다.
- 컨트롤 플레인에 할당하는 리소스는 항상 관대하게 잡고, 복제본을 절대 2개 밑으로 내리지 말자.
- 또한 안전을 최우선으로 생각하자.
- 버스트 가능한 burstable 가상머신을 사용하는 것을 고려하자.
- 이스티오 파일럿은 CPU 리소스가 계속 필요하지 않으므로 버스트성 성능 요구 사항이 있다.
- 컨트롤 플레인이 포화 상태도 아닌데 지연 시간이 증가하면 리소스가 최적으로 활용되지 않고 있다는 것을 나타낸다.
3.5.3 Summary
- 컨트롤 플레인의 주요 목표는 데이터 플레인을 원하는 상태로 동기화하는 것이다.
- 이스티오 파일럿 성능에 영향을 주는 요소에는 변경 속도, 파일럿에 할당한 리소스양, 파일럿이 관리하는 워크로드 개수, 설정 크기가 있다.
- 기반 플랫폼에서 받는 변경 속도는 우리가 제어할 수 없다. 그러나 이벤트를 배치 처리할 기간을 정의해 데이터 플레인을 업데이트할 작업량을 줄일 수는 있다.
- istiod에는 리소스를 관대하게 할당하자. default 운영 환경 프로필은 좋은 출발점이다.
- 항상 sidecar 커스텀 리소스를 사용해 변경 범위를 지정하자. 그렇게 하면 다음과 같은 효과를 얻는다.
- 한 이벤트에서 업데이트하는 워크로드가 적어진다.
- 관련 설정만 보내기 때문에 엔보이 설정 크기가 줄어든다.
- discovery selectors 를 사용해 메시와 성관없는 네임스페이스의 이벤트는 무시하자.
- 컨트롤 플레인 튜닝 방법을 결정하는 데 그라파나의 Istio Control Plane 대시보드를 사용하자.