Istio Hands-on Study - 8주차 Enhancing Network Resilience with Istio on Amazon EKS
Istio Hands-on Study
가시다(gasida) 님이 진행하는 Istio Hands-on Study 1기 과정을 참여하여 정리한 글입니다.
8주차는 VM Support & Istio Traffic Flow 주제로 학습을 하였습니다.
별도 개인과제로 Enhancing Network Resilience with Istio on Amazon EKS 내용에 대해 실습 정리하고자 합니다.
💬 Istio로 구현하는 네트워크 복원력(Network Resilience)
🚀 이번 글은 “EKS에서의 Istio” 시리즈의 세 번째 블로그 포스트입니다.
이번 포스트에서는 Istio의 네트워크 복원력(Network Resilience) 기능을 본격적으로 살펴보고, 이를 Amazon Elastic Kubernetes Service(Amazon EKS) 환경에서 설정하고 구성하는 방법을 소개합니다.
🛠️ Istio는 마이크로서비스 간 통신이 예기치 못한 장애 상황에서도
✅ 응답성 유지
✅ 서비스 지속성 보장
✅ 시스템 전반의 안정성 향상이 가능하도록 다양한 기능을 제공합니다.
🔹 타임아웃 (Timeouts)
🔹 재시도 (Retries)
🔹 회로 차단기 (Circuit Breakers)
🔹 속도 제한 (Rate Limiting)
🔹 장애 주입 (Fault Injection)
이러한 Istio의 네트워크 복원력 기능은 애플리케이션이 원활하게 운영될 수 있도록 돕는 강력한 보호망 역할을 합니다. 이를 통해 ⏱️ 다운타임을 최소화하고, 🙌 사용자 경험을 극대화할 수 있습니다.
📚 이전 블로그 요약
1️⃣ Part 1 - Getting started with Istio on EKS
👉 Amazon EKS에서 Istio를 설치하고 구성하는 방법을 소개했습니다.
🚀 핵심적으로 다룬 내용은 다음과 같습니다:
- Istio Gateway
- Istio VirtualService
- Kiali와 Grafana를 활용한 관측성(Observability)
💡 이 글을 통해 여러분은 Istio의 기본 구성요소를 Amazon EKS 환경에 적용하는 법을 익히셨을 거예요
2️⃣ Part 2 - Using Istio Traffic Management on Amazon EKS to Enhance User Experience
🎯 마이크로서비스 간 통신에서 사용자 경험을 향상시키기 위한 트래픽 관리 전략을 소개했습니다.
다음과 같은 고급 전략들을 통해,
✅ 테스트 및 배포 전략의 정교화
✅ 다운타임 최소화
✅ 사용자 경험 극대화를 달성할 수 있는 방법을 다뤘습니다:
- Canary Deployment
- Blue/Green Deployment
- 트래픽 분할 및 라우팅 제어
이제 Part 3에서는 이러한 기반 위에 네트워크 복원력 기능을 추가하여,
탄탄하고 장애에 강한 마이크로서비스 환경을 구축하는 방법을 소개합니다.
함께 계속해서 Istio의 실전 운영 노하우를 쌓아봅시다! 💪✨
🛡️ Resilience란 무엇인가요?
Resilience(복원력)는 서비스 메시(Service Mesh)가 장애, 네트워크 중단, 혹은 성능 저하 같은 문제 상황에서도 📶 마이크로서비스 간 안정적이고 응답성 높은 통신을 유지하는 능력을 의미합니다.
Istio는 마이크로서비스 아키텍처 내에서 네트워크 복원력을 높이기 위해 다양한 기능과 메커니즘을 제공합니다:
⏱️ 타임아웃(Timeouts)
🔁 재시도(Retries)
🚫 회로 차단기(Circuit Breaking)
🧪 장애 주입(Fault Injection)
🚦 속도 제한(Rate Limiting)
이러한 기능들은 상호 보완적으로 작동하며, 마이크로서비스 간 통신의 신뢰성과 견고함을 보장합니다.
📌 Istio의 복원력 기능의 핵심 목표는 다음과 같습니다:
- 연쇄 장애(Cascading Failure) 방지
- 장애 허용 능력(Fault Tolerance) 향상
- 전반적인 시스템 성능 유지
결과적으로, 다양한 네트워크 장애 상황에서도 시스템이 멈추지 않고 유연하게 작동할 수 있도록 돕습니다.
다음으로 이 기능들을 EKS 환경에서 어떻게 설정하고 적용할 수 있는지 보여드릴 차례입니다.
계속해서 따라와 주세요!
🌐 Amazon EKS에서 Istio로 구현하는 네트워크 복원력(Network Resilience)
이번 블로그 파트에서는 Istio의 실전 네트워크 복원력 기능에 초점을 맞춥니다.
이 기능들은 국지적인 장애(localized failure)가 다른 노드로 확산되지 않도록 방지하며, 애플리케이션의 전반적인 신뢰성과 안정성을 유지하는 데 기여합니다.
🧪 Fault Injection (장애 주입)
- 의도적으로 오류를 주입하여 서비스 간 통신이나 장애 상황을 테스트할 수 있습니다.
- 이를 통해 실제 운영 환경에서 발생할 수 있는 다음과 같은 문제를 사전에 발견하고 해결할 수 있습니다:
- 네트워크 장애
- 하드웨어/소프트웨어 고장
- 사람의 실수 등
⏱️ Timeouts (타임아웃)
- 특정 작업이나 요청이 완료되기를 얼마나 기다릴지 설정할 수 있습니다.
- 지정한 시간 내에 완료되지 않으면 해당 요청은 실패로 간주됩니다.
- 이를 통해 무한 대기 상태나 리소스 낭비를 방지하고, 시스템의 복원력을 강화할 수 있습니다.
🔁 Retries (재시도)
- 요청이 실패했을 때, 자동으로 다시 시도하여
- 마이크로서비스 기반 애플리케이션의 가용성과 안정성을 높입니다.
- 단, 재시도는 설정에 따라 간격, 횟수, 조건을 유연하게 조정할 수 있습니다.
🚫 Circuit Breaker (회로 차단기)
- 특정 서비스가 반복적으로 실패할 경우, 더 이상 요청을 전달하지 않도록 차단합니다.
- 이는 실패한 서비스에 과부하가 발생하는 것을 방지하고
- 전체 시스템이 무너지는 것을 막는 우아한 실패(Graceful Degradation)를 실현합니다.
🚦 Rate Limiting (속도 제한)
- 서비스에 과도한 트래픽이 몰리지 않도록 사용량 제한 정책을 적용할 수 있습니다.
- 이를 통해 서비스 보호, 트래픽 폭주 대응, 자원 효율성 향상을 실현하며, 애플리케이션의 안정성과 가용성을 개선할 수 있습니다.
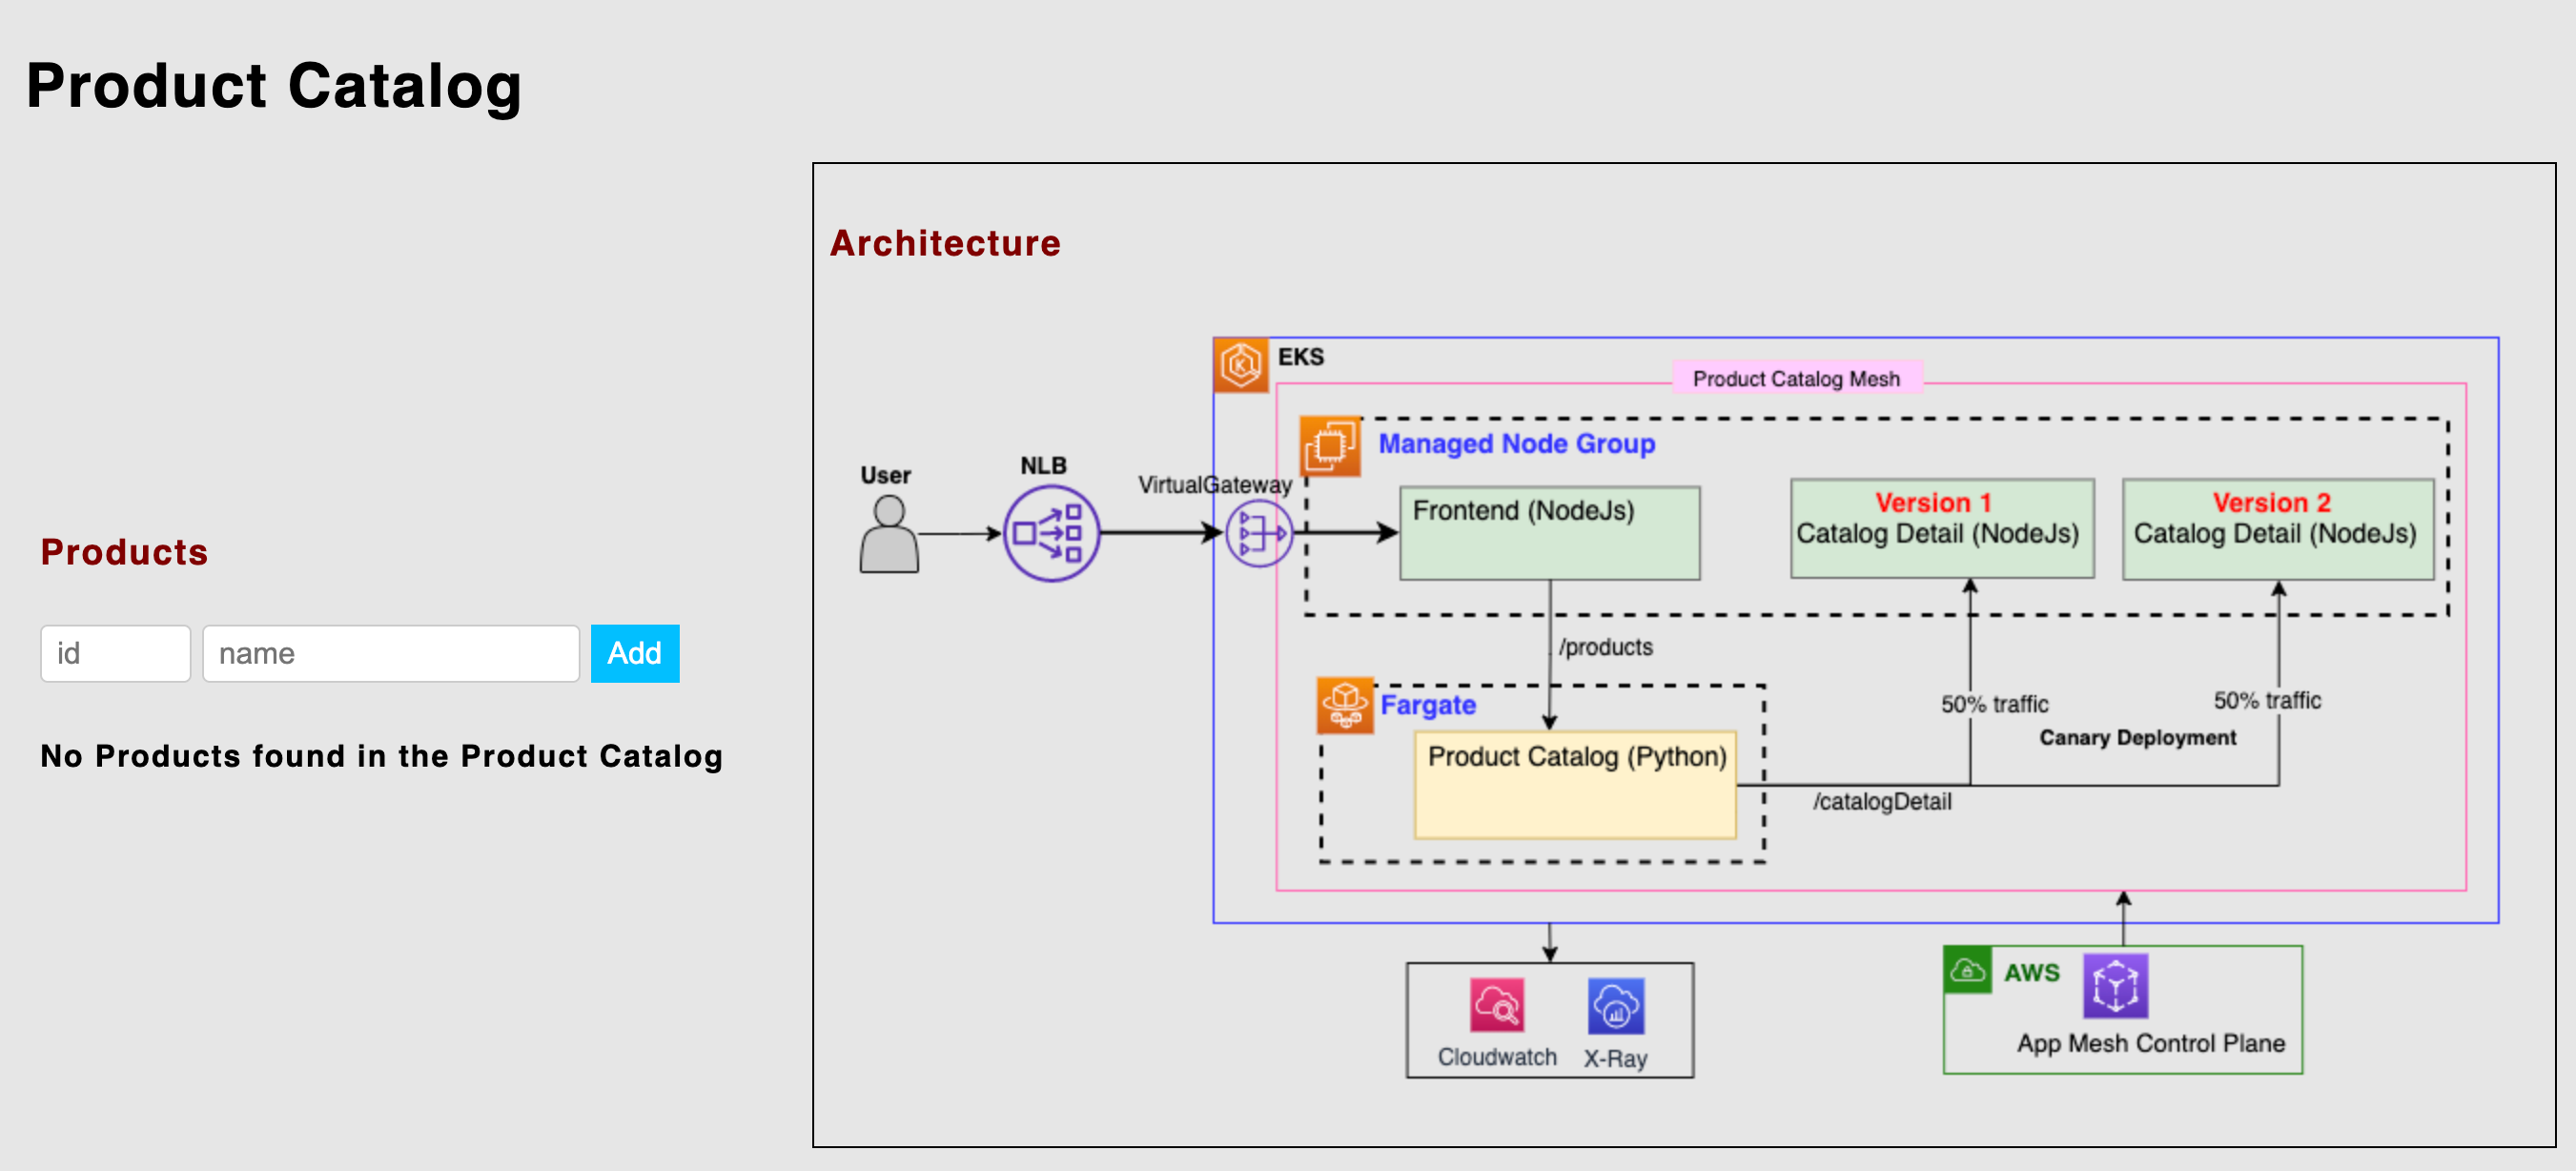
🏗️ 배포 아키텍처
이번 실습에서도 첫 번째 블로그 [Getting Started with Istio on EKS]에서 사용했던
마이크로서비스 기반의 상품 카탈로그(Product Catalog) 애플리케이션을 그대로 활용합니다.
이 애플리케이션은 Istio 기능을 직접 손으로 다뤄볼 수 있는 실습 환경 역할을 하며,
Istio의 다양한 네트워크 복원력 기능을 직관적으로 이해하고 테스트할 수 있도록 도와줍니다.
📦 애플리케이션 구성
이 상품 카탈로그 애플리케이션은 다음과 같은 3가지 마이크로서비스로 구성되어 있습니다:
- 🖥️ Frontend: 사용자 요청을 받아 처리하는 UI 레이어
- 📚 Product Catalog: 상품 리스트 및 메타데이터 제공
- 🔍 Catalog Detail: 특정 상품의 상세 정보를 제공
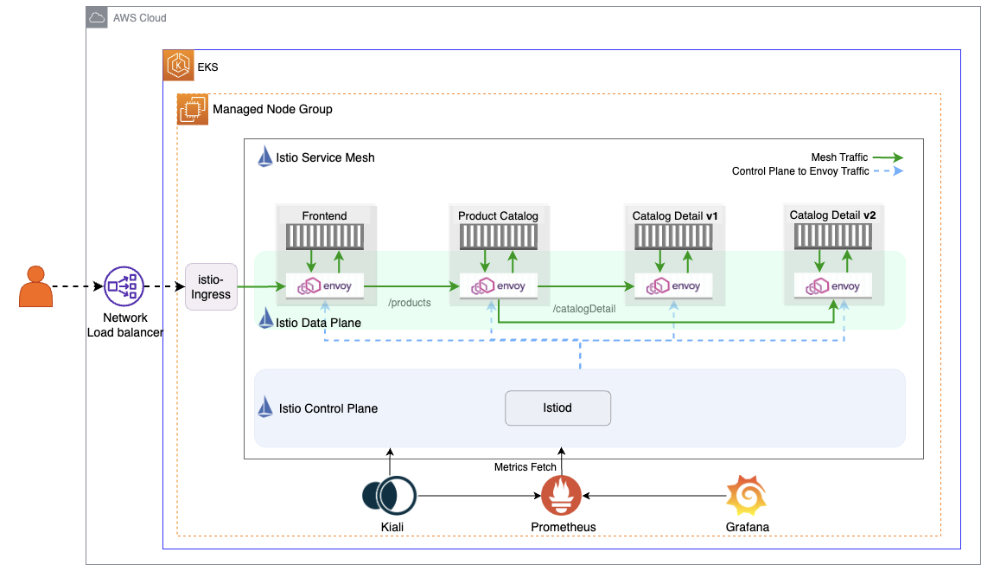
이 구성은 다음 다이어그램에 나타난 Istio 데이터 플레인 구조를 따르고 있습니다.
각 서비스는 Istio 사이드카 프록시(Envoy)를 통해 통신하며,
여기서 우리는 타임아웃, 재시도, 회로 차단기, 장애 주입, 속도 제한 등을 실험해볼 수 있습니다.
다음 섹션에서는 이 마이크로서비스 앱을 기반으로 Istio 리소스를 구성하는 YAML 예제와 함께 실습을 진행합니다.
⚙️ 사전 준비사항 및 초기 설정
본격적으로 실습을 진행하기에 앞서, 필요한 도구들이 제대로 설치되어 있는지 확인해야 합니다.
이 과정을 완료하면, 여러분은 다음과 같은 구성을 갖추게 됩니다:
- ☸️ Amazon EKS 클러스터
- 🧩 Istio 설치 완료
- 🛒 샘플 마이크로서비스 애플리케이션 배포 완료
먼저, 이번 블로그에서 사용할 예제 코드가 포함된 Git 리포지토리를 클론합니다:
❯ git clone https://github.com/aws-samples/istio-on-eks.git📁 이 리포지토리에는 다음과 같은 내용이 포함되어 있습니다:
- Istio 구성 리소스 (VirtualService, DestinationRule 등)
- 마이크로서비스 배포 YAML
- 테스트용 트래픽 스크립트 및 Fault Injection 설정 예시
다음 단계에서는 EKS 클러스터와 Istio 설치 과정을 차근차근 따라가며 실습을 시작합니다.
준비가 되셨다면, 이제 클러스터를 구성해볼까요?
✅ 실습환경 구성
📝 참고: 이 단계들은 첫 번째 블로그 Getting Started with Istio on EKS에서 다뤘던 Module 1 – Getting Started의 내용과 동일합니다.
아래 항목들을 정확히 따라 진행해 주세요!
🔧 1. 사전 준비
필수 도구 설치 (예: kubectl, helm, aws, terraform)
- Amazon EKS 클러스터 생성
- Istio 설치 및 구성
- istio-ingress 설정
# 소스 복제
❯ git clone https://github.com/aws-samples/istio-on-eks.git
❯ cd istio-on-eks/terraform-blueprint/sidecar
# main.tf 수정 (서울리전, 노드스펙다운)
locals {
name = "eks-istio-sejkim" # basename(path.cwd)
region = "ap-northeast-2" # us-west-2
...
eks_managed_node_groups = {
ng-sejkim = { # initial = {
instance_types = ["t3.medium"] # ["m5.large"]
min_size = 2 # 1
max_size = 5
desired_size = 2
...
# terraform 실행
❯ terraform init
❯ terraform plan
❯ terraform apply -auto-approve
# kubeconfig 생성
❯ aws eks --region ap-northeast-2 update-kubeconfig --name eks-istio-sejkim
# ingress-gateway pod rollout
❯ kubectl rollout restart deployment istio-ingress -n istio-ingress
# 생성 정보 확인
## namespace
❯ kubectl get ns
NAME STATUS AGE
default Active 37m
istio-ingress Active 20m
istio-system Active 33m
kube-node-lease Active 37m
kube-public Active 37m
kube-system Active 37m
## istio 버전 확인
❯ istioctl version
client version: 1.22.3
control plane version: 1.22.0
data plane version: 1.22.0 (1 proxies)
## pod 확인
❯ kubectl get pod -A
NAMESPACE NAME READY STATUS RESTARTS AGE
istio-ingress istio-ingress-7746669646-tdxc6 1/1 Running 0 7m30s
istio-system istiod-56855645c8-slbwp 1/1 Running 0 14m
kube-system aws-load-balancer-controller-7d9d48464-7t5m7 1/1 Running 0 14m
kube-system aws-load-balancer-controller-7d9d48464-h9m7r 1/1 Running 0 14m
kube-system aws-node-2wtck 2/2 Running 0 24m
kube-system aws-node-57vd9 2/2 Running 0 24m
kube-system aws-node-97str 2/2 Running 0 24m
kube-system coredns-5b9dfbf96-g2rp4 1/1 Running 0 28m
kube-system coredns-5b9dfbf96-w4jn8 1/1 Running 0 28m
kube-system kube-proxy-5vv5k 1/1 Running 0 24m
kube-system kube-proxy-dx7m8 1/1 Running 0 24m
kube-system kube-proxy-dxnxm 1/1 Running 0 24m
## istio-system
❯ kubectl get all -n istio-system
NAME READY STATUS RESTARTS AGE
pod/istiod-56855645c8-slbwp 1/1 Running 0 23m
NAME TYPE CLUSTER-IP EXTERNAL-IP PORT(S) AGE
service/istiod ClusterIP 172.20.224.162 <none> 15010/TCP,15012/TCP,443/TCP,15014/TCP 23m
NAME READY UP-TO-DATE AVAILABLE AGE
deployment.apps/istiod 1/1 1 1 23m
NAME DESIRED CURRENT READY AGE
replicaset.apps/istiod-56855645c8 1 1 1 23m
NAME REFERENCE TARGETS MINPODS MAXPODS REPLICAS AGE
horizontalpodautoscaler.autoscaling/istiod Deployment/istiod cpu: <unknown>/80% 1 5 1 23m
## instio-ingress
❯ kubectl get all -n istio-ingress
NAME READY STATUS RESTARTS AGE
pod/istio-ingress-7746669646-tdxc6 1/1 Running 0 16m
NAME TYPE CLUSTER-IP EXTERNAL-IP PORT(S) AGE
service/istio-ingress LoadBalancer 172.20.140.240 k8s-istioing-istioing-5650f19207-326a3cfa97e603f1.elb.ap-northeast-2.amazonaws.com 15021:31260/TCP,80:32598/TCP,443:31790/TCP 22m
NAME READY UP-TO-DATE AVAILABLE AGE
deployment.apps/istio-ingress 1/1 1 1 22m
NAME DESIRED CURRENT READY AGE
replicaset.apps/istio-ingress-7746669646 1 1 1 16m
replicaset.apps/istio-ingress-94f46b75b 0 0 0 22m
NAME REFERENCE TARGETS MINPODS MAXPODS REPLICAS AGE
horizontalpodautoscaler.autoscaling/istio-ingress Deployment/istio-ingress cpu: <unknown>/80% 1 5 1 22m
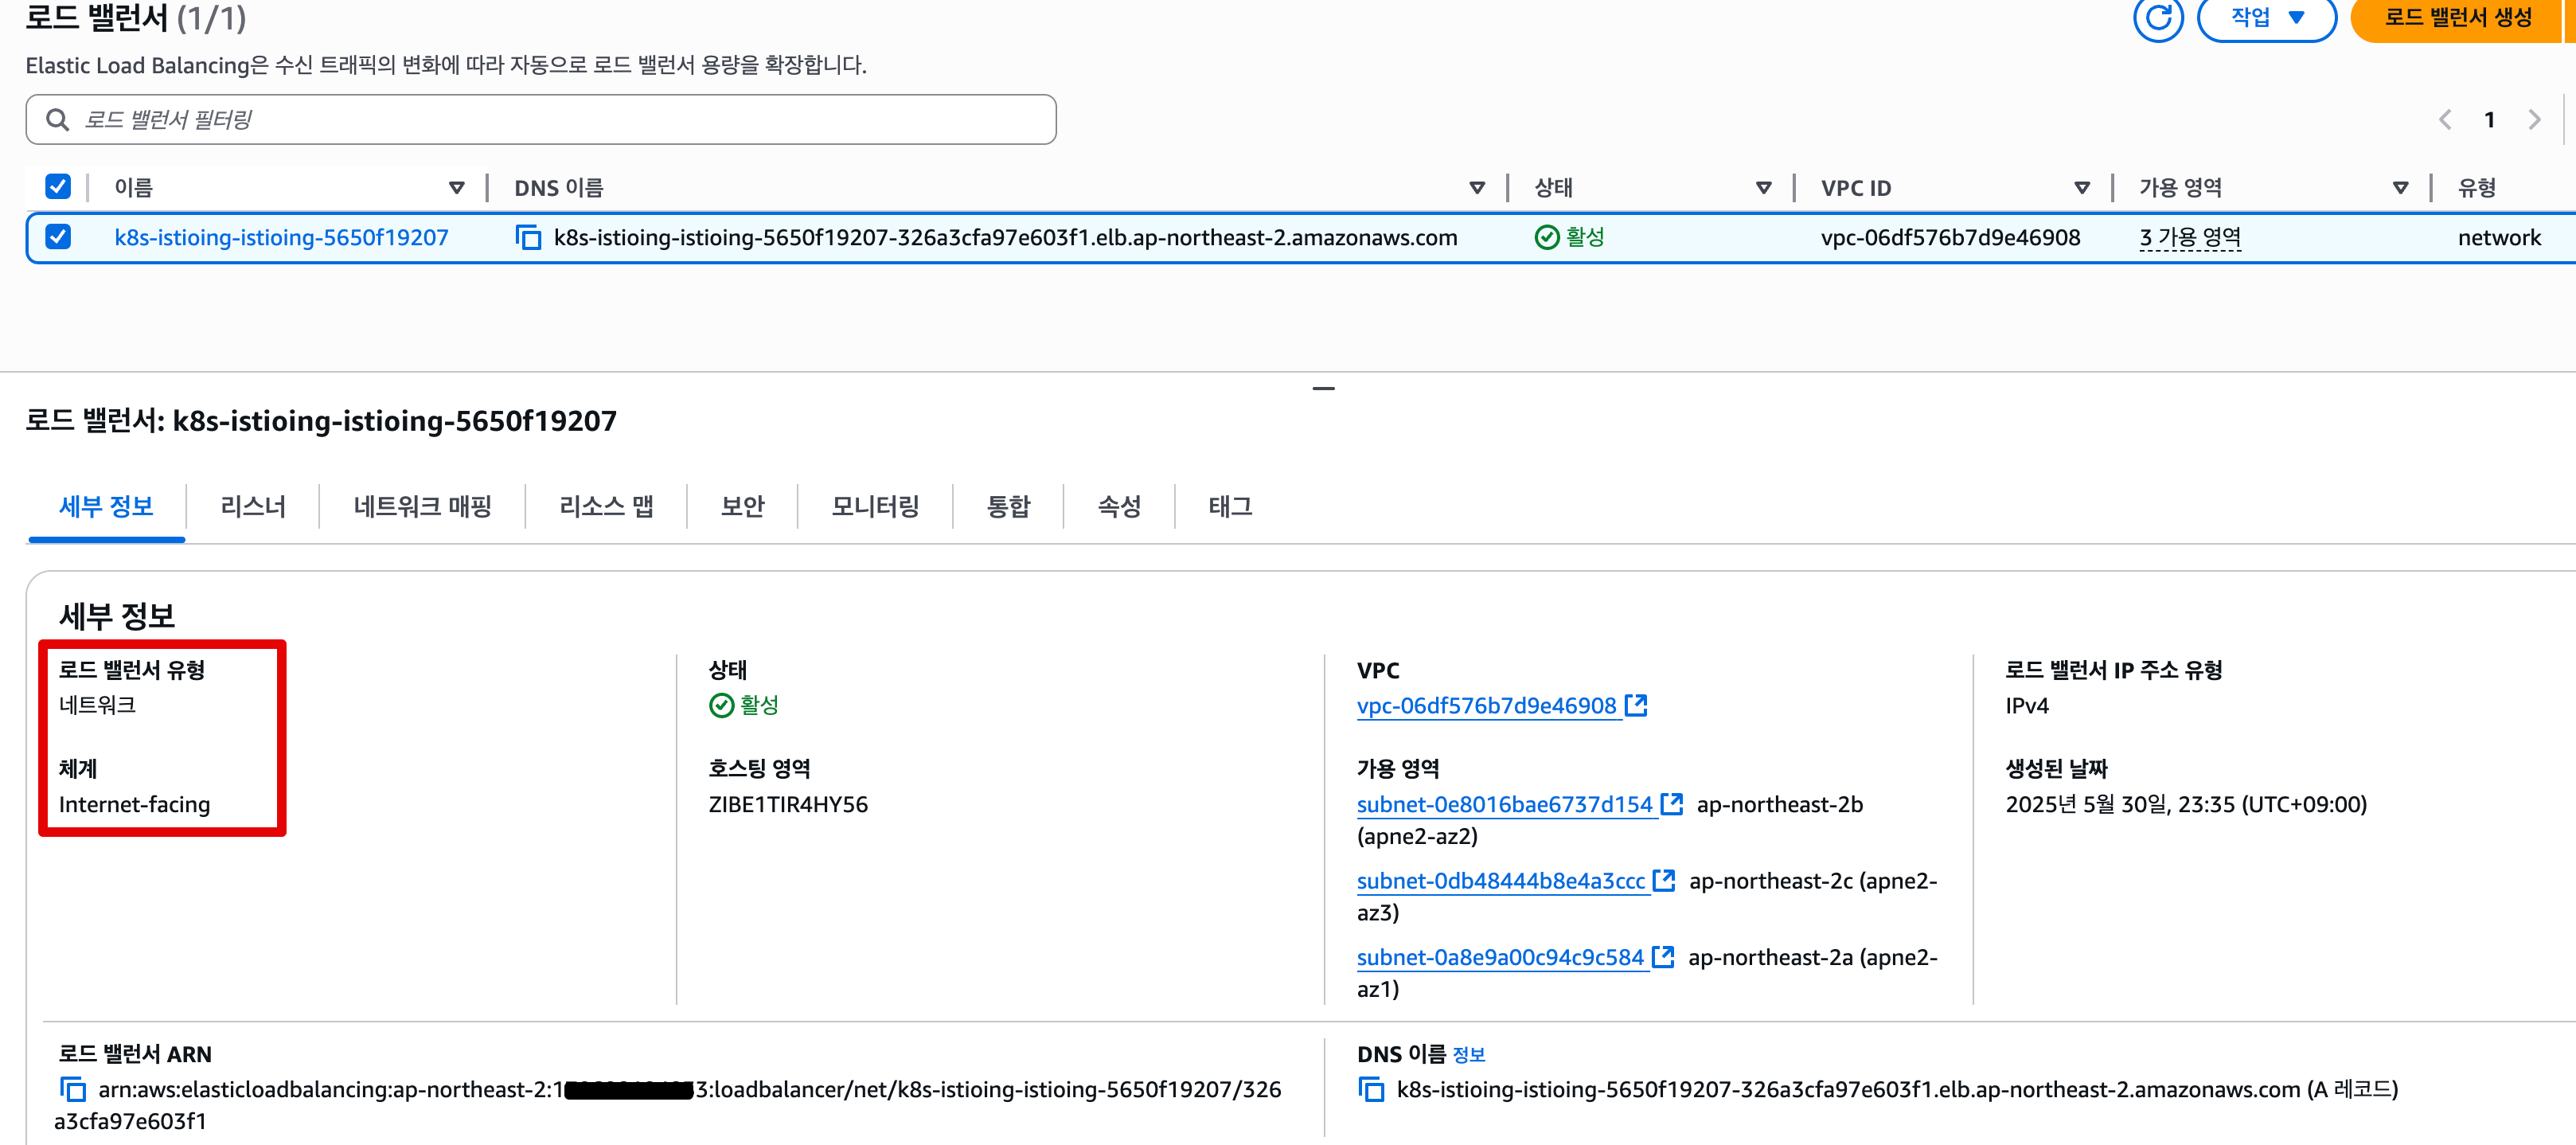
## internet-facing nlb 생성 됨
❯ kubectl get svc -n istio-ingress
NAME TYPE CLUSTER-IP EXTERNAL-IP PORT(S) AGE
istio-ingress LoadBalancer 172.20.140.240 k8s-istioing-istioing-5650f19207-326a3cfa97e603f1.elb.ap-northeast-2.amazonaws.com 15021:31260/TCP,80:32598/TCP,443:31790/TCP 16m
⁉️ 트러블 슈팅
1. eks 생성 후 helm chart download 에러 발생**
│ Error: could not download chart: no cached repo found. (try 'helm repo update'): open /Users/sjkim/Library/Caches/helm/repository/eks-index.yaml: no such file or directory with module.eks_blueprints_addons.module.aws_load_balancer_controller.helm_release.this[0],
│   on .terraform/modules/eks_blueprints_addons.aws_load_balancer_controller/main.tf line 9, in resource "helm_release" "this":
│    9: resource "helm_release" "this" {
...

=> helm repo update 후 terraform 재실행- public.ecr.aws/u2g6w7p2/eks-workshop-demo/catalog_detail Download 실패
   Warning  Failed     4m22s (x2 over 4m40s)  kubelet            Error: ErrImagePull                                                                         │
│   Normal   BackOff    4m11s (x5 over 4m39s)  kubelet            Back-off pulling image "public.ecr.aws/u2g6w7p2/eks-workshop-demo/catalog_detail:2.0"
...
=> jojiisacth 경로로 대체 (public.ecr.aws/u2g6w7p2/ 현재 미존재, 아래 설명됨)
📊 Observability Add-ons 설치
❯ for ADDON in kiali jaeger prometheus grafana
do
    ADDON_URL="https://raw.githubusercontent.com/istio/istio/release-1.20/samples/addons/$ADDON.yaml"
    kubectl apply --server-side -f $ADDON_URL
done
serviceaccount/kiali serverside-applied
configmap/kiali serverside-applied
clusterrole.rbac.authorization.k8s.io/kiali-viewer serverside-applied
clusterrole.rbac.authorization.k8s.io/kiali serverside-applied
clusterrolebinding.rbac.authorization.k8s.io/kiali serverside-applied
role.rbac.authorization.k8s.io/kiali-controlplane serverside-applied
rolebinding.rbac.authorization.k8s.io/kiali-controlplane serverside-applied
service/kiali serverside-applied
deployment.apps/kiali serverside-applied
deployment.apps/jaeger serverside-applied
service/tracing serverside-applied
service/zipkin serverside-applied
service/jaeger-collector serverside-applied
serviceaccount/prometheus serverside-applied
configmap/prometheus serverside-applied
clusterrole.rbac.authorization.k8s.io/prometheus serverside-applied
clusterrolebinding.rbac.authorization.k8s.io/prometheus serverside-applied
service/prometheus serverside-applied
deployment.apps/prometheus serverside-applied
serviceaccount/grafana serverside-applied
configmap/grafana serverside-applied
service/grafana serverside-applied
deployment.apps/grafana serverside-applied
configmap/istio-grafana-dashboards serverside-applied
configmap/istio-services-grafana-dashboards serverside-applied
🚀 2. 애플리케이션 및 Istio 리소스 배포(Deploy)
Helm을 사용하여 Product Catalog 애플리케이션을 배포합니다.
기본 Istio 리소스 (예: VirtualService, DestinationRule)도 함께 설치합니다.
# Change directory to the right folder
❯ cd modules/01-getting-started

# Create workshop namespace
❯ kubectl create namespace workshop
❯ kubectl label namespace workshop istio-injection=enabled

# Install all the microservices in one go
## values.yaml 수정 (u2g6w7p2 존재하지 않아 ImagePullBackOff 에러 발생)
- 수정전: public.ecr.aws/u2g6w7p2/eks-workshop-demo/
- 수정후: jojiisacth

❯ cat values.yaml
# Default values for helm-chart.
# This is a YAML-formatted file.
# Declare variables to be passed into your templates.

catalogdetail1:
  image:
    repository: jojiisacth/catalog_detail
    tag: "1.0"

catalogdetail2:
  image:
    repository: jojiisacth/catalog_detail
    tag: "2.0"

productcatalog:
  image:
    repository: jojiisacth/product_catalog
    tag: "1.0"

  env:
    - name: AGG_APP_URL
      value: "http://catalogdetail.workshop.svc.cluster.local:3000/catalogDetail"

frontend:
  image:
    repository: jojiisacth/frontend_node
    tag: "1.0"

  env:
    - name: BASE_URL
      value: "http://productcatalog.workshop.svc.cluster.local:5000/products/"

❯ helm install mesh-basic . -n workshop
NAME: mesh-basic
LAST DEPLOYED: Sat May 31 00:15:01 2025
NAMESPACE: workshop
STATUS: deployed
REVISION: 1
TEST SUITE: None
NOTES:
1. Get the application URL by running the following command:

   ISTIO_INGRESS_URL=$(kubectl get svc istio-ingress -n istio-ingress -o jsonpath='{.status.loadBalancer.ingress[*].hostname}')
   echo "http://$ISTIO_INGRESS_URL"

2. Access the displayed URL in a terminal using cURL or via a browser window

Note: It may take a few minutes for the istio-ingress Network LoadBalancer to associate to the instance-mode targetGroup after the application is deployed.

❯ ISTIO_INGRESS_URL=$(kubectl get svc istio-ingress -n istio-ingress -o jsonpath='{.status.loadBalancer.ingress[*].hostname}')
❯ echo "http://$ISTIO_INGRESS_URL"
http://k8s-istioing-istioing-8bcd41c042-daeeb0ea889d3a56.elb.ap-northeast-2.amazonaws.com

# Validate
❯ kubectl -n workshop get all
NAME                                 READY   STATUS    RESTARTS   AGE
pod/catalogdetail-7b5f677755-6dwq9   2/2     Running   0          28s
pod/catalogdetail2-64885974c-98vfm   2/2     Running   0          28s
pod/frontend-66c78fb848-496c9        2/2     Running   0          28s
pod/productcatalog-bb8775b67-r82sm   2/2     Running   0          28s

NAME                     TYPE        CLUSTER-IP       EXTERNAL-IP   PORT(S)    AGE
service/catalogdetail    ClusterIP   172.20.253.99    <none>        3000/TCP   28s
service/frontend         ClusterIP   172.20.118.156   <none>        9000/TCP   28s
service/productcatalog   ClusterIP   172.20.116.101   <none>        5000/TCP   28s

NAME                             READY   UP-TO-DATE   AVAILABLE   AGE
deployment.apps/catalogdetail    1/1     1            1           28s
deployment.apps/catalogdetail2   1/1     1            1           28s
deployment.apps/frontend         1/1     1            1           28s
deployment.apps/productcatalog   1/1     1            1           28s

NAME                                       DESIRED   CURRENT   READY   AGE
replicaset.apps/catalogdetail-7b5f677755   1         1         1       28s
replicaset.apps/catalogdetail2-64885974c   1         1         1       28s
replicaset.apps/frontend-66c78fb848        1         1         1       28s
replicaset.apps/productcatalog-bb8775b67   1         1         1       28s

# Istio Resources
❯ kubectl get Gateway,VirtualService,DestinationRule -n workshop
NAME                                             AGE
gateway.networking.istio.io/productapp-gateway   2m1s

NAME                                            GATEWAYS                 HOSTS   AGE
virtualservice.networking.istio.io/productapp   ["productapp-gateway"]   ["*"]   2m1s
🧭 3. Kiali 설정 및 접근
kubectl port-forward 명령어를 사용하여 Kiali 대시보드에 접속합니다.
Kiali Graph에서 보기 옵션을 조정하여 트래픽 흐름을 시각적으로 분석합니다.
# kiali port-forwarding
❯ kubectl port-forward svc/kiali 20001:20001 -n istio-system
open http://localhost:20001

# siege 설치 (Siege is an open source regression test and benchmark utility)
❯ brew install siege

# Generating Traffic
❯ ISTIO_INGRESS_URL=$(kubectl get service/istio-ingress -n istio-ingress -o json | jq -r '.status.loadBalancer.ingress[0].hostname')
❯ siege http://$ISTIO_INGRESS_URL -c 5 -d 10 -t 2M
New configuration template added to /Users/sjkim/.siege
Run siege -C to view the current settings in that file
** SIEGE 4.1.7
** Preparing 5 concurrent users for battle.
The server is now under siege...
HTTP/1.1 200     0.16 secs:    1195 bytes ==> GET  /
HTTP/1.1 200     0.16 secs:    1195 bytes ==> GET  /
HTTP/1.1 200     0.16 secs:    1195 bytes ==> GET  /
HTTP/1.1 200     0.16 secs:    1195 bytes ==> GET  /
HTTP/1.1 200     0.16 secs:    1195 bytes ==> GET  /
HTTP/1.1 200     0.04 secs:   62671 bytes ==> GET  /architecture.png
HTTP/1.1 200     0.05 secs:   62671 bytes ==> GET  /architecture.png
HTTP/1.1 200     0.05 secs:   62671 bytes ==> GET  /architecture.png
HTTP/1.1 200     0.05 secs:   62671 bytes ==> GET  /architecture.png
HTTP/1.1 200     0.06 secs:   62671 bytes ==> GET  /architecture.png
HTTP/1.1 200     0.03 secs:    1607 bytes ==> GET  /css/styles.css
HTTP/1.1 200     0.04 secs:    1607 bytes ==> GET  /css/styles.css
HTTP/1.1 200     0.03 secs:    1607 bytes ==> GET  /css/styles.css
HTTP/1.1 200     0.04 secs:    1607 bytes ==> GET  /css/styles.css
HTTP/1.1 200     0.03 secs:    1607 bytes ==> GET  /css/styles.css
HTTP/1.1 200     0.07 secs:    1195 bytes ==> GET  /
HTTP/1.1 200     0.05 secs:   62671 bytes ==> GET  /architecture.png
HTTP/1.1 200     0.03 secs:    1607 bytes ==> GET  /css/styles.css
...
Lifting the server siege...
Transactions:                 372    hits
Availability:                 100.00 %
Elapsed time:                 120.13 secs
Data transferred:               7.74 MB
Response time:                 54.60 ms
Transaction rate:               3.10 trans/sec
Throughput:                     0.06 MB/sec
Concurrency:                    0.17
Successful transactions:      372
Failed transactions:            0
Longest transaction:          170.00 ms
Shortest transaction:          30.00 ms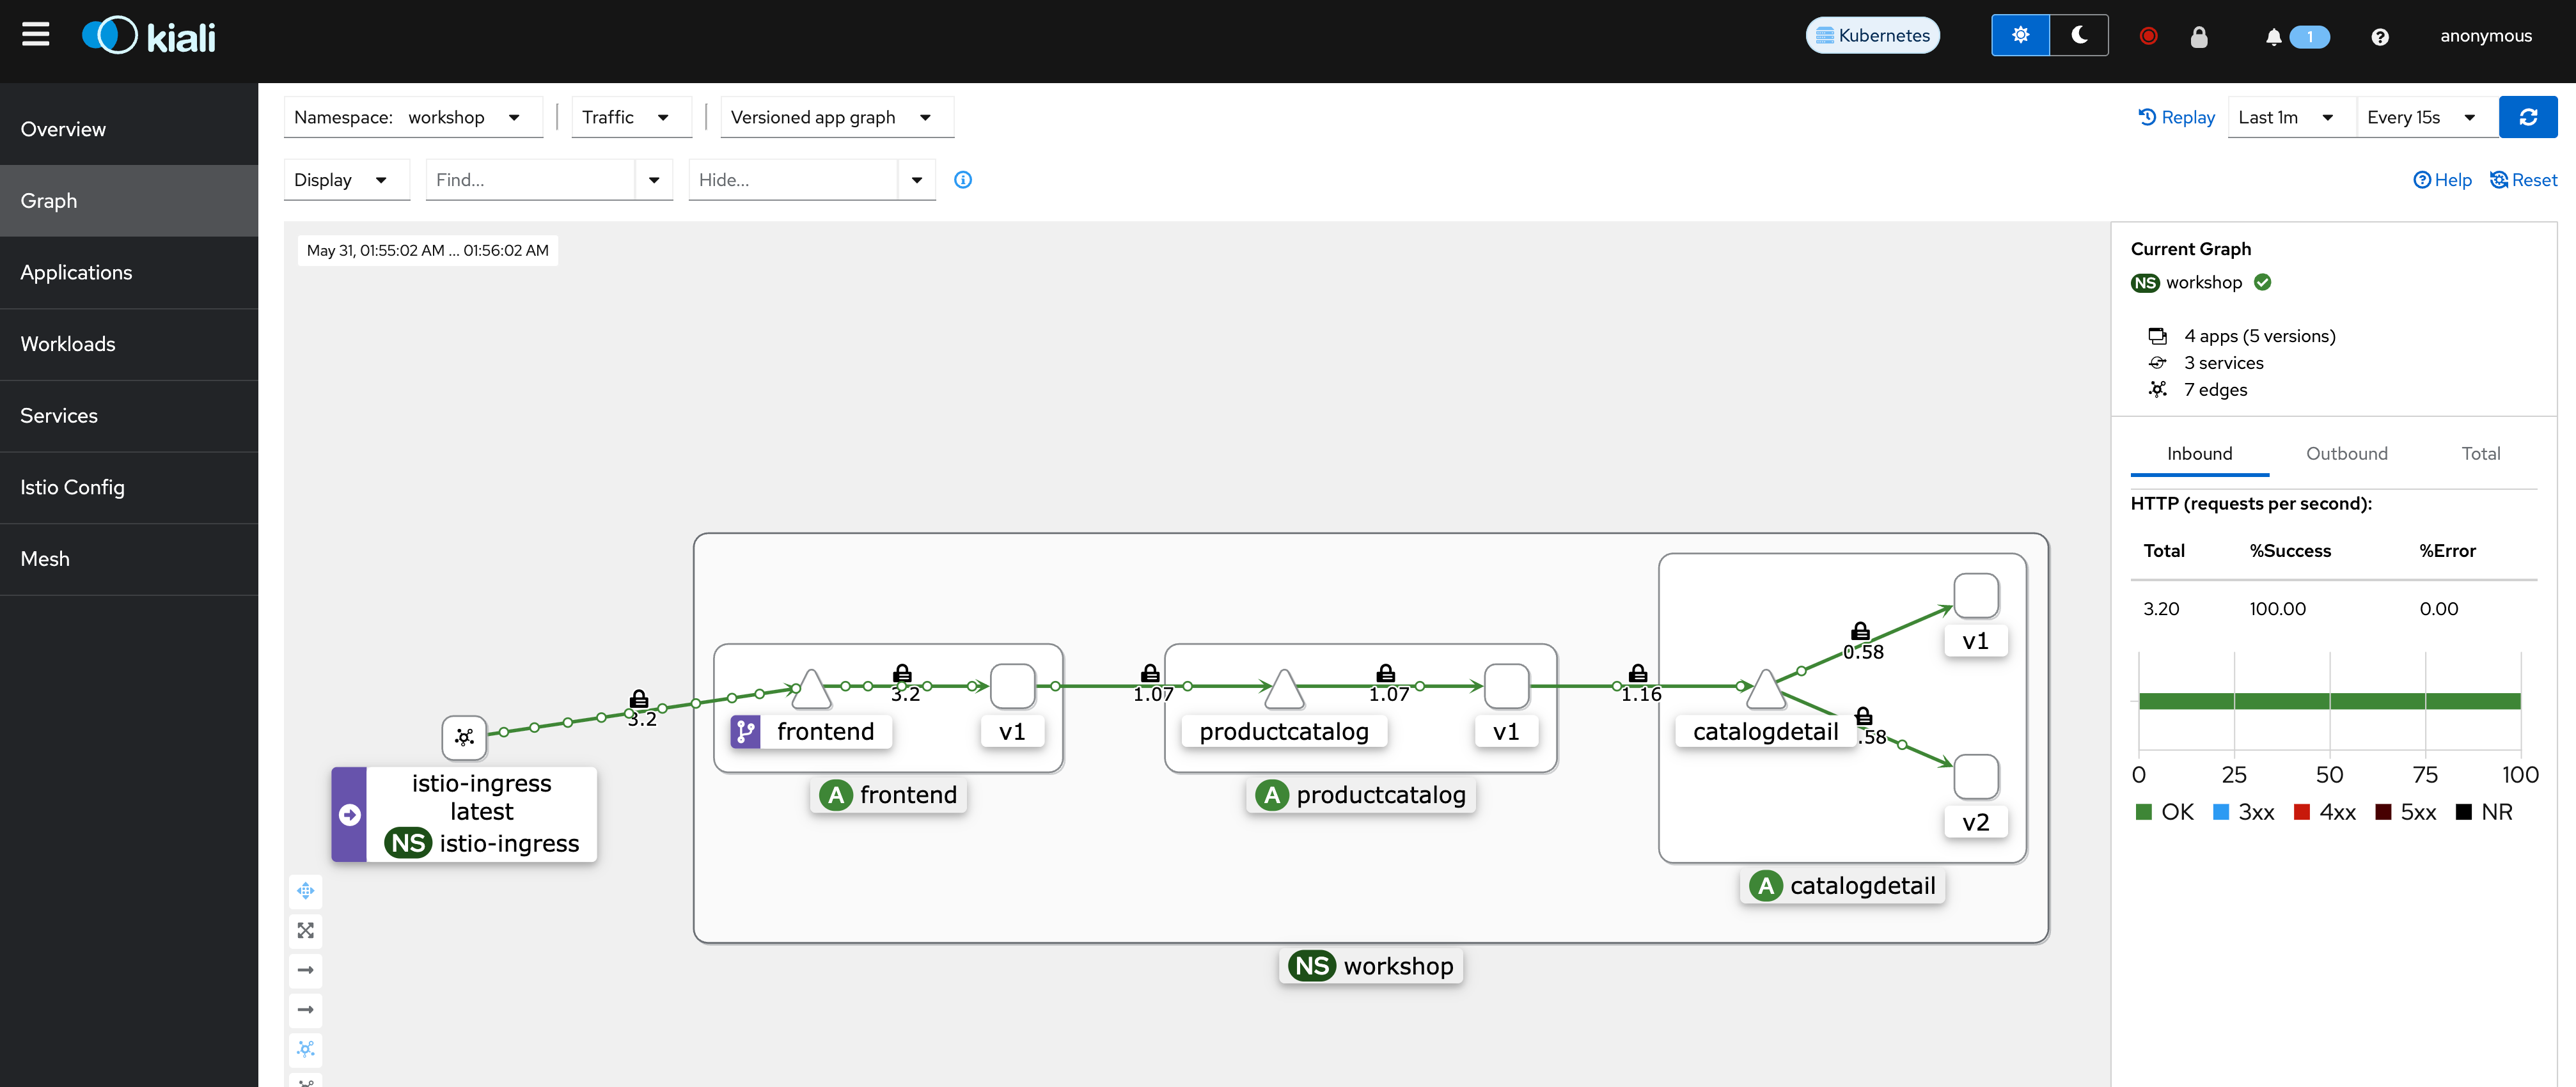
🔧 4. istioctl 설치 및 환경 변수 설정
공식 문서에 따라 istioctl을 설치합니다.
$PATH에 istioctl을 추가하여 전역에서 사용할 수 있도록 설정합니다.
❯ asdf install istioctl 1.22.0
❯ asdf set -p istioctl 1.22.0
❯ istioctl version
client version: 1.22.0
control plane version: 1.22.0
data plane version: 1.22.0 (4 proxies)
⚠️ 중요 확인 사항
다음 명령어를 실행했을 때 정상적인 결과가 출력되지 않으면 다음 단계로 진행하지 마세요!
문제가 있을 경우 앞선 설정 단계를 다시 점검해 주세요.
❯ kubectl get pods -n workshop
NAME                             READY   STATUS    RESTARTS   AGE
catalogdetail-7b5f677755-6dwq9   2/2     Running   0          32m
catalogdetail2-64885974c-98vfm   2/2     Running   0          32m
frontend-66c78fb848-496c9        2/2     Running   0          32m
productcatalog-bb8775b67-r82sm   2/2     Running   0          32m
이제 환경 구성이 끝났다면, 다음 섹션부터는 본격적으로
📦 네트워크 복원력 리소스(Timeouts, Retries 등)를 배포하고 실습을 진행합니다.
🧩 Istio 서비스 메시 리소스 초기화하기
이제 Product Catalog 애플리케이션에 필요한 Istio 리소스들을 한 번에 생성하겠습니다.
아래 명령어를 실행하면, 네트워크 복원력 실습을 위한 핵심 Istio 구성요소들이 배포됩니다:
❯ cd ../03-network-resiliency
❯ kubectl apply -f ../00-setup-mesh-resources/
destinationrule.networking.istio.io/catalogdetail created
virtualservice.networking.istio.io/catalogdetail created
virtualservice.networking.istio.io/frontend created
virtualservice.networking.istio.io/productcatalog created

❯ kubectl -n workshop get dr,vs
NAME                                                HOST                                       AGE
destinationrule.networking.istio.io/catalogdetail   catalogdetail.workshop.svc.cluster.local   49s

NAME                                                GATEWAYS                 HOSTS                AGE
virtualservice.networking.istio.io/catalogdetail                             ["catalogdetail"]    49s
virtualservice.networking.istio.io/frontend                                  ["frontend"]         49s
virtualservice.networking.istio.io/productapp       ["productapp-gateway"]   ["*"]                40m
virtualservice.networking.istio.io/productcatalog                            ["productcatalog"]   49s
🔎 이 구성 요소들은 이전 블로그 Using Istio Traffic Management on Amazon EKS to Enhance User Experience에서 “Key Istio Components” 항목에서 자세히 설명한 바 있습니다.
👉 복습이 필요하신 분들은 해당 블로그 포스트를 다시 참고해 주세요!
🏥 Network Resilience Use cases
🛠️ 이제 Istio의 네트워크 복원력 기능들을 하나씩 실습해보겠습니다
이번 섹션부터는 Istio가 제공하는 다양한 네트워크 복원력 기능들을 직접 설정하고 실습해보는 시간을 가집니다.
🔧 각 항목마다 다음과 같은 방식으로 구성되어 있습니다:
- 📋 기능 설명 및 개념 정리
- 🧑💻 실습을 위한 단계별 명령어 안내
- 🧹 마무리 후 환경 초기화(reset) 방법 안내
이러한 방식으로 각 기능별 실습을 마칠 때마다
👉 다음 기능 실습을 위한 클린 상태로 환경을 되돌릴 수 있도록 도와드립니다.
🧪 실습할 Istio 복원력 기능은 다음과 같습니다:
- Fault Injection (장애 주입)
- Timeouts (타임아웃)
- Retries (재시도)
- Circuit Breakers (회로 차단기)
- Rate Limiting (속도 제한)
📘 실습이 모두 끝나면, 여러분은 다음과 같은 역량을 갖추게 됩니다:
- 🔍 Istio의 복원력 기능을 상황에 맞게 선택하고 적용할 수 있는 실전 능력
- 💡 트래픽 이상 상황에 대해 유연하게 대처할 수 있는 구성 역량
- 🚀 마이크로서비스 시스템의 안정성과 가용성을 실질적으로 향상시키는 경험
💥 Fault Injection(장애 주입)
Istio의 장애 주입(Fault Injection) 기능은 애플리케이션의 복원력을 검증하고 강화하는 데 매우 강력한 도구입니다.
이를 통해 비용이 큰 장애나 서비스 중단을 사전에 예방하고, 실제 문제를 사전에 식별하고 대응할 수 있도록 도와줍니다. 🔍🛡️
🧪 Istio는 두 가지 형태의 Fault를 지원합니다:
- ⏱️ Delay (지연): 네트워크 지연이나 업스트림 서비스의 과부하 상황을 시뮬레이션
- ❌ Abort (중단): 특정 HTTP 오류 코드를 의도적으로 반환하여 오류 처리 로직을 테스트
🧠 참고: 다른 방식들이 주로 네트워크 레벨 장애를 시뮬레이션하는 데 반해,
Istio는 애플리케이션 레벨에서의 정밀한 테스트를 가능하게 해줍니다.
예를 들어, 특정 HTTP 상태 코드(500, 503 등)를 통해 좀 더 의미 있는 인사이트를 얻을 수 있습니다.
📌 Fault Injection의 실제 활용 사례
- 🔄 요청 폭주 상황에서의 서비스 반응 테스트
- 🐢 DB 연결 지연 또는 실패 시 애플리케이션의 예외 처리 능력 검증
- 🌐 네트워크 연결 장애, 패킷 손실 등 네트워크 불안정 상황 시뮬레이션
⏱️ HTTP 요청에 Delay Fault 주입하기
Delay는 가장 기본적인 장애 주입 방법으로,
응답 시간 지연, 네트워크 지연, 타임아웃 유도 등의 상황을 테스트하는 데 사용됩니다.
이 실습을 통해 서비스가 느린 응답 또는 통신 지연에 어떻게 반응하는지 평가할 수 있습니다.
🔧 실습 대상 리소스
이번 실습에서는 catalogdetail 마이크로서비스에 대한
VirtualService 리소스를 수정하여 지연을 주입해볼 것입니다.
...
http:
- match:
- headers:
user:
exact: "internal"
fault:
delay:
percentage:
value: 100
fixedDelay: 15s
route:
- destination:
host: catalogdetail
port:
number: 3000
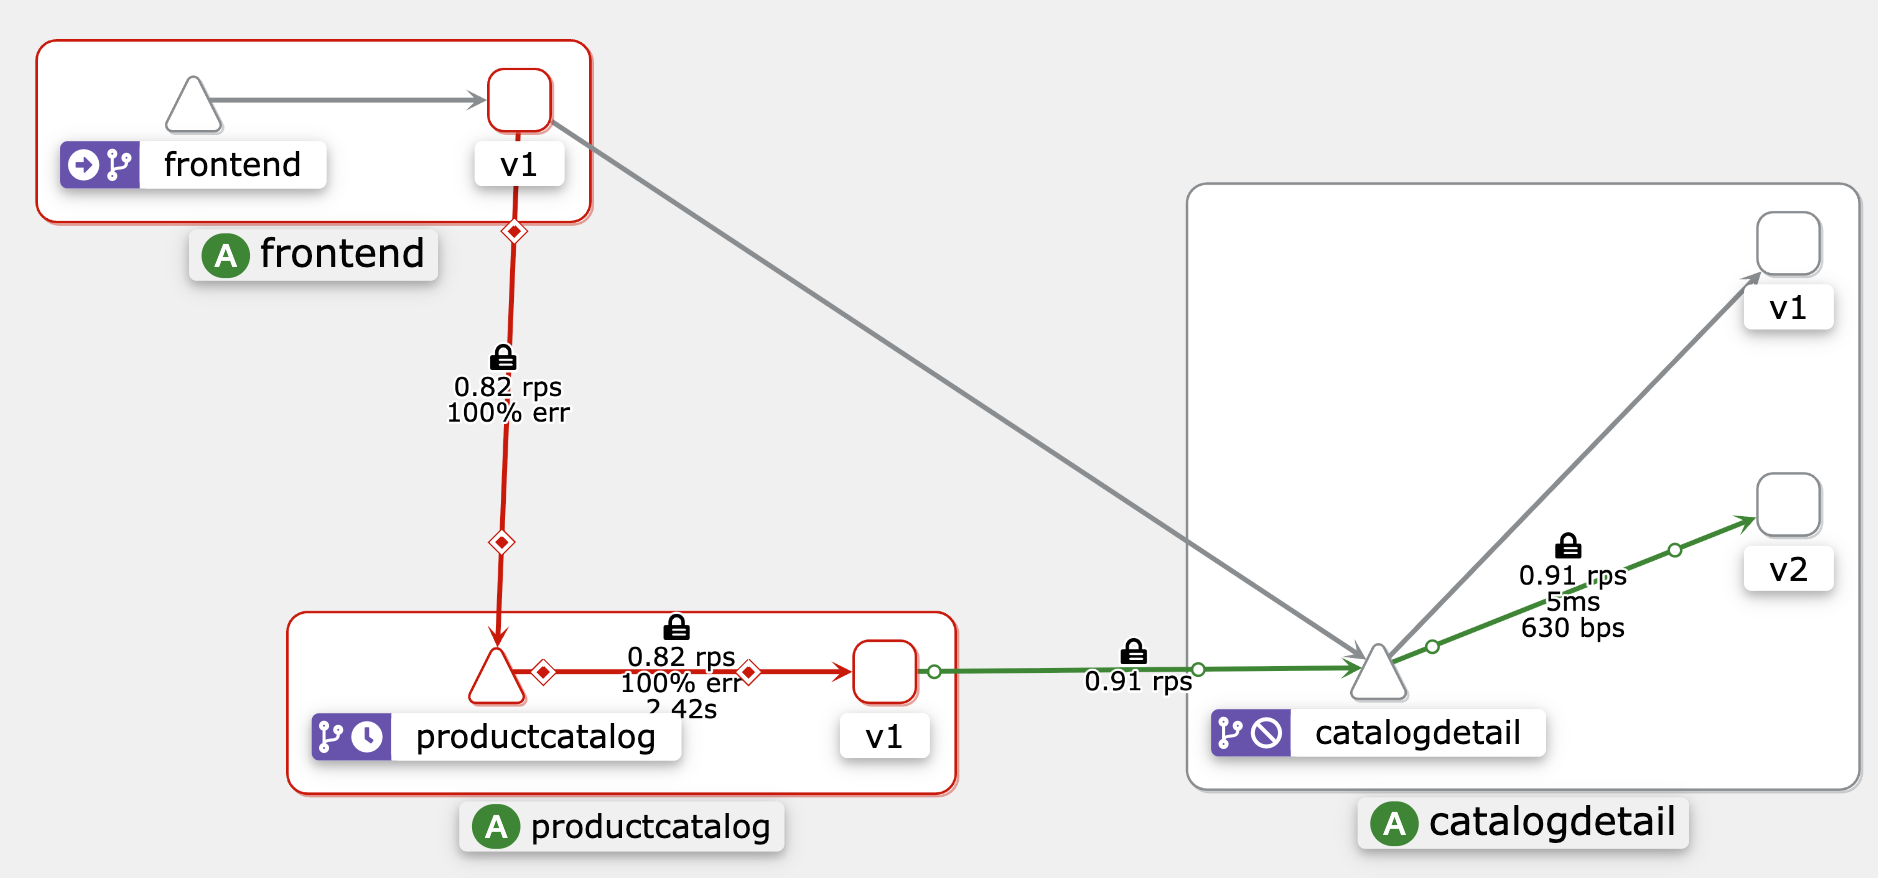
...🧪 VirtualService에서 Delay Fault 주입하기
VirtualService에서 fault 필드는 internal이라는 사용자에 대해 catalogdetail 서비스로 가는 트래픽에 지연을 주입합니다. 지연은 고정값 또는 백분율 기반으로 설정할 수 있습니다. 위 구성은 catalogdetail에 대한 모든 요청(100%)에 15초의 지연을 적용합니다.
다음 명령으로 트래픽 지연을 위한 Fault Injection 규칙을 생성합니다:
❯ cd fault-injection/
❯ kubectl apply -f ./delay/catalogdetail-virtualservice.yaml
virtualservice.networking.istio.io/catalogdetail configured
🧪 지연 테스트를 위한 curl 명령 실행
internal 및 external 사용자에 대해 지연이 올바르게 작동하는지 확인하려면 아래 명령어를 실행하세요:
❯ export FE_POD_NAME=$(kubectl get pods -n workshop -l app=frontend -o jsonpath='{.items[].metadata.name}')

❯ kubectl exec -it ${FE_POD_NAME} -n workshop -c frontend -- bash
root@frontend-66c78fb848-496c9:/usr/src/app #
1️⃣ 사용자 internal에 대한 요청 테스트:
# curl http://catalogdetail:3000/catalogdetail/ -s -H "user: internal" -o /dev/null \
-w "Time taken to start transfer: %{time_starttransfer}\n"
🕒 출력 예시 (15초 지연이 적용됨):
Time taken to start transfer: 15.0173482️⃣ 사용자 external에 대한 요청 테스트:
# curl http://catalogdetail:3000/catalogdetail/ -s -H "user: external" -o /dev/null \
-w "Time taken to start transfer: %{time_starttransfer}\n"
⚡ 출력 예시 (지연 없음):
Time taken to start transfer: 0.015953📌 catalogdetail VirtualService의 지연 설정은 user: internal 헤더가 있는 요청에만 적용되므로, external 사용자의 요청에는 지연이 발생하지 않습니다.
이제 frontend 컨테이너 내부 셸에서 나가려면 먼저 Enter 키를 누르고, exit을 입력한 후 다시 Enter 키를 누르세요.
catalogdetail 서비스에 지연을 도입함으로써, 서비스에 도달하기 전 트래픽에 지연이 주입되어 특정 사용자 또는 사용자 그룹에 영향을 줍니다. 이러한 의도적인 테스트를 통해 정의된 사용자 범위 내에서 애플리케이션의 복원력을 효과적으로 평가할 수 있습니다.
HTTP 요청에 Abort Fault 주입하기
Abort는 Fault Injection에서 매우 중요한 역할을 하며, 일반적으로 HTTP 오류 코드 또는 TCP 연결 문제로 나타나는 업스트림 서비스의 충돌 실패 상황을 시뮬레이션합니다. HTTP 요청에 abort를 주입함으로써 이러한 시나리오를 재현하고, 애플리케이션의 복원력을 강화하기 위한 종합적인 테스트를 수행할 수 있습니다. 이 섹션에서는 HTTP 요청에 abort fault를 주입하는 방법을 단계별로 안내합니다.
이 사용 사례를 위해 catalogdetail VirtualService를 다음과 같이 업데이트 합니다.
...
  http:
  - match:
    - headers:
        user:
          exact: "internal"
    fault:
     abort:
       percentage:
         value: 100
       httpStatus: 500
    route:
    - destination:
        host: catalogdetail
        port:
          number: 3000
...
VirtualService에서 fault 필드를 사용하면 catalogdetail 서비스로 향하는 트래픽에 대해 Abort Fault를 주입할 수 있습니다. 이 예에서는 사용자 헤더가 internal인 요청에 대해 HTTP 상태 코드 500 (Internal Server Error)을 반환하도록 설정합니다.
❯ kubectl apply -f ./abort/catalogdetail-virtualservice.yaml
virtualservice.networking.istio.io/catalogdetail configured
internal과 external 사용자에 대해 catalogdetail 서비스에 curl 명령을 실행하여 abort 동작을 테스트합니다.
❯ kubectl exec -it ${FE_POD_NAME} -n workshop -c frontend -- bash
root@frontend-66c78fb848-496c9:/usr/src/app#

# curl http://catalogdetail:3000/catalogdetail/ -s -H "user: internal" -o /dev/null -w "HTTP Response: %{http_code}\n"
출력은 아래와 유사해야 합니다. catalogdetail VirtualService의 abort fault 설정에 따라 internal 사용자에게는 HTTP 500 오류(Abort)가 나타납니다.
HTTP Response: 500internal이 아닌 external 사용자에 대해 curl 명령을 실행합니다.
# curl http://catalogdetail:3000/catalogdetail/ -s -H "user: external" -o /dev/null -w "HTTP Response: %{http_code}\n"출력은 아래와 유사해야 합니다. catalogdetail VirtualService의 abort fault 설정이 ‘internal’ 사용자에만 적용되므로, ‘external’ 사용자에게는 HTTP 200 성공 응답이 나타납니다.
HTTP Response: 200이제 frontend 컨테이너 내부 셸에서 나가려면, 먼저 Enter 키를 누르고, ‘exit’ 을 입력한 후 다시 Enter 키를 누르세요.
catalogdetail 서비스에 abort를 도입함으로써, 특정 사용자 또는 사용자 그룹에 대해 서비스에 도달하기 전에 HTTP abort fault가 트래픽에 주입됩니다. 이러한 의도적인 테스트를 통해 정의된 사용자 범위 내에서 애플리케이션의 복원력을 효과적으로 평가할 수 있습니다.
환경 초기화
fault-injection 디렉터리에서 다음 명령어를 실행하여 구성을 초기 상태로 리셋하세요:
kubectl apply -f ../../00-setup-mesh-resources/
destinationrule.networking.istio.io/catalogdetail unchanged
virtualservice.networking.istio.io/catalogdetail configured
virtualservice.networking.istio.io/frontend unchanged
virtualservice.networking.istio.io/productcatalog unchanged
⌛️ Timeouts
Istio에서 타임아웃(timeout)은 한 서비스나 프록시가 다른 서비스로부터 응답을 기다리는 최대 시간을 의미하며, 이 시간이 초과되면 통신을 실패로 간주합니다. 타임아웃 설정은 요청의 지속 시간을 관리하고 제어하여 Istio 서비스 메쉬 내 마이크로서비스 간 통신의 신뢰성과 성능을 향상시키는 데 도움을 줍니다.
타임아웃 기능을 테스트하기 위해, productcatalog 서비스에서 catalogdetail 서비스로 호출을 수행할 것입니다. 이전에 살펴본 Fault Injection 방식을 사용하여 catalogdetail 서비스에 지연을 주입한 후, productcatalog 서비스에 타임아웃을 추가할 예정입니다.
- 먼저
catalogdetailVirtualService에 5초 지연을 적용해보겠습니다.
...
spec:
  ...
  - fault:
      ...
        fixedDelay: 5s
    route:
    ...
# This assumes that you are currently in "istio-on-eks/modules/03-network-resiliency" folder
❯ cd timeouts-retries-circuitbreaking
❯ kubectl apply -f ./timeouts/catalogdetail-virtualservice.yaml
virtualservice.networking.istio.io/catalogdetail configured서비스 메쉬 내부에서 productcatalog 서비스에 대해 curl 명령을 실행하여 지연이 적용되었는지 테스트합니다.
# Set the FE_POD_NAME variable to the name of the frontend pod in the workshop namespace

❯ export FE_POD_NAME=$(kubectl get pods -n workshop -l app=frontend -o jsonpath='{.items[].metadata.name}')

# Access the frontend container in the workshop namespace interactively
❯ kubectl exec -it ${FE_POD_NAME} -n workshop -c frontend -- bash
root@frontend-66c78fb848-496c9:/usr/src/app#

# Allows accessing the shell inside the frontend container for executing commands

# curl http://productcatalog:5000/products/ -s -o /dev/null -w "Time taken to start transfer: %{time_starttransfer}\n"
지연 설정이 올바르게 적용되었다면, 출력 결과는 다음과 유사해야 합니다:
Time taken to start transfer: 5.033362- productcatalog VirtualService에 2초 타임아웃을 적용합니다.
...
spec:
...
    route:
    - destination:
        ...
    timeout: 2s

# This assumes that you are currently in "istio-on-eks/modules/03-network-resiliency/timeouts-retries-circuitbreaking" folder

❯ kubectl apply -f ./timeouts/productcatalog-virtualservice.yaml
virtualservice.networking.istio.io/productcatalog configured
productcatalog 서비스에 2초 타임아웃이 설정되어 있으면, 평균 응답 시간이 약 5초인 catalogdetail 서비스로의 호출은 타임아웃 임계값을 초과하게 되어, 해당 호출에서 타임아웃이 발생하게 됩니다.
서비스 메쉬 내부에서 productcatalog 서비스에 대해 curl 명령을 실행하여 타임아웃 동작을 테스트합니다.
# Access the frontend container in the workshop namespace interactively

❯ kubectl exec -it ${FE_POD_NAME} -n workshop -c frontend -- bash
root@frontend-66c78fb848-496c9:/usr/src/app#

# Allows accessing the shell inside the frontend container for executing commands

curl http://productcatalog:5000/products/ -s -o /dev/null -w "Time taken to start transfer: %{time_starttransfer}\n"
출력 결과는 다음과 유사해야 합니다:
Time taken to start transfer: 2.010994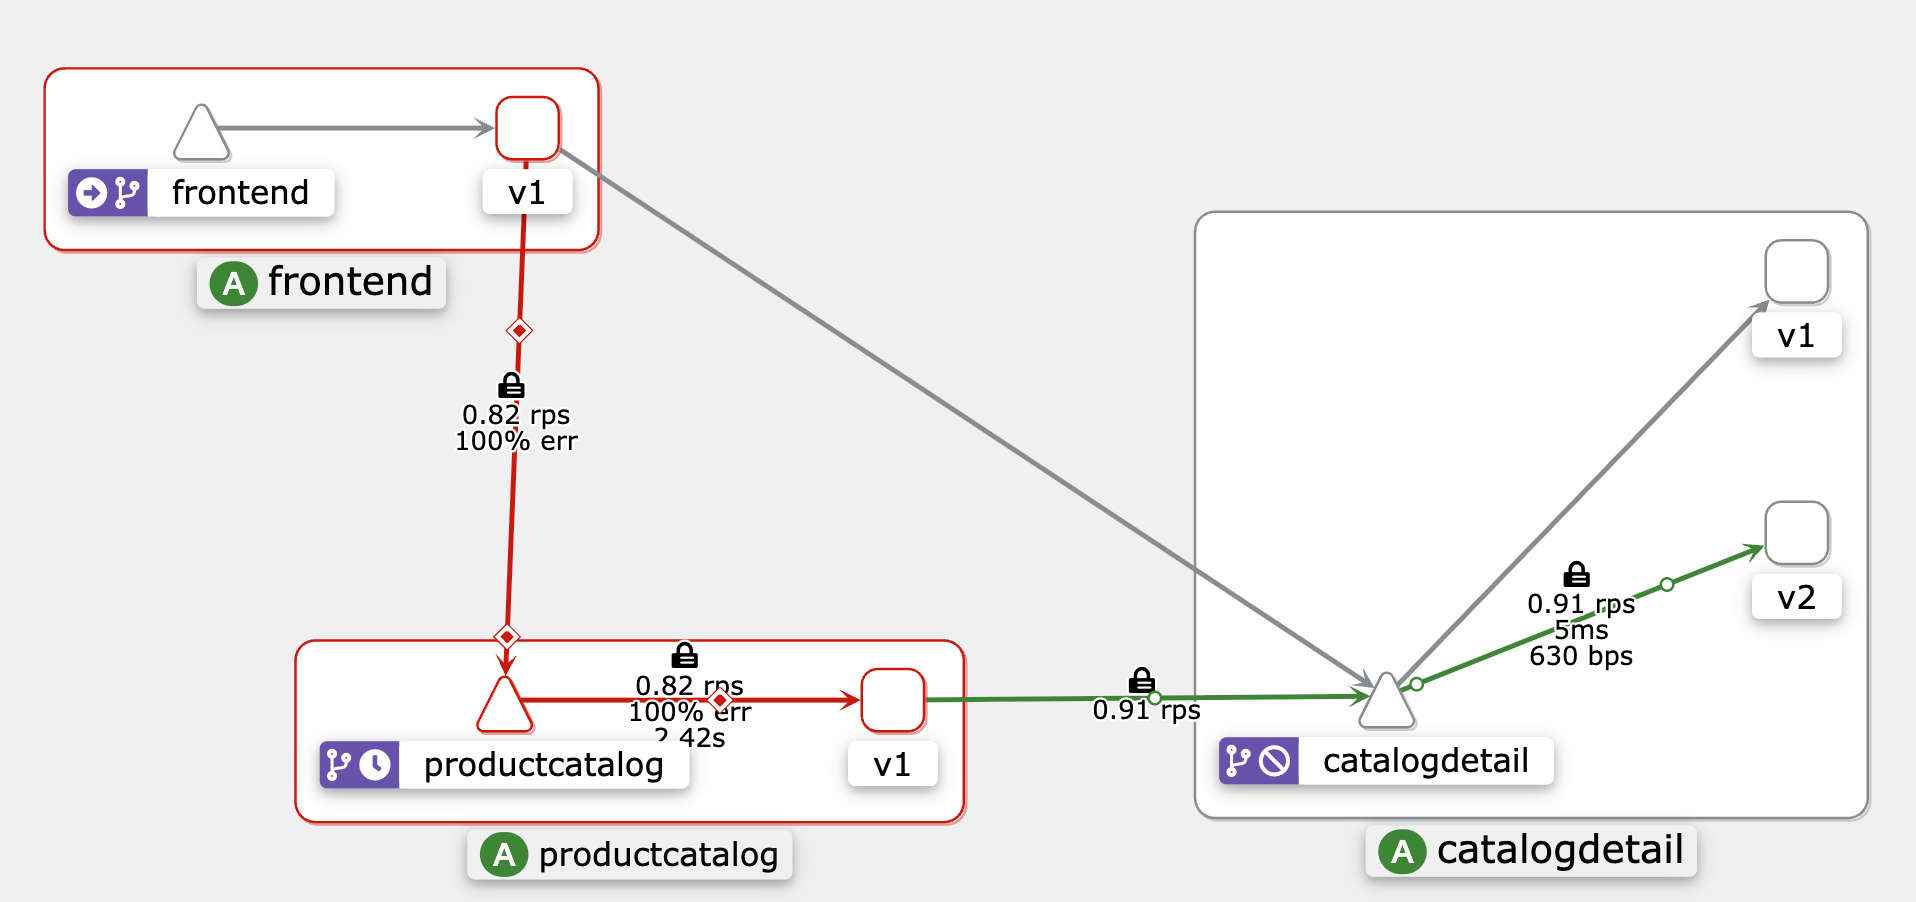
🎯 결론적으로, Istio의 타임아웃 기능은 마이크로서비스 아키텍처에서 서비스 간 요청의 시간을 관리함으로써 서비스의 복원력을 향상시킵니다. 이는 다운스트림 서비스의 응답을 무한정 기다리며 리소스를 소모하지 않도록 방지하여 리소스 고갈을 예방합니다. 타임아웃 설정은 응답하지 않는 다운스트림 서비스를 신속하게 감지하고 처리함으로써 장애를 격리하고 시스템의 안정성과 가용성을 향상시킵니다.
환경 초기화
초기 상태로 구성을 리셋하려면, timeouts-retries-circuitbreaking 디렉터리에서 다음 명령어를 실행하세요:
❯ kubectl apply -f ../../00-setup-mesh-resources/

destinationrule.networking.istio.io/catalogdetail unchanged
virtualservice.networking.istio.io/catalogdetail configured
virtualservice.networking.istio.io/frontend unchanged
virtualservice.networking.istio.io/productcatalog configured
🔁 Retries
Istio에서 재시도(Retries)는 실패한 요청에 대해 자동으로 다시 시도함으로써 시스템의 복원력을 향상시키는 기능입니다. 재시도 설정은 최초 호출이 실패할 경우 Envoy 프록시가 서비스에 연결을 시도할 최대 횟수를 지정합니다. 이는 네트워크 불안정이나 일시적인 서비스 장애와 같은 일시적인 실패를 처리하는 데 유용합니다.
테스트를 위한 구성 변경
productcatalog VirtualService에 대해 재시도 기능을 테스트하기 위해 다음과 같은 변경을 수행합니다:
- productcatalog VirtualService에 재시도 설정(2회 시도)을 추가합니다.
...
spec:
  ...
  http:
  ...
    retries:
      attempts: 2
..- productcatalog Deployment 수정
재시도 기능 테스트를 위해 productcatalog 배포 리소스를 수정하여, 컨테이너가 실제로 아무 작업도 하지 않고 1시간 동안 대기(sleep) 하도록 구성합니다. 이를 위해 다음 변경을 수행합니다:
✅ 변경 사항 요약:
-
Readiness Probe:
echo hello 명령을 사용하여 항상 성공하도록 설정 → 컨테이너가 즉시 준비됨으로 인식됨 -
Liveness Probe:
echo hello 명령을 사용하여 항상 성공하도록 설정 → 컨테이너가 즉시 살아있음으로 인식됨 -
Command 추가:
메인 프로세스가 sleep 3600 (1시간) 하도록 명시
📦 변경 적용 명령어:
현재 작업 디렉터리가
istio-on-eks/modules/03-network-resiliency/timeouts-retries-circuitbreaking
폴더라고 가정하고, 다음 명령어를 실행하여 배포 변경사항을 적용합니다:
❯ kubectl apply -f ./retries/
virtualservice.networking.istio.io/productcatalog configured

❯ kubectl get deployment -n workshop productcatalog -o json |
jq '.spec.template.spec.containers[0].readinessProbe={exec:{command:["sh","-c","echo hello"]}}
| .spec.template.spec.containers[0].livenessProbe={exec:{command:["sh","-c","echo hello"]}}
| .spec.template.spec.containers[0]+={command:["sh","-c","sleep 1h"]}' |
kubectl apply --force=true -f -
Warning: resource deployments/productcatalog is missing the kubectl.kubernetes.io/last-applied-configuration annotation which is required by kubectl apply. kubectl apply should only be used on resources created declaratively by either kubectl create --save-config or kubectl apply. The missing annotation will be patched automatically.
deployment.apps/productcatalog configured
productcatalog 서비스의 Envoy 로그를 디버그 모드로 활성화하려면 다음 명령어를 실행하세요:
🙋🏻♀️ 참고: 오류가 발생하면 새로운 터미널을 열어 다음 명령어를 실행하세요. istioctl이 경로에 포함되어 있는지 확인하고, 현재 디렉터리가 “istio-on-eks/modules/03-network-resiliency/timeouts-retries-circuitbreaking”인지 확인하세요.
❯ istioctl pc log --level debug -n workshop deploy/productcatalog
productcatalog-774479c47f-drxk8.workshop:
active loggers:
  admin: debug
  alternate_protocols_cache: debug
  aws: debug
  assert: debug
  backtrace: debug
  basic_auth: debug
  cache_filter: debug
  client: debug
  config: debug
  connection: debug
  conn_handler: debug
  compression: debug
  credential_injector: debug
  decompression: debug
  dns: debug
  dubbo: debug
  envoy_bug: debug
  ext_authz: debug
  ext_proc: debug
  rocketmq: debug
  file: debug
  filter: debug
  forward_proxy: debug
  geolocation: debug
  grpc: debug
  happy_eyeballs: debug
  hc: debug
  health_checker: debug
  http: debug
  http2: debug
  hystrix: debug
  init: debug
  io: debug
  jwt: debug
  kafka: debug
  key_value_store: debug
  lua: debug
  main: debug
  matcher: debug
  misc: debug
  mongo: debug
  multi_connection: debug
  oauth2: debug
  quic: debug
  quic_stream: debug
  pool: debug
  rate_limit_quota: debug
  rbac: debug
  rds: debug
  redis: debug
  router: debug
  runtime: debug
  stats: debug
  secret: debug
  tap: debug
  testing: debug
  thrift: debug
  tracing: debug
  upstream: debug
  udp: debug
  wasm: debug
  websocket: debug
  golang: debug
이제 productcatalog 컨테이너는 실제 서비스 응답 없이 1시간 동안 sleep 하므로, Istio가 재시도 설정을 통해 어떻게 동작하는지 관찰할 수 있습니다.
재시도(Retries) 기능을 로그에서 확인하려면 다음 명령어를 실행하세요:
kubectl -n workshop logs -l app=productcatalog -c istio-proxy -f |
grep "x-envoy-attempt-count"
새 터미널을 열고, 다음 명령어를 사용하여 메쉬 내에서 productcatalog 서비스에 curl 요청을 실행하세요:
❯ export FE_POD_NAME=$(kubectl get pods -n workshop -l app=frontend -o jsonpath='{.items[].metadata.name}')
❯ kubectl exec -it ${FE_POD_NAME} -n workshop -c frontend -- bash
curl http://productcatalog:5000/products/ -s -o /dev/null
root@frontend-66c78fb848-496c9:/usr/src/app#
이제 첫 번째 터미널에서 로그를 확인하면 재시도 시도가 출력되는 것을 볼 수 있을 것입니다.
❯ kubectl -n workshop logs -l app=productcatalog -c istio-proxy -f |
grep "x-envoy-attempt-count"
'x-envoy-attempt-count', '1'
'x-envoy-attempt-count', '1'
'x-envoy-attempt-count', '2'
'x-envoy-attempt-count', '2'
'x-envoy-attempt-count', '3'
'x-envoy-attempt-count', '3'
이 다이어그램은 Frontend Envoy 프록시가 초기 호출 실패 후 productcatalog VirtualService에 대해 2번 재시도하는 과정을 보여줍니다. 재시도 시도 후에도 요청이 성공하지 않으면 오류로 처리되어 Frontend 서비스로 반환됩니다.
요약하자면, 재시도 기능은 의도한 대로 작동합니다. 기록된 ‘x-envoy-attempt-count’ 값 3은 서비스에 대한 최초 연결 시도 1회와, productcatalog VirtualService 설정에 정의된 2회의 추가 재시도 시도를 포함합니다.
환경 초기화
timeouts-retries-circuitbreaking 디렉터리에서 다음 명령어를 실행하여 설정을 초기 상태로 되돌리세요:
❯ kubectl apply -f ../../00-setup-mesh-resources/

destinationrule.networking.istio.io/catalogdetail unchanged
virtualservice.networking.istio.io/catalogdetail unchanged
virtualservice.networking.istio.io/frontend unchanged
virtualservice.networking.istio.io/productcatalog configured
🛑 Circuit Breakers
서킷 브레이커(Circuit Breaker)는 Istio의 Envoy 프록시가 제공하는 또 다른 네트워크 복원력 기능입니다. 서킷 브레이커는 실패하는 서비스에 대한 지속적인 재시도를 막아 마이크로서비스 기반 시스템의 복원력을 높여줍니다. 문제 발생 시 과부하에 걸린 서비스를 보호하고 시스템이 점진적으로 성능을 저하시켜 장애를 완화하도록 돕습니다. 미리 정의한 실패 임계값에 도달하면 서킷 브레이커가 활성화되어 일시적으로 실패한 서비스로의 요청을 중단하고, 일정 시간 경과 후나 실패율이 감소하면 서킷 브레이커가 초기화되어 정상 요청 흐름이 재개됩니다.
기존의 catalogdetail 대상 규칙(Destination Rule)을 업데이트하여 서킷 브레이킹 설정을 적용하세요.
...
spec:
  ...
  trafficPolicy:
    connectionPool:
      tcp:
        maxConnections: 1
      http:
        http1MaxPendingRequests: 1
        maxRequestsPerConnection: 1
    outlierDetection:
      consecutive5xxErrors: 1
      interval: 1s
      baseEjectionTime: 3m
      maxEjectionPercent: 100

# This assumes that you are currently in the "istio-on-eks/modules/03-network-resiliency/timeouts-retries-circuitbreaking" folder

❯ kubectl apply -f ./circuitbreaking/
destinationrule.networking.istio.io/catalogdetail configured
connectionPool 설정의 일부로, 서비스는 최대 연결 수에 제한이 있으며 이 제한을 초과하는 연결은 대기열에 쌓입니다. 위 설정에서는 maxConnections 값이 1로 되어 있는데, 이 값을 변경해 최대 연결 수를 조절할 수 있습니다. 또한, 서비스로의 대기 중인 요청(pending requests)에 대한 최대값도 있으며, 이를 초과하는 요청은 거부됩니다. 위 설정에서는 http1MaxPendingRequests가 1로 되어 있어, 이 값을 수정해 제한을 변경할 수 있습니다.
outlierDetection 설정을 통해 Istio는 catalogdetail Envoy에서 서버 오류(5XX 코드)를 발생시키는 호스트를 감지하여, 해당 파드를 3분간 로드 밸런싱 풀에서 제외(eject)합니다.
서킷 브레이커 기능을 테스트하기 위해 fortio라는 부하 테스트 애플리케이션을 사용할 것입니다. 이를 위해 fortio 이미지를 기반으로 하는 단일 컨테이너가 포함된 파드를 실행할 예정입니다. 아래 명령어를 실행하여 workshop 네임스페이스에 fortio 파드를 생성하세요:
❯ kubectl run fortio --image=fortio/fortio:latest_release -n workshop --annotations='proxy.istio.io/config=proxyStatsMatcher:
  inclusionPrefixes:
  - "cluster.outbound"
  - "cluster_manager"
  - "listener_manager"
  - "server"
  - "cluster.xds-grpc"'
pod/fortio created
이제 fortio 파드 내부에서 catalogdetail 서비스에 단일 curl 요청을 테스트하세요:
❯ kubectl exec fortio -n workshop -c fortio -- /usr/bin/fortio \
curl http://catalogdetail.workshop.svc.cluster.local:3000/catalogDetail
요청이 성공하는 것을 다음과 같이 확인할 수 있습니다:
{"ts":1748631543.969905,"level":"info","r":1,"file":"scli.go","line":122,"msg":"Starting","command":"Φορτίο","version":"1.69.5 h1:h+42fJ1HF61Jj+WgPmC+C2wPtM5Ct8JLHSLDyEgGID4= go1.23.9 amd64 linux","go-max-procs":2}
{"version":"1","vendors":["ABC.com"]}HTTP/1.1 200 OK
x-powered-by: Express
content-type: application/json; charset=utf-8
content-length: 37
etag: W/"25-+DP7kANx3olb0HJqt5zDWgaO2Gg"
date: Fri, 30 May 2025 18:59:03 GMT
x-envoy-upstream-service-time: 8
server: envoy
서킷 브레이커 작동 테스트
두 개의 동시 연결(-c 2)로, 총 20개의 요청(-n 20)을 catalogdetail 서비스에 보내면서 서킷 브레이커 기능을 테스트할 수 있습니다:
❯ kubectl exec fortio -n workshop -c fortio -- \
/usr/bin/fortio load -c 2 -qps 0 -n 20 -loglevel Warning \
http://catalogdetail.workshop.svc.cluster.local:3000/catalogDetail
출력 결과는 다음과 비슷해야 합니다:
{"ts":1748631707.474741,"level":"info","r":1,"file":"logger.go","line":298,"msg":"Log level is now 3 Warning (was 2 Info)"}
Fortio 1.69.5 running at 0 queries per second, 2->2 procs, for 20 calls: http://catalogdetail.workshop.svc.cluster.local:3000/catalogDetail
Starting at max qps with 2 thread(s) [gomax 2] for exactly 20 calls (10 per thread + 0)
{"ts":1748631707.503428,"level":"warn","r":29,"file":"http_client.go","line":1151,"msg":"Non ok http code","code":503,"status":"HTTP/1.1 503","thread":0,"run":0}
{"ts":1748631707.514167,"level":"warn","r":30,"file":"http_client.go","line":1151,"msg":"Non ok http code","code":503,"status":"HTTP/1.1 503","thread":1,"run":0}
{"ts":1748631707.527287,"level":"warn","r":29,"file":"http_client.go","line":1151,"msg":"Non ok http code","code":503,"status":"HTTP/1.1 503","thread":0,"run":0}
{"ts":1748631707.548044,"level":"warn","r":30,"file":"http_client.go","line":1151,"msg":"Non ok http code","code":503,"status":"HTTP/1.1 503","thread":1,"run":0}
{"ts":1748631707.558410,"level":"warn","r":30,"file":"http_client.go","line":1151,"msg":"Non ok http code","code":503,"status":"HTTP/1.1 503","thread":1,"run":0}
Ended after 76.549371ms : 20 calls. qps=261.27
Aggregated Function Time : count 20 avg 0.0069665632 +/- 0.005945 min 0.000406698 max 0.02344648 sum 0.139331264
# range, mid point, percentile, count
>= 0.000406698 <= 0.001 , 0.000703349 , 10.00, 2
> 0.002 <= 0.003 , 0.0025 , 25.00, 3
> 0.003 <= 0.004 , 0.0035 , 55.00, 6
> 0.004 <= 0.005 , 0.0045 , 60.00, 1
> 0.005 <= 0.006 , 0.0055 , 65.00, 1
> 0.009 <= 0.01 , 0.0095 , 70.00, 1
> 0.01 <= 0.011 , 0.0105 , 75.00, 1
> 0.012 <= 0.014 , 0.013 , 85.00, 2
> 0.014 <= 0.016 , 0.015 , 95.00, 2
> 0.02 <= 0.0234465 , 0.0217232 , 100.00, 1
# target 50% 0.00383333
# target 75% 0.011
# target 90% 0.015
# target 99% 0.0227572
# target 99.9% 0.0233776
Error cases : count 5 avg 0.004186978 +/- 0.003497 min 0.000406698 max 0.010075836 sum 0.02093489
# range, mid point, percentile, count
>= 0.000406698 <= 0.001 , 0.000703349 , 40.00, 2
> 0.004 <= 0.005 , 0.0045 , 60.00, 1
> 0.005 <= 0.006 , 0.0055 , 80.00, 1
> 0.01 <= 0.0100758 , 0.0100379 , 100.00, 1
# target 50% 0.0045
# target 75% 0.00575
# target 90% 0.0100379
# target 99% 0.010072
# target 99.9% 0.0100755
# Socket and IP used for each connection:
[0]   3 socket used, resolved to 172.20.253.99:3000, connection timing : count 3 avg 0.00024726533 +/- 0.0001669 min 0.000124312 max 0.000483199 sum 0.000741796
[1]   4 socket used, resolved to 172.20.253.99:3000, connection timing : count 4 avg 0.000300832 +/- 0.0001511 min 0.000130838 max 0.000451682 sum 0.001203328
Connection time (s) : count 7 avg 0.00027787486 +/- 0.0001603 min 0.000124312 max 0.000483199 sum 0.001945124
Sockets used: 7 (for perfect keepalive, would be 2)
Uniform: false, Jitter: false, Catchup allowed: true
IP addresses distribution:
172.20.253.99:3000: 7
Code 200 : 15 (75.0 %)
Code 503 : 5 (25.0 %)
Response Header Sizes : count 20 avg 177.8 +/- 102.7 min 0 max 238 sum 3556
Response Body/Total Sizes : count 20 avg 265.8 +/- 14.32 min 241 max 275 sum 5316
All done 20 calls (plus 0 warmup) 6.967 ms avg, 261.3 qps
대부분의 요청이 성공했으며, 일부 예외가 있음을 확인할 수 있습니다. istio-proxy가 어느 정도 유연성을 허용하기 때문입니다.
Code 200 : 15 (75.0 %)
Code 503 : 5 (25.0 %)
이제 동시 연결 수를 3으로, 호출 횟수를 30으로 늘려서 같은 명령어를 다시 실행하세요.
❯ kubectl exec fortio -n workshop -c fortio -- \
/usr/bin/fortio load -c 3 -qps 0 -n 30 -loglevel Warning \
http://catalogdetail.workshop.svc.cluster.local:3000/catalogDetail
출력 결과는 다음과 비슷해야 합니다:
{"ts":1748631927.204709,"level":"info","r":1,"file":"logger.go","line":298,"msg":"Log level is now 3 Warning (was 2 Info)"}
Fortio 1.69.5 running at 0 queries per second, 2->2 procs, for 30 calls: http://catalogdetail.workshop.svc.cluster.local:3000/catalogDetail
Starting at max qps with 3 thread(s) [gomax 2] for exactly 30 calls (10 per thread + 0)
{"ts":1748631927.235931,"level":"warn","r":27,"file":"http_client.go","line":1151,"msg":"Non ok http code","code":503,"status":"HTTP/1.1 503","thread":0,"run":0}
{"ts":1748631927.236387,"level":"warn","r":28,"file":"http_client.go","line":1151,"msg":"Non ok http code","code":503,"status":"HTTP/1.1 503","thread":1,"run":0}
{"ts":1748631927.244810,"level":"warn","r":27,"file":"http_client.go","line":1151,"msg":"Non ok http code","code":503,"status":"HTTP/1.1 503","thread":0,"run":0}
{"ts":1748631927.246899,"level":"warn","r":29,"file":"http_client.go","line":1151,"msg":"Non ok http code","code":503,"status":"HTTP/1.1 503","thread":2,"run":0}
{"ts":1748631927.254780,"level":"warn","r":29,"file":"http_client.go","line":1151,"msg":"Non ok http code","code":503,"status":"HTTP/1.1 503","thread":2,"run":0}
{"ts":1748631927.255564,"level":"warn","r":27,"file":"http_client.go","line":1151,"msg":"Non ok http code","code":503,"status":"HTTP/1.1 503","thread":0,"run":0}
{"ts":1748631927.265278,"level":"warn","r":29,"file":"http_client.go","line":1151,"msg":"Non ok http code","code":503,"status":"HTTP/1.1 503","thread":2,"run":0}
{"ts":1748631927.266311,"level":"warn","r":28,"file":"http_client.go","line":1151,"msg":"Non ok http code","code":503,"status":"HTTP/1.1 503","thread":1,"run":0}
{"ts":1748631927.274782,"level":"warn","r":28,"file":"http_client.go","line":1151,"msg":"Non ok http code","code":503,"status":"HTTP/1.1 503","thread":1,"run":0}
{"ts":1748631927.275826,"level":"warn","r":27,"file":"http_client.go","line":1151,"msg":"Non ok http code","code":503,"status":"HTTP/1.1 503","thread":0,"run":0}
{"ts":1748631927.284459,"level":"warn","r":27,"file":"http_client.go","line":1151,"msg":"Non ok http code","code":503,"status":"HTTP/1.1 503","thread":0,"run":0}
Ended after 64.730614ms : 30 calls. qps=463.46
Aggregated Function Time : count 30 avg 0.0052103155 +/- 0.003993 min 0.000329154 max 0.013819628 sum 0.156309466
# range, mid point, percentile, count
>= 0.000329154 <= 0.001 , 0.000664577 , 10.00, 3
> 0.001 <= 0.002 , 0.0015 , 16.67, 2
> 0.002 <= 0.003 , 0.0025 , 43.33, 8
> 0.003 <= 0.004 , 0.0035 , 60.00, 5
> 0.004 <= 0.005 , 0.0045 , 66.67, 2
> 0.007 <= 0.008 , 0.0075 , 70.00, 1
> 0.008 <= 0.009 , 0.0085 , 76.67, 2
> 0.009 <= 0.01 , 0.0095 , 80.00, 1
> 0.01 <= 0.011 , 0.0105 , 86.67, 2
> 0.011 <= 0.012 , 0.0115 , 90.00, 1
> 0.012 <= 0.0138196 , 0.0129098 , 100.00, 3
# target 50% 0.0034
# target 75% 0.00875
# target 90% 0.012
# target 99% 0.0136377
# target 99.9% 0.0138014
Error cases : count 11 avg 0.0053978407 +/- 0.004212 min 0.000329154 max 0.010369055 sum 0.059376248
# range, mid point, percentile, count
>= 0.000329154 <= 0.001 , 0.000664577 , 27.27, 3
> 0.001 <= 0.002 , 0.0015 , 45.45, 2
> 0.007 <= 0.008 , 0.0075 , 54.55, 1
> 0.008 <= 0.009 , 0.0085 , 72.73, 2
> 0.009 <= 0.01 , 0.0095 , 81.82, 1
> 0.01 <= 0.0103691 , 0.0101845 , 100.00, 2
# target 50% 0.0075
# target 75% 0.00925
# target 90% 0.0101661
# target 99% 0.0103488
# target 99.9% 0.010367
# Socket and IP used for each connection:
[0]   6 socket used, resolved to 172.20.253.99:3000, connection timing : count 6 avg 0.000167786 +/- 8.315e-05 min 9.8519e-05 max 0.000332254 sum 0.001006716
[1]   3 socket used, resolved to 172.20.253.99:3000, connection timing : count 3 avg 0.000140093 +/- 3.913e-05 min 8.6505e-05 max 0.000178861 sum 0.000420279
[2]   4 socket used, resolved to 172.20.253.99:3000, connection timing : count 4 avg 0.0001433115 +/- 0.0001061 min 5.1031e-05 max 0.000321494 sum 0.000573246
Connection time (s) : count 13 avg 0.00015386469 +/- 8.47e-05 min 5.1031e-05 max 0.000332254 sum 0.002000241
Sockets used: 13 (for perfect keepalive, would be 3)
Uniform: false, Jitter: false, Catchup allowed: true
IP addresses distribution:
172.20.253.99:3000: 13
Code 200 : 19 (63.3 %)
Code 503 : 11 (36.7 %)
Response Header Sizes : count 30 avg 150.1 +/- 114.2 min 0 max 237 sum 4503
Response Body/Total Sizes : count 30 avg 261.9 +/- 15.9 min 241 max 274 sum 7857
All done 30 calls (plus 0 warmup) 5.210 ms avg, 463.5 qps
catalogdetail 마이크로서비스로의 트래픽이 증가함에 따라 서킷 브레이커 기능이 작동하기 시작하는 것을 확인할 수 있습니다. 이제 요청의 약 37%만 성공했으며, 나머지 63%는 예상대로 서킷 브레이커에 의해 차단되었습니다.
Code 200 : 19 (63.3 %)
Code 503 : 11 (36.7 %)
이제 istio-proxy에 쿼리를 실행하여 서킷 브레이킹 대상으로 표시된 요청들의 통계 정보를 확인하세요.
kubectl exec fortio -n workshop -c istio-proxy -- pilot-agent request GET stats | grep catalogdetail | grep pending출력 결과는 다음과 비슷해야 합니다:
cluster.outbound|3000|v1|catalogdetail.workshop.svc.cluster.local.circuit_breakers.default.remaining_pending: 1
cluster.outbound|3000|v1|catalogdetail.workshop.svc.cluster.local.circuit_breakers.default.rq_pending_open: 0
cluster.outbound|3000|v1|catalogdetail.workshop.svc.cluster.local.circuit_breakers.high.rq_pending_open: 0
cluster.outbound|3000|v1|catalogdetail.workshop.svc.cluster.local.upstream_rq_pending_active: 0
cluster.outbound|3000|v1|catalogdetail.workshop.svc.cluster.local.upstream_rq_pending_failure_eject: 0
cluster.outbound|3000|v1|catalogdetail.workshop.svc.cluster.local.upstream_rq_pending_overflow: 0
cluster.outbound|3000|v1|catalogdetail.workshop.svc.cluster.local.upstream_rq_pending_total: 0
cluster.outbound|3000|v2|catalogdetail.workshop.svc.cluster.local.circuit_breakers.default.remaining_pending: 1
cluster.outbound|3000|v2|catalogdetail.workshop.svc.cluster.local.circuit_breakers.default.rq_pending_open: 0
cluster.outbound|3000|v2|catalogdetail.workshop.svc.cluster.local.circuit_breakers.high.rq_pending_open: 0
cluster.outbound|3000|v2|catalogdetail.workshop.svc.cluster.local.upstream_rq_pending_active: 0
cluster.outbound|3000|v2|catalogdetail.workshop.svc.cluster.local.upstream_rq_pending_failure_eject: 0
cluster.outbound|3000|v2|catalogdetail.workshop.svc.cluster.local.upstream_rq_pending_overflow: 0
cluster.outbound|3000|v2|catalogdetail.workshop.svc.cluster.local.upstream_rq_pending_total: 0
cluster.outbound|3000||catalogdetail.workshop.svc.cluster.local.circuit_breakers.default.remaining_pending: 1
cluster.outbound|3000||catalogdetail.workshop.svc.cluster.local.circuit_breakers.default.rq_pending_open: 0
cluster.outbound|3000||catalogdetail.workshop.svc.cluster.local.circuit_breakers.high.rq_pending_open: 0
cluster.outbound|3000||catalogdetail.workshop.svc.cluster.local.upstream_rq_pending_active: 0
cluster.outbound|3000||catalogdetail.workshop.svc.cluster.local.upstream_rq_pending_failure_eject: 0
cluster.outbound|3000||catalogdetail.workshop.svc.cluster.local.upstream_rq_pending_overflow: 16
cluster.outbound|3000||catalogdetail.workshop.svc.cluster.local.upstream_rq_pending_total: 35
요약하자면, 위 출력 결과에서 upstream_rq_pending_overflow 값이 16 임을 알 수 있습니다. 이는 지금까지 16개의 호출이 서킷 브레이킹 대상으로 지정되었음을 의미하며, catalogdetail DestinationRule에 설정한 서킷 브레이커 구성이 의도한 대로 효과적으로 작동했음을 명확히 보여줍니다.
환경 초기화
다음 명령어로 fortio 파드를 삭제한 후, 초기 상태 설정에서 수행한 동일한 단계를 실행하여 환경을 리셋하세요
❯ kubectl delete pod fortio -n workshop
pod "fortio" deleted

❯ kubectl apply -f ../../00-setup-mesh-resources/
destinationrule.networking.istio.io/catalogdetail configured
virtualservice.networking.istio.io/catalogdetail unchanged
virtualservice.networking.istio.io/frontend unchanged
virtualservice.networking.istio.io/productcatalog unchanged
🎛️ Rate Limit
로컬 레이트 리밋(Local Rate Limiting)은 Istio에서 클러스터 내 특정 서비스나 서비스 버전별로 트래픽 속도를 제어할 수 있게 해줍니다. 이를 통해 특정 서비스나 엔드포인트에 대한 요청 속도를 관리할 수 있습니다.
글로벌 레이트 리밋(Global Rate Limiting)은 Istio 서비스 메시 전체 또는 특정 게이트웨이에 걸쳐 요청 속도 제한을 적용합니다. 글로벌 레이트 리밋은 클러스터 내 모든 서비스가 공유하는 전역 gRPC 레이트 리밋 서비스를 사용하여 메시 전체에 제한을 강제합니다. 이 서비스는 보통 Redis 데이터베이스와 같은 외부 컴포넌트를 필요로 합니다.
로컬 레이트 리밋은 글로벌 레이트 리밋 서비스에 부하를 줄이기 위해 함께 사용될 수 있습니다.
참고: 이 서브모듈은 Git 저장소 내 03-network-resiliency 모듈 아래 rate-limit 서브모듈 위치에서 작업할 것을 전제로 합니다.
# This assumes that you are currently in "istio-on-eks/modules/03-network-resiliency" folder
cd ../rate-limiting
Local Rate Limiting
로컬 레이트 리밋(Local Rate Limit)을 적용하려면, 해당 애플리케이션 내 특정 서비스에 EnvoyFilter를 적용해야 합니다. 예제에서는 prodcatalog 서비스에 제한을 적용할 것입니다.
local-ratelimit.yaml 파일 내용 요약:
- HTTP_FILTER 패치는 envoy.filters.http.local_ratelimit 로컬 Envoy 필터를 HTTP 연결 관리자 필터 체인에 삽입합니다.
- 로컬 레이트 리밋 필터는 토큰 버킷(token bucket) 방식으로 분당 10 요청을 허용하도록 설정되어 있습니다.
- 요청이 차단될 경우 x-local-rate-limit 응답 헤더를 추가하도록 필터가 구성되어 있습니다.
prodcatalog 서비스에 로컬 레이트 리밋 적용 명령:
❯ kubectl apply -f ./local-ratelimit/local-ratelimit.yaml
Warning: EnvoyFilter exposes internal implementation details that may change at any time. Prefer other APIs if possible, and exercise extreme caution, especially around upgrades.
envoyfilter.networking.istio.io/filter-local-ratelimit-svc created
레이트 리미터가 작동하는지 테스트하려면, frontend pod에 접속한 후 prodcatalog 서비스로 요청을 보내 레이트 리미터를 트리거하세요.
POD_NAME=$(kubectl get pod -l app=frontend -o jsonpath='{.items[0].metadata.name}' -n workshop)

kubectl exec $POD_NAME -n workshop -c frontend -- \
bash -c "for i in {1..20}; do curl -sI http://productcatalog:5000/products/; done"
20개의 요청이 1분 이내에 전송되었기 때문에, 서비스가 처음 10개의 요청을 처리한 후에는 HTTP 429 응답 코드가 반환되기 시작합니다.
성공한 요청은 다음과 같은 출력을 반환합니다:
HTTP/1.1 200 OK
x-powered-by: Express
content-type: text/html; charset=utf-8
content-length: 1203
etag: W/"4b3-KO/ZeBhhZHNNKPbDwPiV/CU2EDU"
date: Fri, 30 May 2025 19:15:43 GMT
x-envoy-upstream-service-time: 34
server: istio-envoy
레이트 리밋이 적용된 요청은 다음과 같은 출력을 반환합니다:
HTTP/1.1 429 Too Many Requests
x-local-rate-limit: true
content-length: 18
content-type: text/plain
x-ratelimit-limit: 10
x-ratelimit-remaining: 0
x-ratelimit-reset: 27
date: Fri, 30 May 2025 19:17:48 GMT
server: envoy
x-envoy-upstream-service-time: 1
마찬가지로 -I 플래그 없이 동일한 셸 명령을 실행하면, 레이트 리밋이 적용된 요청에 대해 local_rate_limited 응답이 표시되기 시작합니다. 이러한 레이트 리밋 요청은 다음과 같은 형태로 나타납니다:
{
    "products": {},
    "details": {
        "version": "2",             <---------- Successful response to the request
        "vendors": [
            "ABC.com, XYZ.com"
        ]
    }
}

local_rate_limited                  <---------- Rate limited requests
Global Rate Limiting
⚙️ 1단계 – 글로벌 레이트 리밋 서비스 설정
글로벌 레이트 리밋을 사용하려면 Envoy의 레이트 리밋 서비스 프로토콜을 구현하는 중앙 레이트 리밋 서비스가 필요합니다.
# ConfigMap을 통해 글로벌 레이트 리밋 설정 적용
❯ kubectl apply -f ./global-ratelimit/global-ratelimit-config.yaml
configmap/ratelimit-config created
위 설정에서는 / 경로에 대해 분당 5건, 기타 모든 요청에 대해 분당 100건으로 제한합니다.
Redis 기반 글로벌 레이트 리밋 서비스 배포
❯ kubectl apply -f ./global-ratelimit/global-ratelimit-service.yaml

serviceaccount/redis created
service/redis created
deployment.apps/redis created
service/ratelimit created
deployment.apps/ratelimit created
이 파일에는 Redis 기반의 외부 레이트 리밋 서비스에 대한 Deployment와 Service가 정의되어 있습니다.
이 Redis 기반 외부 서비스는 도메인별 요청 수를 추적하며, 글로벌 레이트 리밋 기능에 필수입니다.
⚙️ 2단계 – 글로벌 레이트 리밋 활성화
Redis와 레이트 리밋 서비스가 배포되었다면, IngressGateway에 두 개의 EnvoyFilter를 적용해 글로벌 레이트 리밋을 활성화할 수 있습니다.
- 첫 번째 EnvoyFilter (예: filter-ratelimit.yaml)는 Envoy의 글로벌 레이트 리밋 필터를 활성화합니다.
❯ kubectl apply -f ./global-ratelimit/filter-ratelimit.yaml
Warning: EnvoyFilter exposes internal implementation details that may change at any time. Prefer other APIs if possible, and exercise extreme caution, especially around upgrades.
envoyfilter.networking.istio.io/filter-ratelimit created- 두 번째 EnvoyFilter는 레이트 리미팅이 적용될 라우트 설정(route configuration) 을 정의합니다.
filter-ratelimit-svc.yaml 파일을 살펴보면, 해당 설정은 가상 호스트(virtual host) 로부터의 모든 라우트(route)에 대해 레이트 리밋 액션(rate limit actions) 을 추가합니다.
❯ kubectl apply -f ./global-ratelimit/filter-ratelimit-svc.yaml

Warning: EnvoyFilter exposes internal implementation details that may change at any time. Prefer other APIs if possible, and exercise extreme caution, especially around upgrades.
envoyfilter.networking.istio.io/filter-ratelimit-svc created
글로벌 레이트 리밋(Global Rate Limit)이 제대로 작동하는지 테스트하려면, 터미널 세션에서 다음 명령어를 실행하세요:
ISTIO_INGRESS_URL=$(kubectl get svc istio-ingress -n istio-ingress -o jsonpath='{.status.loadBalancer.ingress[*].hostname}')

for i in {1..6}; do curl -Is $ISTIO_INGRESS_URL; done
출력 결과에서 처음 다섯 개의 요청은 다음과 유사한 출력이 나타나는 것을 확인할 수 있습니다:
HTTP/1.1 200 OK
x-powered-by: Express
content-type: text/html; charset=utf-8
content-length: 1203
etag: W/"4b3-KO/ZeBhhZHNNKPbDwPiV/CU2EDU"
date: Fri, 30 May 2025 19:21:53 GMT
x-envoy-upstream-service-time: 34
server: istio-envoy
그리고 마지막 요청은 다음과 유사한 출력이 나타나야 합니다:
HTTP/1.1 429 Too Many Requests
x-envoy-ratelimited: true
date: Fri, 30 May 2025 19:23:51 GMT
server: istio-envoy
transfer-encoding: chunked
이러한 동작은 글로벌 속도 제한(Global Rate Limiting)이 적용되었기 때문에 나타납니다. / 컨텍스트 경로에 대해 분당 최대 5개의 요청만 허용되도록 설정되어 있습니다.
환경 초기화
모든 속도 제한 구성 및 서비스를 제거하려면 다음 명령을 실행하세요:
❯ kubectl delete -f ./global-ratelimit/
envoyfilter.networking.istio.io "filter-ratelimit-svc" deleted
envoyfilter.networking.istio.io "filter-ratelimit" deleted
configmap "ratelimit-config" deleted
serviceaccount "redis" deleted
service "redis" deleted
deployment.apps "redis" deleted
service "ratelimit" deleted
deployment.apps "ratelimit" deleted

❯ kubectl delete -f ./local-ratelimit/
envoyfilter.networking.istio.io "filter-local-ratelimit-svc" deleted
🧹 실습자원 삭제
Amazon EKS 환경을 정리하고 배포한 서비스를 제거하려면 다음 명령어들을 순서대로 실행하세요:
❯ cd istio-on-eks/modules/01-getting-started
❯ helm uninstall mesh-basic -n workshop
❯ kubectl delete namespace workshop
❯ cd ../../../istio-on-eks/terraform-blueprint/sidecar/
❯ terraform destroy -target='module.eks_blueprints_addons' --auto-approve
❯ terraform destroy -target='module.eks' --auto-approve
❯ AWS 콘솔에서 NLB와 TargetGroup 수동 삭제
❯ terraform destroy -target='module.vpc' --auto-approve
❯ terraform destroy -auto-approve 🧑🏻💻 결론
이번 블로그 포스트에서는 Amazon EKS 위의 Istio가 마이크로서비스의 네트워크 복원력(레질리언스)을 어떻게 향상시키는지 살펴보았습니다. 타임아웃, 재시도(Retries), 서킷 브레이커(Circuit Breakers), 속도 제한(Rate Limiting), 그리고 장애 주입(Fault Injection) 같은 핵심 기능들을 활용해, Istio는 장애나 지연이 발생하는 상황에서도 서비스 간 안정적이고 빠른 통신을 유지할 수 있도록 돕습니다.
이러한 기능들은 국지적인 문제들이 전체 시스템 장애로 확산되는 것을 방지하는 데 매우 중요합니다. 무엇보다도, Istio는 애플리케이션 코드를 변경하지 않고도 이러한 복원력을 인프라 계층에서 제공하기 때문에 개발자들은 비즈니스 로직에 집중할 수 있습니다.
네트워크 복원력에 관한 이번 포스트를 마무리하겠습니다.