
Elastic APM
모니터링을 위하여 FastAPI에 Elastic APM 을 적용한 방법을 기록한 글입니다.
Elastic APM 적용 해보기 - #2. 장점 및 Newrelic 비교
위 사람인에서 적용한 글을 보시면 도움이 되실겁니다.
Docker-compose 설정
version: '3.8'

services:

  apm-server:
    image: docker.elastic.co/apm/apm-server:7.14.0
    container_name: "apm-server"
    depends_on:
      elasticsearch:
        condition: service_healthy
      kibana:
        condition: service_healthy
    cap_add: ["CHOWN", "DAC_OVERRIDE", "SETGID", "SETUID"]
    cap_drop: ["ALL"]
    ports:
    - 8200:8200
    command: >
        apm-server -e
          -E apm-server.rum.enabled=true
          -E setup.kibana.host=kibana:5601
          -E setup.template.settings.index.number_of_replicas=0
          -E apm-server.kibana.enabled=true
          -E apm-server.kibana.host=kibana:5601
          -E output.elasticsearch.hosts=["elasticsearch:9200"]
    healthcheck:
      interval: 10s
      retries: 12
      test: curl --write-out 'HTTP %{http_code}' --fail --silent --output /dev/null http://localhost:8200/

  elasticsearch:
    image: docker.elastic.co/elasticsearch/elasticsearch:7.14.0
    container_name: "elasticsearch"
    environment:
    - bootstrap.memory_lock=true
    - cluster.name=docker-cluster
    - cluster.routing.allocation.disk.threshold_enabled=false
    - discovery.type=single-node
    - ES_JAVA_OPTS=-XX:UseAVX=2 -Xms1g -Xmx1g
    ulimits:
      memlock:
        hard: -1
        soft: -1
    volumes:
    - esdata:/usr/share/elasticsearch/data
    ports:
    - 9200:9200
    healthcheck:
      interval: 20s
      retries: 10
      test: curl -s http://localhost:9200/_cluster/health | grep -vq '"status":"red"'

  kibana:
    image: docker.elastic.co/kibana/kibana:7.14.0
    container_name: "kibana"
    depends_on:
      elasticsearch:
        condition: service_healthy
    environment:
      ELASTICSEARCH_URL: http://elasticsearch:9200
      ELASTICSEARCH_HOSTS: http://elasticsearch:9200
    ports:
    - 5601:5601
    healthcheck:
      interval: 10s
      retries: 20
      test: curl --write-out 'HTTP %{http_code}' --fail --silent --output /dev/null http://localhost:5601/api/status

volumes:
  esdata:
    driver: local
python module 설치
pip install elastic-apmFastAPI 설정
💡 Elastic APM의 최적화를 위한 설정에 대한 설명은 아래 주소에서 확인하실 수 있습니다.
   성능에 영향을 미치는 주요 설정은 데이터 수집 주기라고 생각이 되는데
   TRANSACTION_MAX_SPANS, STACK_TRACE_LIMIT 이 둘의 수치를 조정하면 됩니다.(default 500)
https://medium.com/squad-engineering/how-to-optimize-elastic-apm-6f7f6d58bed5
from elasticapm.contrib.starlette import make_apm_client, ElasticAPM
# Elastic APM
# https://medium.com/squad-engineering/how-to-optimize-elastic-apm-6f7f6d58bed5
apm_config = {
"SERVICE_NAME": "laplace",
"SERVER_URL": "http://apm-server:8200",
"ENVIRONMENT": "dev",
"GLOBAL_LABELS": "platform=Platform, application=Application",
"TRANSACTION_MAX_SPANS": 250,
"STACK_TRACE_LIMIT": 250,
"TRANSACTION_SAMPLE_RATE": 0.5,
"APTURE_HEADERS": "false"
}
apm = make_apm_client(apm_config)
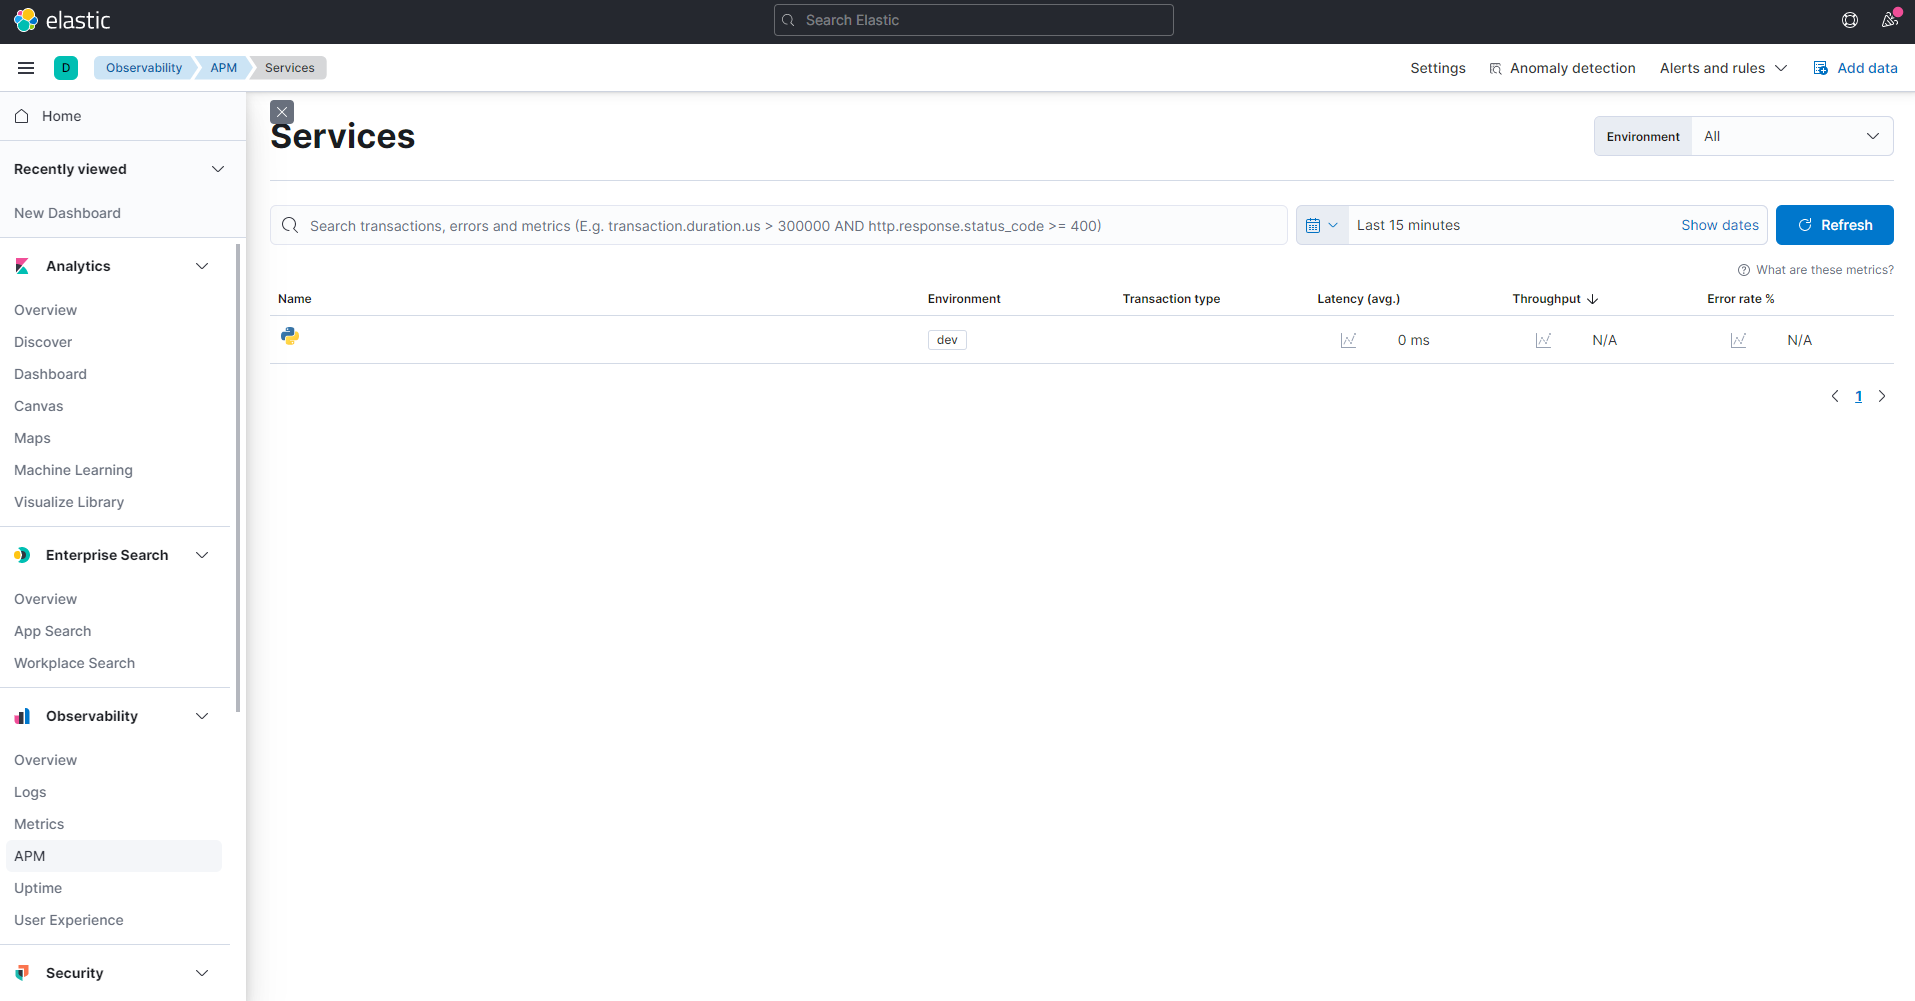
app.add_middleware(ElasticAPM, client=apm)Kibana 주소로 들어가신후 왼쪽 사이드바에서 Observability 메뉴의 APM항목을 가시면 아래 이미지 처럼 Services에 나타나게 됩니다.
참고자료
https://www.elastic.co/guide/en/apm/get-started/current/quick-start-overview.html
https://www.elastic.co/guide/en/apm/agent/python/master/starlette-support.html