Java Stream 병렬 처리 - 2 (반복문 vs 순차스트림 vs 병렬스트림, IntelliJ Plugin으로 성능 계산/비교 하기)

이전 시간에는 병렬 스트림에 대한 얘기를 해보았습니다.
이제는 반복문 vs 순차 스트림 vs 병렬 스트림
성능비교를 안해볼 수가 없겠죠??!!
이번에는 IntelliJ IDEA의 jmh 플러그인으로 실험해볼 것입니다!
간단하게 메이븐 프로젝트 하나 만들고 가겠습니다!
<?xml version="1.0" encoding="UTF-8"?>
<project xmlns="http://maven.apache.org/POM/4.0.0"
         xmlns:xsi="http://www.w3.org/2001/XMLSchema-instance"
         xsi:schemaLocation="http://maven.apache.org/POM/4.0.0 http://maven.apache.org/xsd/maven-4.0.0.xsd">
    <modelVersion>4.0.0</modelVersion>

    <groupId>org.example</groupId>
    <artifactId>modernjavamvn</artifactId>
    <version>1.0-SNAPSHOT</version>

    <properties>
        <maven.compiler.source>11</maven.compiler.source>
        <maven.compiler.target>11</maven.compiler.target>
    </properties>

    <dependencies>

        <!-- https://mvnrepository.com/artifact/org.openjdk.jmh/jmh-core-->
        <dependency>
            <groupId>org.openjdk.jmh</groupId>
            <artifactId>jmh-core</artifactId>
            <version>1.29</version>
        </dependency>

        <!-- https://mvnrepository.com/artifact/org.openjdk.jmh/jmh-generator-annprocess-->
        <dependency>
            <groupId>org.openjdk.jmh</groupId>
            <artifactId>jmh-generator-annprocess</artifactId>
            <version>1.29</version>
            <scope>test</scope>
        </dependency>
    </dependencies>

</project>
그리고 적당한 위치에 클래스파일 하나 만들어주시고요.
package stream.parallel;

import org.openjdk.jmh.annotations.*;

import java.util.concurrent.TimeUnit;
import java.util.stream.Stream;

@State(value = Scope.Benchmark)
@BenchmarkMode(Mode.AverageTime) // 벤치마크 대상 메서드를 실행하는데 걸린 평균 시간 측정
@OutputTimeUnit(TimeUnit.MILLISECONDS) // 벤치마크 결과를 밀리초 단위로 출력
@Fork(value = 2, jvmArgs = {"-Xms1G", "-Xmx1G"}) // 초기 4GB의 힙공간을 부여(Xms) 그리고 4GB 단위로 힙 공간을 늘린다.(Xmx)
public class ParallelStreamBenchMark {
    private static final long N = 100000L;

    @Benchmark  // 벤치마크 대상 메서드
    public long sequentialSum() {
        return Stream.iterate(1L, i -> i + 1).limit(N)
                .reduce(0L, Long::sum);
    }

    @TearDown(Level.Invocation) // 매 번 벤치마크를 실행한 다음에는 GC 동작 시도
    public void tearDown() {
        System.gc();
    }
}
그리고 BenchMark를 실행할 Main 클래스도 하나 생성해주세용.
import org.openjdk.jmh.runner.Runner;
import org.openjdk.jmh.runner.RunnerException;
import org.openjdk.jmh.runner.options.Options;
import org.openjdk.jmh.runner.options.OptionsBuilder;
import stream.parallel.ParallelStreamBenchMark;

public class Main {
    public static void main(String[] args) throws RunnerException {
        Options opt = new OptionsBuilder().include(ParallelStreamBenchMark.class.getSimpleName())
                .build();

        new Runner(opt).run();
    }
}
저는 IntelliJ IDEA를 사용하기 때문에 ㅎㅎ
편하게 IntelliJ IDEA의 플러그인으로 진행하겠습니다. (킹갓 킹텔리제이)
Thank you!! https://github.com/artyushov/idea-jmh-plugin
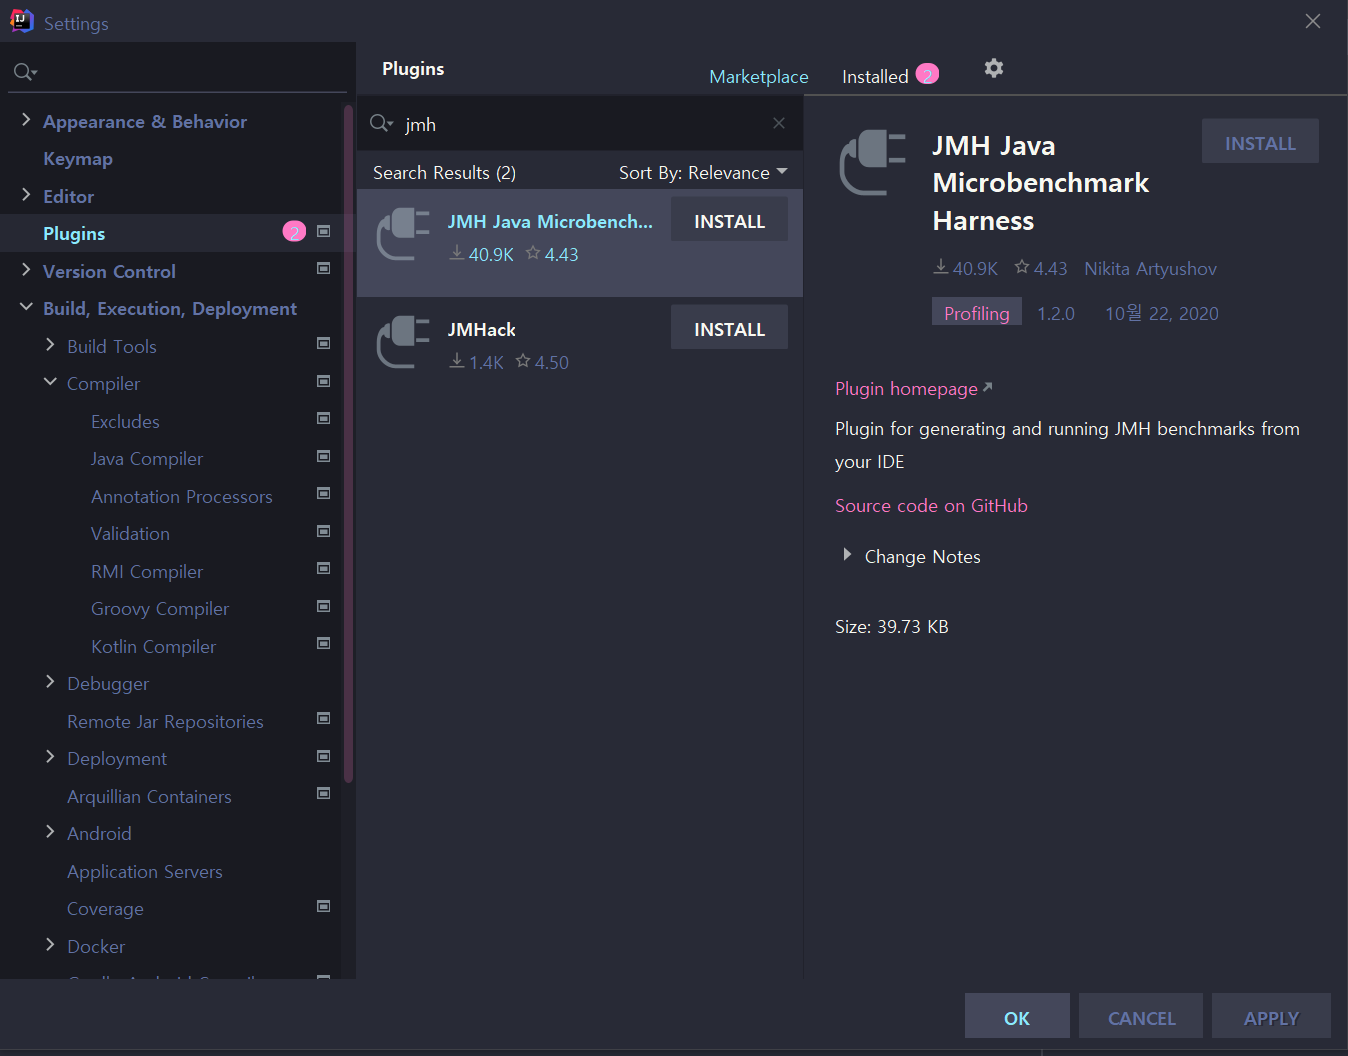
IntelliJ Plugin에서 jmh를 검색해보시면 다음과 같은 Plugin을 보실 수가 있습니다.
받아주세요.
그리고 그냥 Main 클래스를 실행하시면 됩니다!!
> 위의 Stream 순차 reducing 문의 jmh 측정 결과 입니다.
# JMH version: 1.29
# VM version: JDK 11.0.10, OpenJDK 64-Bit Server VM, 11.0.10+9-LTS
# VM invoker: C:\Users\user\.jdks\azul-11.0.10\bin\java.exe
# VM options: -Xms1G -Xmx1G
# Blackhole mode: full + dont-inline hint
# Warmup: 5 iterations, 10 s each
# Measurement: 5 iterations, 10 s each
# Timeout: 10 min per iteration
# Threads: 1 thread, will synchronize iterations
# Benchmark mode: Average time, time/op
# Benchmark: stream.parallel.ParallelStreamBenchMark.sequentialSum

# Run progress: 0.00% complete, ETA 00:03:20
# Fork: 1 of 2
# Warmup Iteration   1: 1.286 ms/op
# Warmup Iteration   2: 1.156 ms/op
# Warmup Iteration   3: 1.131 ms/op
# Warmup Iteration   4: 1.139 ms/op
# Warmup Iteration   5: 1.137 ms/op
Iteration   1: 1.232 ms/op
Iteration   2: 1.261 ms/op
Iteration   3: 1.252 ms/op
Iteration   4: 1.148 ms/op
Iteration   5: 1.115 ms/op

# Run progress: 50.00% complete, ETA 00:01:40
# Fork: 2 of 2
# Warmup Iteration   1: 1.201 ms/op
# Warmup Iteration   2: 1.084 ms/op
# Warmup Iteration   3: 1.085 ms/op
# Warmup Iteration   4: 1.127 ms/op
# Warmup Iteration   5: 1.071 ms/op
Iteration   1: 1.103 ms/op
Iteration   2: 1.075 ms/op
Iteration   3: 1.100 ms/op
Iteration   4: 1.076 ms/op
Iteration   5: 1.070 ms/op


Result "stream.parallel.ParallelStreamBenchMark.sequentialSum":
  1.143 ±(99.9%) 0.115 ms/op [Average]
  (min, avg, max) = (1.070, 1.143, 1.261), stdev = 0.076
  CI (99.9%): [1.028, 1.258] (assumes normal distribution)


# Run complete. Total time: 00:03:21

REMEMBER: The numbers below are just data. To gain reusable insights, you need to follow up on
why the numbers are the way they are. Use profilers (see -prof, -lprof), design factorial
experiments, perform baseline and negative tests that provide experimental control, make sure
the benchmarking environment is safe on JVM/OS/HW level, ask for reviews from the domain experts.
Do not assume the numbers tell you what you want them to tell.

Benchmark                              Mode  Cnt  Score   Error  Units
ParallelStreamBenchMark.sequentialSum  avgt   10  1.143 ± 0.115  ms/op

Process finished with exit code 0
> 이번에는 단순 for loop 문의 속도 측정입니다.
    @Benchmark  // 벤치마크 대상 메서드
    public long sequentialSum() {
        long result = 0;
        for (long i = 1L; i <= N; i++) {
            result += i;
        }
        return result;
    }
# Run progress: 0.00% complete, ETA 00:03:20
# Fork: 1 of 2
# Warmup Iteration 1: 0.074 ms/op
# Warmup Iteration 2: 0.067 ms/op
# Warmup Iteration 3: 0.063 ms/op
# Warmup Iteration 4: 0.064 ms/op
# Warmup Iteration 5: 0.063 ms/op
Iteration 1: 0.063 ms/op
Iteration 2: 0.064 ms/op
Iteration 3: 0.063 ms/op
Iteration 4: 0.064 ms/op
Iteration 5: 0.068 ms/op
# Run progress: 50.00% complete, ETA 00:01:40
# Fork: 2 of 2
# Warmup Iteration 1: 0.067 ms/op
# Warmup Iteration 2: 0.081 ms/op
# Warmup Iteration 3: 0.064 ms/op
# Warmup Iteration 4: 0.063 ms/op
# Warmup Iteration 5: 0.063 ms/op
Iteration 1: 0.064 ms/op
Iteration 2: 0.069 ms/op
Iteration 3: 0.066 ms/op
Iteration 4: 0.077 ms/op
Iteration 5: 0.065 ms/op
Result "stream.parallel.ParallelStreamBenchMark.sequentialSum":
0.066 ±(99.9%) 0.007 ms/op [Average]
(min, avg, max) = (0.063, 0.066, 0.077), stdev = 0.004
CI (99.9%): [0.060, 0.073] (assumes normal distribution)
# Run complete. Total time: 00:03:21
REMEMBER: The numbers below are just data. To gain reusable insights, you need to follow up on
why the numbers are the way they are. Use profilers (see -prof, -lprof), design factorial
experiments, perform baseline and negative tests that provide experimental control, make sure
the benchmarking environment is safe on JVM/OS/HW level, ask for reviews from the domain experts.
Do not assume the numbers tell you what you want them to tell.
Benchmark Mode Cnt Score Error Units
ParallelStreamBenchMark.sequentialSum avgt 10 0.066 ± 0.007 ms/op
Process finished with exit code 0
속도 차이 실화???!!! (스트림 1.143ms/op vs for문 0.066ms/op)
전통적인 for-loop의 방식이 더욱 저수준으로 동작할 뿐 아니라, 특히 primitive Type을 Boxing/Unboxing하는 작업이 없음으로 인해 훨씬 빠른 결과를 나타냈습니다.
자 이제는 parallelStream의 속도 측정 입니다.
# Run progress: 0.00% complete, ETA 00:03:20
# Fork: 1 of 2
# Warmup Iteration   1: 1.718 ms/op
# Warmup Iteration   2: 1.565 ms/op
# Warmup Iteration   3: 1.514 ms/op
# Warmup Iteration   4: 1.509 ms/op
# Warmup Iteration   5: 1.542 ms/op
Iteration   1: 1.407 ms/op
Iteration   2: 1.451 ms/op
Iteration   3: 1.408 ms/op
Iteration   4: 1.405 ms/op
Iteration   5: 1.484 ms/op

# Run progress: 50.00% complete, ETA 00:01:40
# Fork: 2 of 2
# Warmup Iteration   1: 1.648 ms/op
# Warmup Iteration   2: 1.527 ms/op
# Warmup Iteration   3: 1.477 ms/op
# Warmup Iteration   4: 1.435 ms/op
# Warmup Iteration   5: 1.444 ms/op
Iteration   1: 1.457 ms/op
Iteration   2: 1.539 ms/op
Iteration   3: 1.719 ms/op
Iteration   4: 1.593 ms/op
Iteration   5: 1.677 ms/op


Result "stream.parallel.ParallelStreamBenchMark.sequentialSum":
  1.514 ±(99.9%) 0.173 ms/op [Average]
  (min, avg, max) = (1.405, 1.514, 1.719), stdev = 0.114
  CI (99.9%): [1.341, 1.687] (assumes normal distribution)


# Run complete. Total time: 00:03:21

REMEMBER: The numbers below are just data. To gain reusable insights, you need to follow up on
why the numbers are the way they are. Use profilers (see -prof, -lprof), design factorial
experiments, perform baseline and negative tests that provide experimental control, make sure
the benchmarking environment is safe on JVM/OS/HW level, ask for reviews from the domain experts.
Do not assume the numbers tell you what you want them to tell.

Benchmark                              Mode  Cnt  Score   Error  Units
ParallelStreamBenchMark.sequentialSum  avgt   10  1.514 ± 0.173  ms/op
병렬 스트림은 1.514 ms/op 의 결과를 낳았습니다. 단순 for문에 비해서는 말할것도 없고, 순차스트림에 비해서 멀티코어 프로세싱의 장점을 가지지도 못했군요...
여기서 병렬스트림의 두 가지 문제점을 확인할 수 있습니다.
1. 반복 결과로 박싱된 객체가 만들어지므로 숫자를 더하려면 언박싱을 해야 한다. (단순 for-loop 대비 단점)
2. 반복 작업은 병렬로 수행할 수 있는 독립 단위로 나누기가 어렵다. (반복 계산 iterate 작업 시, 병렬 Task 단위로 독립적으로 쪼개기가 어렵다.)
2번의 문제는 병렬스트림을 생성하고도 병렬 처리를 할 수 없다는 상황인데요.
처리할 데이터의 리스트를 선제적으로 제공하지 않는 이상,
데이터를 하나하나 만들어가야 하기 때문에 병렬 Tasking을 하지 못하는 것입니다.
오히려 컨텍스트 스위칭, CPU 자원 사용 등으로 인한 COST만 증가한 상황이었습니다.
LongStream.rangeCloed 메서드를 통해 이것을 해결할 수 있습니다.
1. LongStream.rangeCloed는 기본형 long을 직접 사용하므로 박싱과 언박싱 오버헤드가 사라진다.
2. LongStream.rangeCloed는 쉽게 청크단위로 분할할 수 있는 숫자 범위를 생산한다. 예를 들어 1-20 범위의 숫자를 각각 1-5, 6-10, 11-15, 16-20 범위의 숫자로 분할할 수 있다.
우선 순차스트림에 LongStream.rangeCloed를 적용해보겠습니다.
코드는 아래와 같습니다.
    @Benchmark  // 벤치마크 대상 메서드
    public long sequentialSum() {
        return LongStream.rangeClosed(1, N)
                .reduce(0L, Long::sum);
    }
결과
# Run progress: 0.00% complete, ETA 00:03:20
# Fork: 1 of 2
# Warmup Iteration   1: 0.112 ms/op
# Warmup Iteration   2: 0.096 ms/op
# Warmup Iteration   3: 0.102 ms/op
# Warmup Iteration   4: 0.101 ms/op
# Warmup Iteration   5: 0.104 ms/op
Iteration   1: 0.100 ms/op
Iteration   2: 0.100 ms/op
Iteration   3: 0.099 ms/op
Iteration   4: 0.102 ms/op
Iteration   5: 0.098 ms/op

# Run progress: 50.00% complete, ETA 00:01:40
# Fork: 2 of 2
# Warmup Iteration   1: 0.109 ms/op
# Warmup Iteration   2: 0.102 ms/op
# Warmup Iteration   3: 0.104 ms/op
# Warmup Iteration   4: 0.102 ms/op
# Warmup Iteration   5: 0.103 ms/op
Iteration   1: 0.099 ms/op
Iteration   2: 0.098 ms/op
Iteration   3: 0.102 ms/op
Iteration   4: 0.106 ms/op
Iteration   5: 0.116 ms/op


Result "stream.parallel.ParallelStreamBenchMark.sequentialSum":
  0.102 ±(99.9%) 0.009 ms/op [Average]
  (min, avg, max) = (0.098, 0.102, 0.116), stdev = 0.006
  CI (99.9%): [0.093, 0.111] (assumes normal distribution)


# Run complete. Total time: 00:03:21

REMEMBER: The numbers below are just data. To gain reusable insights, you need to follow up on
why the numbers are the way they are. Use profilers (see -prof, -lprof), design factorial
experiments, perform baseline and negative tests that provide experimental control, make sure
the benchmarking environment is safe on JVM/OS/HW level, ask for reviews from the domain experts.
Do not assume the numbers tell you what you want them to tell.

Benchmark                              Mode  Cnt  Score   Error  Units
ParallelStreamBenchMark.sequentialSum  avgt   10  0.102 ± 0.009  ms/op

Process finished with exit code 0
rangeClosed 적용한 결과 0.102 ms/op.... 와 머선129;;
rangeClosed 덕분에 Type Boxing/Unboxing COST를 제거했는데요. 거의 뭐 기본 for문에 비빌 수 있을 만큼 성능이 개선됐습니다.
그럼 이제 parallel + rangeClosed 가야하지 않겠습니까? 성님덜?
코드는 아래와 같습니다.
    @Benchmark  // 벤치마크 대상 메서드
    public long sequentialSum() {
        return LongStream.rangeClosed(1, N)
                .parallel()
                .reduce(0L, Long::sum);
    }
결과
# Run progress: 0.00% complete, ETA 00:03:20
# Fork: 1 of 2
# Warmup Iteration   1: 0.124 ms/op
# Warmup Iteration   2: 0.087 ms/op
# Warmup Iteration   3: 0.079 ms/op
# Warmup Iteration   4: 0.079 ms/op
# Warmup Iteration   5: 0.079 ms/op
Iteration   1: 0.079 ms/op
Iteration   2: 0.079 ms/op
Iteration   3: 0.077 ms/op
Iteration   4: 0.074 ms/op
Iteration   5: 0.075 ms/op

# Run progress: 50.00% complete, ETA 00:01:40
# Fork: 2 of 2
# Warmup Iteration   1: 0.118 ms/op
# Warmup Iteration   2: 0.078 ms/op
# Warmup Iteration   3: 0.075 ms/op
# Warmup Iteration   4: 0.073 ms/op
# Warmup Iteration   5: 0.077 ms/op
Iteration   1: 0.075 ms/op
Iteration   2: 0.075 ms/op
Iteration   3: 0.075 ms/op
Iteration   4: 0.076 ms/op
Iteration   5: 0.077 ms/op


Result "stream.parallel.ParallelStreamBenchMark.sequentialSum":
  0.076 ±(99.9%) 0.003 ms/op [Average]
  (min, avg, max) = (0.074, 0.076, 0.079), stdev = 0.002
  CI (99.9%): [0.073, 0.079] (assumes normal distribution)


# Run complete. Total time: 00:03:21

REMEMBER: The numbers below are just data. To gain reusable insights, you need to follow up on
why the numbers are the way they are. Use profilers (see -prof, -lprof), design factorial
experiments, perform baseline and negative tests that provide experimental control, make sure
the benchmarking environment is safe on JVM/OS/HW level, ask for reviews from the domain experts.
Do not assume the numbers tell you what you want them to tell.

Benchmark                              Mode  Cnt  Score   Error  Units
ParallelStreamBenchMark.sequentialSum  avgt   10  0.076 ± 0.003  ms/op

Process finished with exit code 0
0.076 ms/op 크으.... 확실히 병렬로 돌리니까 순차스트림보다 빠르군요.
제 PC가 LG Gram 4코어 짜리인데용... 좀 더 코어수 많은걸로 돌리면 병렬 처리의 이점을 확실히 뽑아 낼 수 있을 거 같습니다.
다만 병렬화를 구현하는 데에는 많은 COST가 발생합니다.
스트림을 재귀분할하고, 각 서브스트림을 서로 다른 스레드의 리듀싱 연산으로 할당하고, 이들 결과를 하나의 값을 합쳐야 합니다.
또한 멀티코어 간의 데이터 이동은 상당한 COST가 발생합니다. 이러한 COST를 잘 계산해서 COST를 상쇄할 만큼의 큰 작업만 병렬로 수행하는 것이 좋다고 합니다!
