시작하기 전에 import 하기
import plotly.express as px
import plotly.graph_objects as go
import plotly.express as px
import numpy as np
Box Plot
Box plot은 상자수염차트, 봉, 캔들 등 다양한 이름을 가진 차트입니다. 데이터의 통계적 의미를 표현할때 자주 사용되는 매우 유용한 차트입니다.
지금부터 plotly를 활용해서 Boxplot 를 그리는 방법에 대해 알아보겠습니다.
Keyword : Plotly Boxplot, Plotly 상자수염 차트, px.box, go.Box, Plotly box notched, Plotly box style, Plotly box color
Express를 활용한 기본 사용방법
# 직접 입력
px.box(y=[데이터])
# 데이터셋을 활용한 입력
px.box(data_frame= df, y="total_bill")
[사용 함수]
px.box()
[함수 input 내용]
데이터 직접 입력
y = y값 리스트
데이터셋을 활용한 입력
data_frame = pandas 데이터 프레임
y = y값 컬럼 명
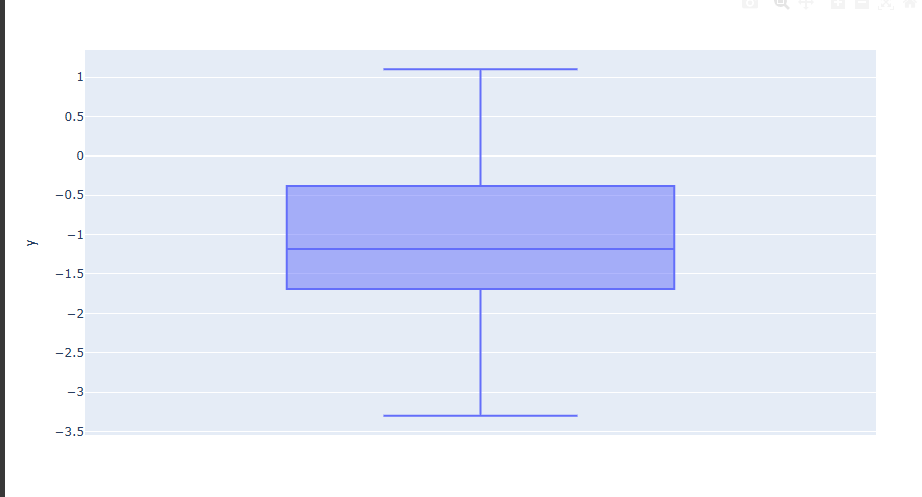
예제 1
import plotly.express as px
# 데이터 생성
import numpy as np
np.random.seed(1)
y0 = np.random.randn(50) - 1
fig = px.box(y=y0)
fig.show()
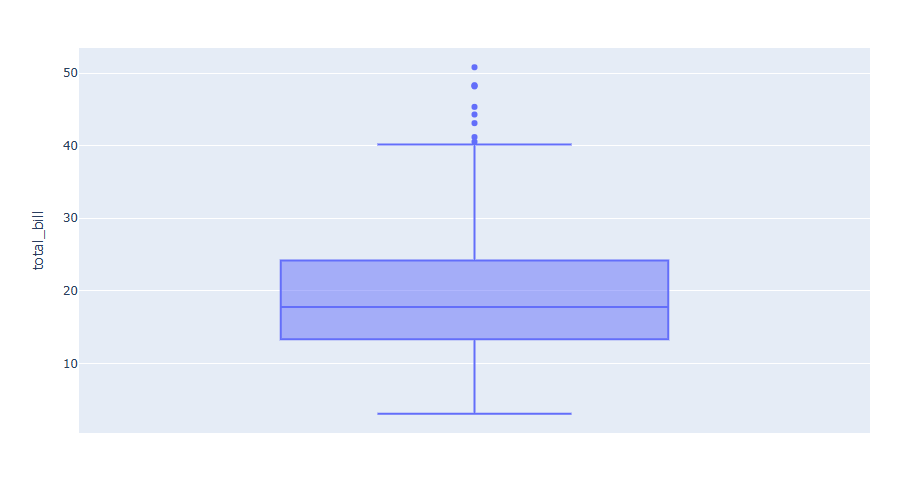
예제 2) 데이터셋을 활용한 입력
import plotly.express as px
# 데이터 불러오기
df = px.data.tips()
fig = px.box(df, y="total_bill")
fig.show()
graph_objects를 활용한 기본 사용
fig.add_trace(go.Box(y=[데이터]))[사용 함수]
fig.add_trace() : Trace를 추가할때 사용
go.Box() : fig.add_trace() 안에 넣은 Box Trace
[함수 input 내용]
y = y값 리스트
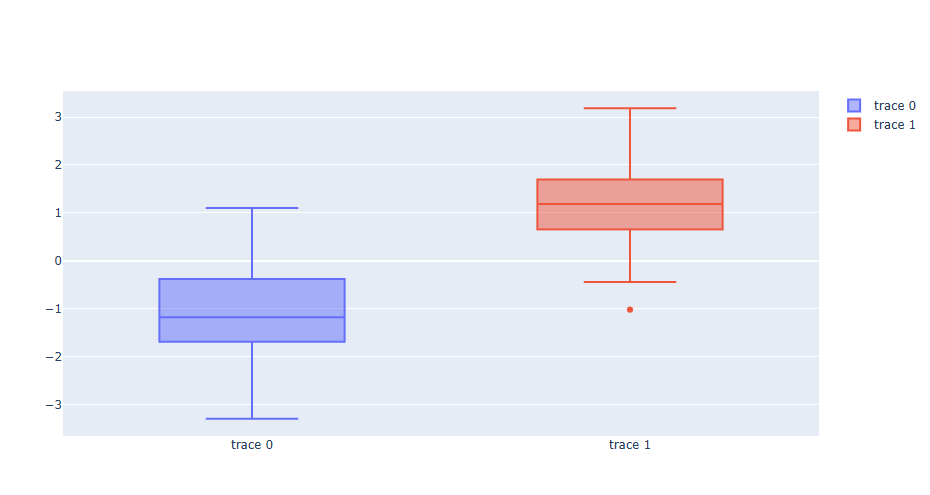
예제
import plotly.graph_objects as go
# 데이터 생성
import numpy as np
np.random.seed(1)
y0 = np.random.randn(50) - 1
y1 = np.random.randn(50) + 1
# Figure  생성
fig = go.Figure()
# Scatter Trace 추가
fig.add_trace(go.Box(y=y0))
fig.add_trace(go.Box(y=y1))
fig.show()
express 를 활용한 다양한 기능
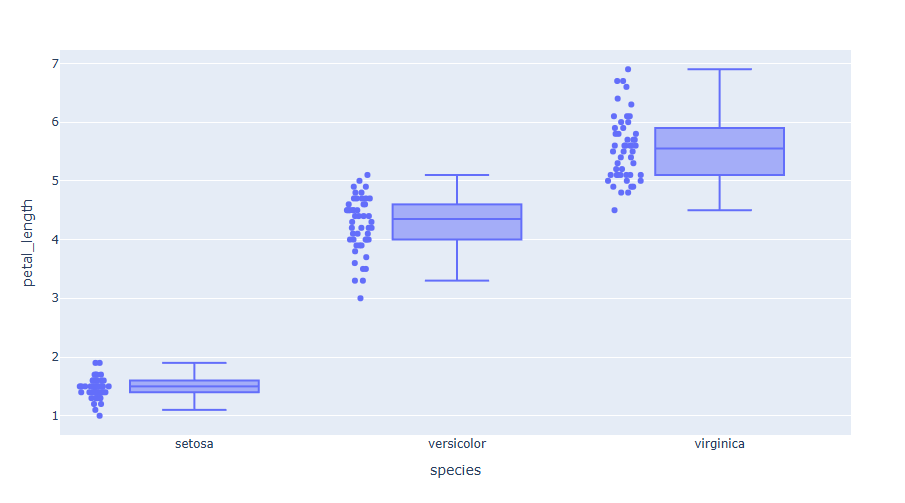
Point 같이 표시하기
import plotly.express as px
# Iris 데이터 불러오기
df = px.data.iris()
# Box Plot 그리기: 품종별 꽃잎 길이 분포
fig = px.box(df, x="species", y="petal_length", points="all")
fig.show()
point : 박스플롯과 함께 데이터 위치를 marker를 통해 표시하는 모드
all : 모든 포인트 같이 표현
outliers : outlier 밖의 포인트만 표현
suspectedoutliers : outlier 포인트를 다 표현하되 4Q3-3Q1< x <4Q1-3Q3 의 값만 하이라트로 표시
False : 표시 X
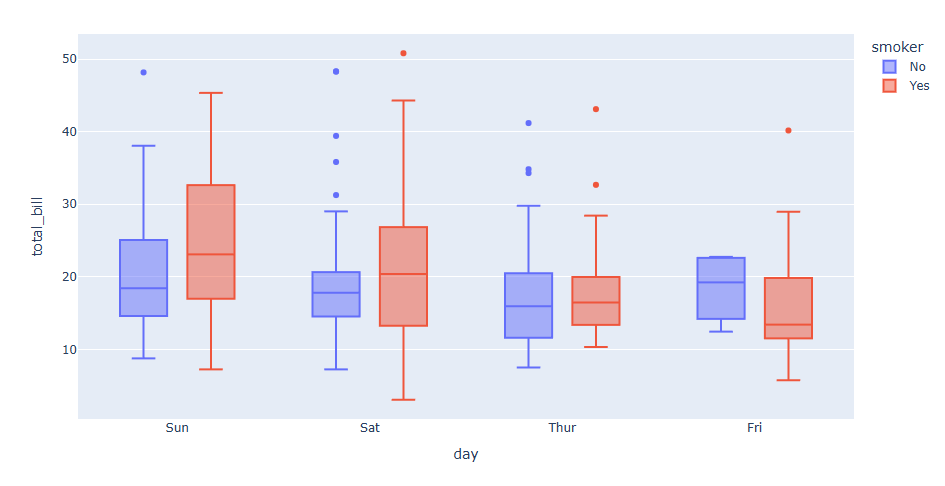
마커 색으로 데이터 분류하여 표시하기
import plotly.express as px
# 데이터 불러오기
df = px.data.tips()
fig = px.box(df, x="day", y="total_bill", color="smoker")
fig.show()
색으로 구분하고 싶은 데이터 컬럼명을 "color= " 로 지정합니다.
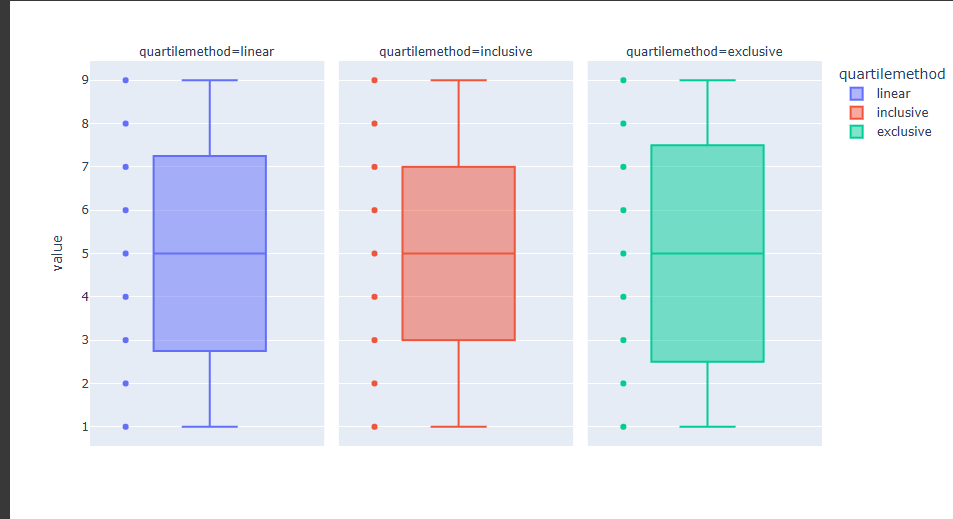
사분위수 계산 방법 변경하기
사분위수 계산방법 변경을 위해선 아래 코드를 추가해야 합니다.
fig.update_traces(quartilemethod=계산방법 입력)[사용 함수]
fig.update_traces()
[함수 input 내용]
quartilemethod = {'linear', 'exclusive', ' inclusive'}
예제)import plotly.express as px import pandas as pd # 데이터 입력하기 data = [1,2,3,4,5,6,7,8,9] df = pd.DataFrame(dict( linear=data, inclusive=data, exclusive=data )).melt(var_name="quartilemethod") # box 플롯 그리기 fig = px.box(df, y="value", facet_col="quartilemethod", color="quartilemethod", boxmode="overlay", points='all') # 각 그래프 별 계산모드 변경하 fig.update_traces(quartilemethod="linear", jitter=0, col=1) fig.update_traces(quartilemethod="inclusive", jitter=0, col=2) fig.update_traces(quartilemethod="exclusive", jitter=0, col=3) fig.show()
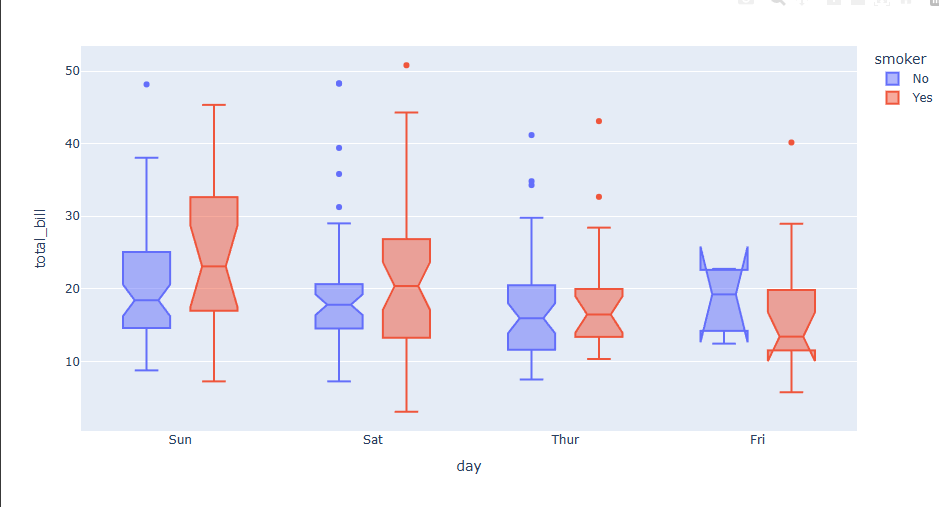
노치 표현하기
import plotly.express as px
# 데이터 불러오기
df = px.data.tips()
fig = px.box(df, x="day", y="total_bill", color="smoker",notched=True)
fig.show()
"notched= True" 로 지정 하면 허리가 들어가는 notch가 생성됩니다.
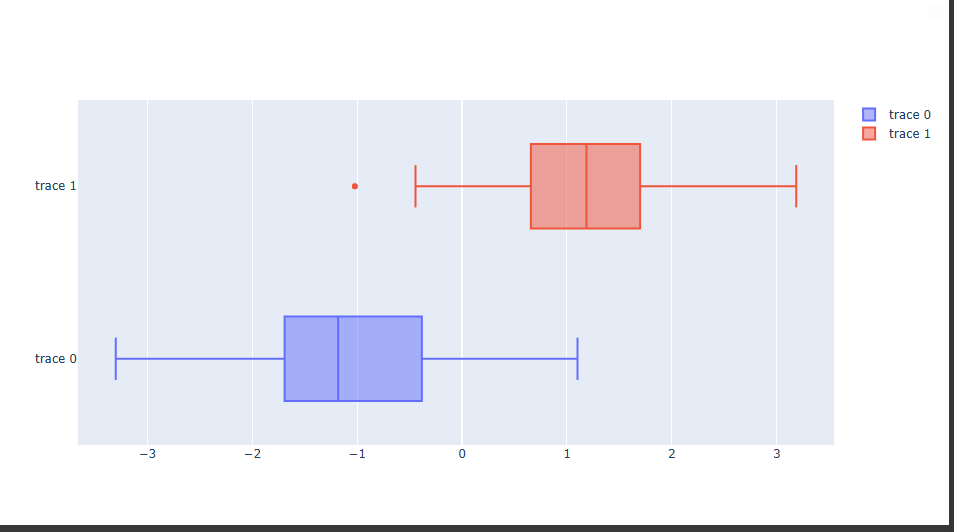
가로로 그리기
가로로 그리는 방법은 데이터 input을 y 가 아닌 x로 변경만 해주면 됩니다.
import plotly.graph_objects as go
# 데이터 생성
import numpy as np
np.random.seed(1)
x0 = np.random.randn(50) - 1
x1 = np.random.randn(50) + 1
# Figure  생성
fig = go.Figure()
# Scatter Trace 추가
fig.add_trace(go.Box(x=x0))
fig.add_trace(go.Box(x=x1))
fig.show()
박스플랏 스타일 변경하기
fig.update_traces(marker_color= 마커 색,
                 marker_size= 마커 크기,
                 marker_line_width=마커 테두리 두깨,
                 marker_line_color=마커 테두리 색,
                 marker_symbol = 마커 모양,
                 marker_opacity = 마커 투명도,
                 line_color = 박스 라인색,
                 line_width = 박스 라인 두깨,
                 fillcolor = 박스 내부 색,
                 whiskerwidth = whisker 길이,
                 )
[사용 함수]
fig.update_traces()
[함수 input 내용]
marker_color= 마커 색
marker_size=마커 크기
marker_line_width=마커 테두리 두깨
marker_line_color=마커 테두리 색
marker_symbol = 마커 모양
marker_opacity = 마커 투명도
line_color = 박스 라인색
line_width = 박스 라인 두깨
fillcolor = 박스 내부 색
whiskerwidth = [0~1] whisker 길이
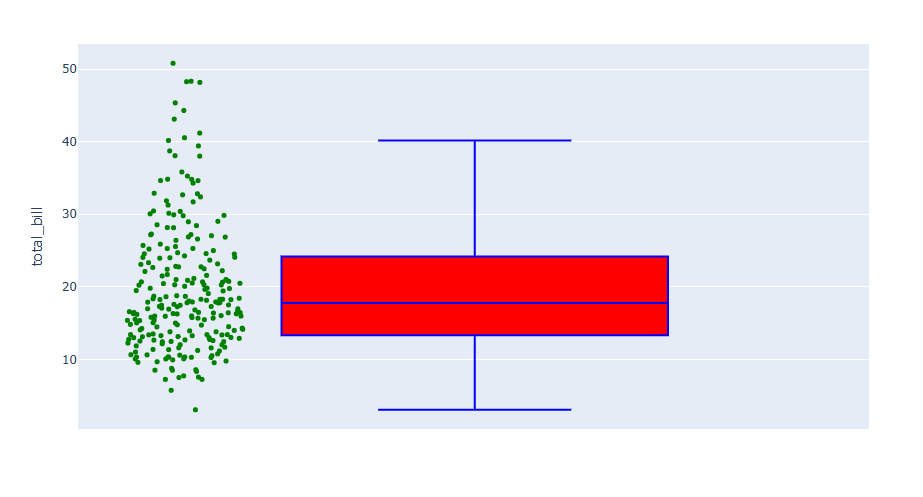
예제
import plotly.express as px
# 데이터 불러오기
df = px.data.tips()
# Box Plot 생성
fig = px.box(df, y="total_bill", points ="all" )
#Box Plot 변경
fig.update_traces(marker_color= "green",marker_size = 5, line_width= 2, line_color="blue",fillcolor= 'red', whiskerwidth=0.5)
fig.show()