CoinCap API 2.0를 활용하여 비트코인 데이터를 받아왔다.
개요
비트코인 데이터를 받아와서 렌더링하는 프로젝트를 만들어보기로 하였다.
모든 비트코인의 데이터를 확인하는 페이지, 개별 비트코인의 데이터를 차트로 조회하는 페이지를 만들 것이다.
모든 비트코인 데이터 조회
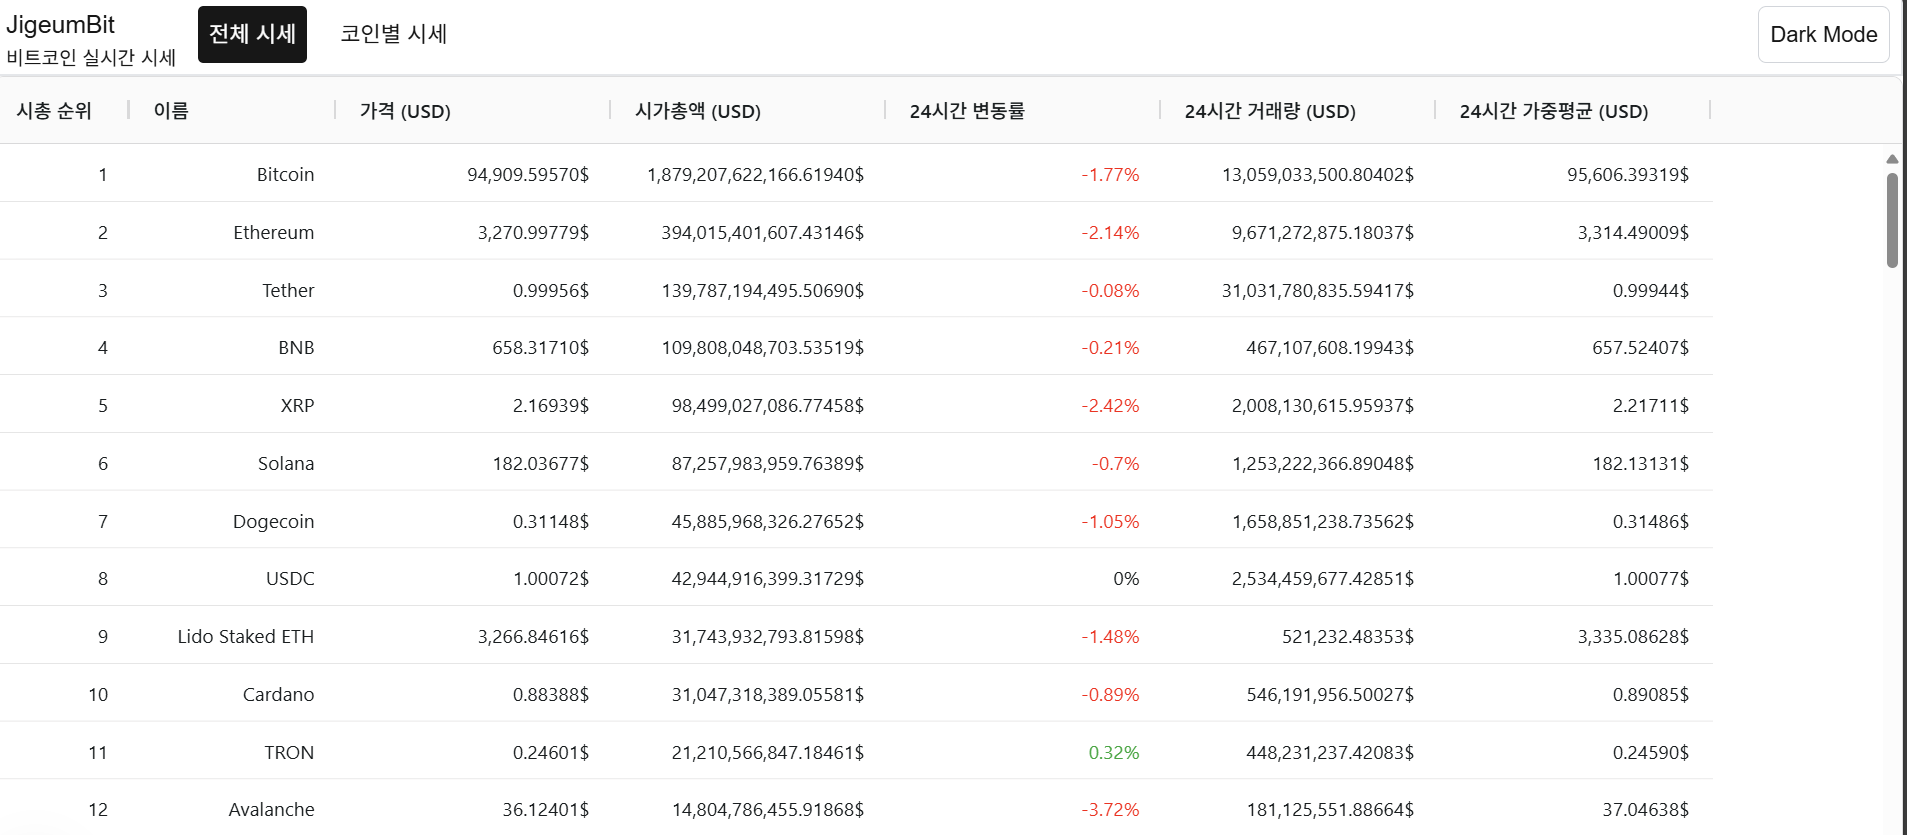
차트 라이브러리는 무수히 많고, 그 중 하나를 택해야 한다. 완전한 데이터 테이블 솔루션을 제공하며, 정렬, 필터링, 그룹화, 페이징 등 데이터 중심의 기능을 지원하는 AG Grid를 활용해 테이블 형태로 데이터를 렌더링해보려고 한다.
기본 예제
AgGridReact는 AG Grid의 React Wrapper로, 강력하고 커스터마이징 가능한 데이터 그리드를 제공한다.
rowData- 테이블에 표시할 데이터 배열 (
coinArr). - 배열의 각 객체는
columns에서 정의한field와 매핑
- 테이블에 표시할 데이터 배열 (
columnDefs- 각 열에 대한 정의를 제공. 테이블의 헤더 이름, 데이터 필드, 포맷팅 방식 등을 지정한다.
rowData에 표에 들어갈 객체 데이터 배열을 넣어주고, 속성값을 field로 하는 cloumns을 지정해주면 자동으로 알아서 매핑되어 표가 렌더링된다.
import { AgGridReact } from 'ag-grid-react'; // React Data Grid Component
import 'ag-grid-community/styles/ag-grid.css'; // Mandatory CSS required by the Data Grid
import 'ag-grid-community/styles/ag-theme-quartz.css'; // Optional Theme applied to the Data Grid

import { useBitcoinQueryType } from '@/queries/useBitcoinQuery';

interface coinColumn {
  rank: number; // 순위 (예: 1)
  id: string; // 자산 ID (예: bitcoin)
  symbol: string; // 자산 심볼 (예: BTC)
  name: string; // 자산 이름 (예: Bitcoin)
  priceUsd: string; // 현재 가격 (USD)
  marketCapUsd: string; // 시가총액 (USD)
  changePercent24Hr: string; // 24시간 가격 변동 퍼센트
  volumeUsd24Hr: string; // 24시간 거래량 (USD)
  vwap24Hr: string; // 24시간 거래량 가중 평균 가격 (VWAP)
}

export default function CoinTable({ coinArr }: useBitcoinQueryType) {
  const columns = [
    // rank, name,  priceUsd, marketCapUsd, changePercent24Hr, volumeUsd24Hr, vwap24Hr
    { headerName: '시가 총액 순위', field: 'rank', width: 150, cellDataType: 'number' },
    { headerName: '이름', field: 'name', width: 150, cellDataType: 'string' },
    { headerName: '가격 (USD)', field: 'priceUsd', cellDataType: 'number' },
    { headerName: '시가총액 (USD)', field: 'marketCapUsd', cellDataType: 'number' },
    {
      headerName: '24시간 변동률',
      field: 'changePercent24Hr',
      valueFormatter: (params: any) => `${params.value}%`,
    },
    { headerName: '24시간 거래량 (USD)', field: 'volumeUsd24Hr', cellDataType: 'number' },
    { headerName: '24시간 가중평균 (USD)', field: 'vwap24Hr', cellDataType: 'number' },
  ];

  if (!coinArr) {
    throw new Error('coinArr is undefined');
  }

  return (
    <div>
      <div className='ag-theme-quartz' style={{ height: 500 }}>
        <AgGridReact rowData={coinArr} columnDefs={columns} />
      </div>
    </div>
  );
}
다크 모드 적용
ag-grid에서 기본적으로 제공해주는 테이블 테마 가 존재하는데, 기존 테마 뒤에 -dark를 붙이면 다크모드도 적용시킬 수 있다.
전역 state를 활용해 state 변경에 따라 다른 테마를 적용시켜 보자.
import { useEffect, useState } from 'react';
import { useAtom } from 'jotai';

import { AgGridReact } from 'ag-grid-react'; // React Data Grid Component
import 'ag-grid-community/styles/ag-grid.css'; // Mandatory CSS required by the Data Grid
import 'ag-grid-community/styles/ag-theme-quartz.css'; // Optional Theme applied to the Data Grid

import { isDarkAtom } from '@/atoms';
import { useBitcoinQueryType } from '@/queries/useBitcoinQuery';

interface coinColumn {
  rank: number; // 순위 (예: 1)
  id: string; // 자산 ID (예: bitcoin)
  symbol: string; // 자산 심볼 (예: BTC)
  name: string; // 자산 이름 (예: Bitcoin)
  priceUsd: string; // 현재 가격 (USD)
  marketCapUsd: string; // 시가총액 (USD)
  changePercent24Hr: string; // 24시간 가격 변동 퍼센트
  volumeUsd24Hr: string; // 24시간 거래량 (USD)
  vwap24Hr: string; // 24시간 거래량 가중 평균 가격 (VWAP)
}

export default function CoinTable({ coinArr }: useBitcoinQueryType) {
  const [darkMode] = useAtom(isDarkAtom);

  const columns = [
    // rank, name,  priceUsd, marketCapUsd, changePercent24Hr, volumeUsd24Hr, vwap24Hr
    { headerName: '시가 총액 순위', field: 'rank', width: 150, cellDataType: 'number' },
    { headerName: '이름', field: 'name', width: 150, cellDataType: 'string' },
    { headerName: '가격 (USD)', field: 'priceUsd', cellDataType: 'number' },
    { headerName: '시가총액 (USD)', field: 'marketCapUsd', cellDataType: 'number' },
    {
      headerName: '24시간 변동률',
      field: 'changePercent24Hr',
      valueFormatter: (params: any) => `${params.value}%`,
    },
    { headerName: '24시간 거래량 (USD)', field: 'volumeUsd24Hr', cellDataType: 'number' },
    { headerName: '24시간 가중평균 (USD)', field: 'vwap24Hr', cellDataType: 'number' },
  ];

  if (!coinArr) {
    throw new Error('coinArr is undefined');
  }

  const getTheme = () => {
    return darkMode ? 'ag-theme-quartz-dark' : 'ag-theme-quartz';
  };
  return (
    <div>
      <div className={getTheme()} style={{ height: 500 }}>
        <AgGridReact rowData={coinArr} columnDefs={columns} />
      </div>
    </div>
  );
}
값 변경 시 애니메이션 적용
ag-Grid는 테이블을 조작할 수 있는 API를 같이 제공한다. 특정 행을 조작하거나, 상호작용할 수 있는 이벤트를 제공하는 등 여러 효과를 지원한다.
동적으로 셀을 조작하고 싶다면 useRef로 테이블에 ref를 걸어놓은 후, flashCells 등의 메서드로 셀을 조작할 수 있다.
'use client';

import { useEffect, useState, useRef } from 'react';
import { useAtom } from 'jotai';

import { AgGridReact } from 'ag-grid-react'; // React Data Grid Component
import 'ag-grid-community/styles/ag-grid.css'; // Mandatory CSS required by the Data Grid
import 'ag-grid-community/styles/ag-theme-quartz.css'; // Optional Theme applied to the Data Grid

import { isDarkAtom } from '@/atoms';
import { ColDef } from 'ag-grid-community';

import { useBitcoinQueryType } from '@/queries/useBitcoinQuery';

interface coinColumn {
  rank: number; // 순위 (예: 1)
  id: string; // 자산 ID (예: bitcoin)
  symbol: string; // 자산 심볼 (예: BTC)
  name: string; // 자산 이름 (예: Bitcoin)
  priceUsd: string; // 현재 가격 (USD)
  marketCapUsd: string; // 시가총액 (USD)
  changePercent24Hr: string; // 24시간 가격 변동 퍼센트
  volumeUsd24Hr: string; // 24시간 거래량 (USD)
  vwap24Hr: string; // 24시간 거래량 가중 평균 가격 (VWAP)
}

export default function CoinTable({ coinArr }: useBitcoinQueryType) {
  const gridRef = useRef<AgGridReact>(null);
  const [darkMode] = useAtom(isDarkAtom);

  const columns: ColDef[] = [
    // rank, name,  priceUsd, marketCapUsd, changePercent24Hr, volumeUsd24Hr, vwap24Hr
    { headerName: '시가 총액 순위', field: 'rank', width: 150, cellDataType: 'number' },
    { headerName: '이름', field: 'name', width: 150, cellDataType: 'string' },
    {
      headerName: '가격 (USD)',
      field: 'priceUsd',
      cellDataType: 'number',
      cellRenderer: 'agAnimateShowChangeCellRenderer',
    },
    {
      headerName: '시가총액 (USD)',
      field: 'marketCapUsd',
      cellDataType: 'number',
      cellRenderer: 'agAnimateShowChangeCellRenderer',
    },
    {
      headerName: '24시간 변동률',
      field: 'changePercent24Hr',
      valueFormatter: (params: any) => `${params.value}%`,
    },
    { headerName: '24시간 거래량 (USD)', field: 'volumeUsd24Hr', cellDataType: 'number' },
    { headerName: '24시간 가중평균 (USD)', field: 'vwap24Hr', cellDataType: 'number' },
  ];
  const defaultColDef: ColDef = {
    enableCellChangeFlash: true, // 데이터 변경 시 플래시 효과 활성화
  };

  if (!coinArr) {
    throw new Error('coinArr is undefined');
  }

  const getTheme = () => {
    return darkMode ? 'ag-theme-quartz-dark' : 'ag-theme-quartz';
  };

  const flashCell = () => {
    const node = gridRef.current?.api.getDisplayedRowAtIndex(2);
    if (node) {
      gridRef.current!.api.flashCells({ rowNodes: [node], columns: ['priceUsd'] });
    }
  };

  return (
    <div>
      <button onClick={flashCell}>flashCell</button>
      <div className={getTheme()} style={{ height: 500 }}>
        <AgGridReact ref={gridRef} rowData={coinArr} columnDefs={columns} defaultColDef={defaultColDef} />
      </div>
    </div>
  );
}
Cell Component를 활용한 더 자세한 애니메이션
cellRenderer: 'agAnimateShowChangeCellRenderer' 옵션을 넣어서 값이 변경될 때마다 변경된 수치가 뜨게끔 수정해주었다.
'use client';

import { useRef } from 'react';
import { useAtom } from 'jotai';

import { AgGridReact } from 'ag-grid-react'; // React Data Grid Component
import { ValueFormatterParams } from 'ag-grid-community';
import 'ag-grid-community/styles/ag-grid.css'; // Mandatory CSS required by the Data Grid
import 'ag-grid-community/styles/ag-theme-quartz.css'; // Optional Theme applied to the Data Grid

import { isDarkAtom } from '@/atoms';
import { ColDef } from 'ag-grid-community';

import { useBitcoinQueryType } from '@/queries/useBitcoinQuery';

interface coinColumn {
  rank: number; // 순위 (예: 1)
  id: string; // 자산 ID (예: bitcoin)
  symbol: string; // 자산 심볼 (예: BTC)
  name: string; // 자산 이름 (예: Bitcoin)
  priceUsd: string; // 현재 가격 (USD)
  marketCapUsd: string; // 시가총액 (USD)
  changePercent24Hr: string; // 24시간 가격 변동 퍼센트
  volumeUsd24Hr: string; // 24시간 거래량 (USD)
  vwap24Hr: string; // 24시간 거래량 가중 평균 가격 (VWAP)
}

export default function CoinTable({ coinArr }: useBitcoinQueryType) {
  const gridRef = useRef<AgGridReact>(null);
  const [darkMode] = useAtom(isDarkAtom);

  const parseNumberValue = (params: ValueFormatterParams) => {
    return (
      Number(params.value).toLocaleString(undefined, {
        minimumFractionDigits: 5,
        maximumFractionDigits: 5,
      }) + '$'
    );
  };

  const columnsDef: ColDef[] = [
    // rank, name,  priceUsd, marketCapUsd, changePercent24Hr, volumeUsd24Hr, vwap24Hr
    { headerName: '시가 총액 순위', field: 'rank', width: 150, cellDataType: 'number' },
    { headerName: '이름', field: 'name', width: 150, cellDataType: 'string' },
    {
      headerName: '가격 (USD)',
      field: 'priceUsd',
      cellDataType: 'number',
      valueFormatter: parseNumberValue,
    },
    {
      headerName: '시가총액 (USD)',
      field: 'marketCapUsd',
      cellDataType: 'number',
      valueFormatter: parseNumberValue,
    },
    {
      headerName: '24시간 변동률',
      field: 'changePercent24Hr',
      valueFormatter: (params: any) => `${params.value}%`,
    },
    {
      headerName: '24시간 거래량 (USD)',
      field: 'volumeUsd24Hr',
      cellDataType: 'number',
      valueFormatter: parseNumberValue,
    },
    {
      headerName: '24시간 가중평균 (USD)',
      field: 'vwap24Hr',
      cellDataType: 'number',
      valueFormatter: parseNumberValue,
    },
  ];
  const defaultColDef: ColDef = {
    enableCellChangeFlash: true, // 데이터 변경 시 플래시 효과 활성화
    cellRenderer: 'agAnimateShowChangeCellRenderer',
  };

  if (!coinArr) {
    throw new Error('coinArr is undefined');
  }

  const getTheme = () => {
    return darkMode ? 'ag-theme-quartz-dark' : 'ag-theme-quartz';
  };

  return (
    <div>
      <div className={getTheme()} style={{ height: 500 }}>
        <AgGridReact ref={gridRef} rowData={coinArr} columnDefs={columnsDef} defaultColDef={defaultColDef} />
      </div>
    </div>
  );
}
비트코인 차트 조회
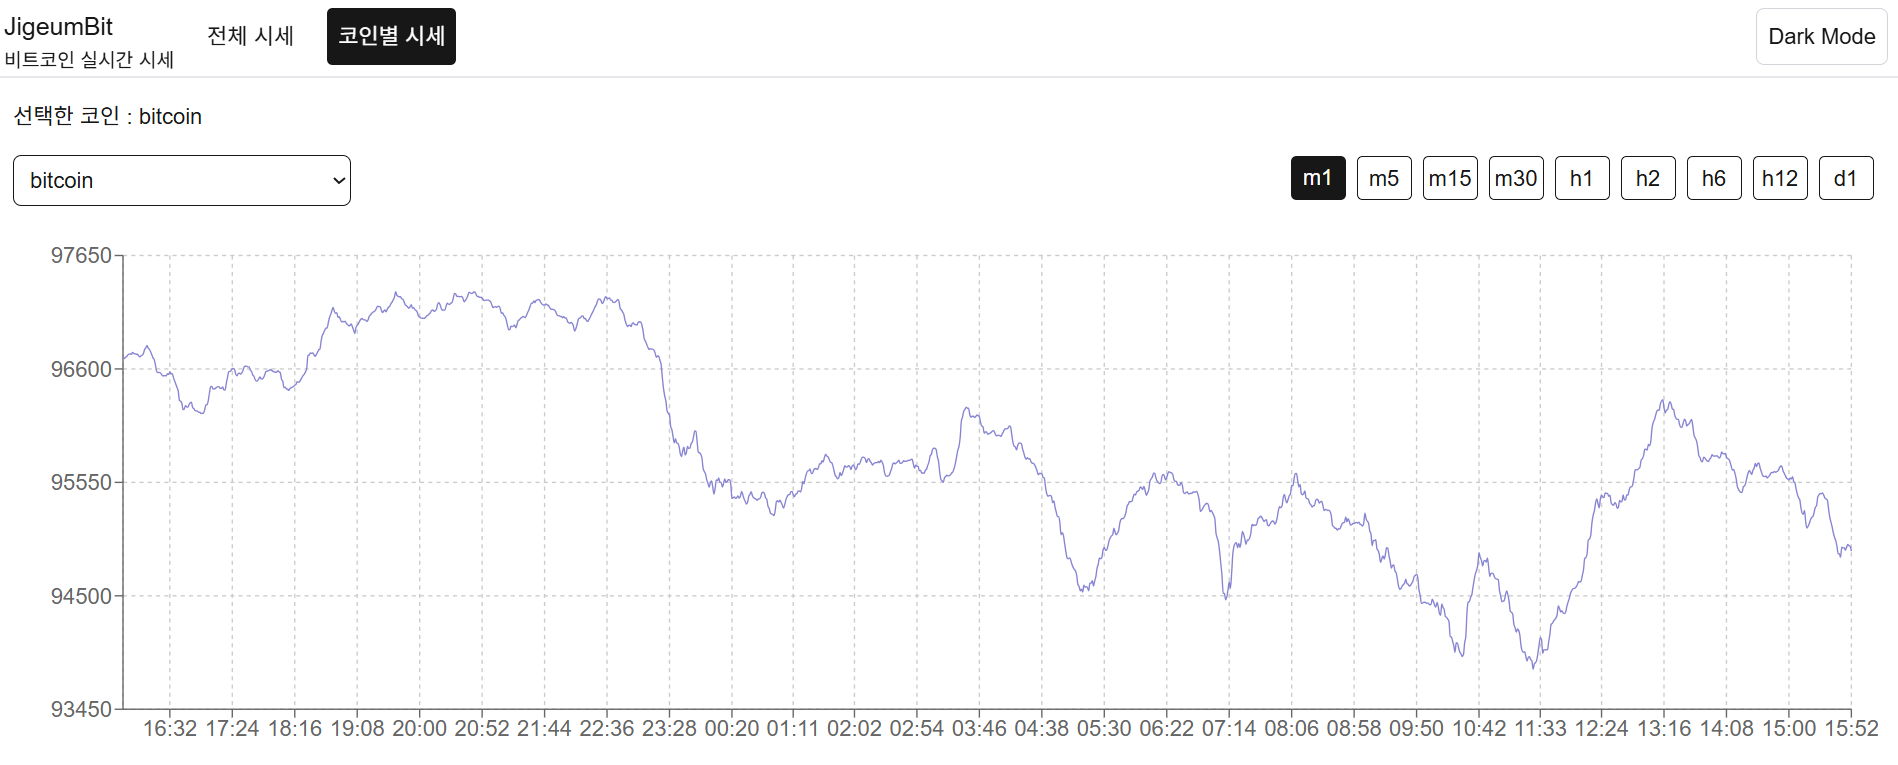
개별 비트코인의 시간대 별 기록을 보여줘야 하기에 차트 형태로 보여주기로 하였고, 그를 위해 차트 라이브러리인 recharts를 사용해주기로 하였다.
API 요청 - src/app/api/bitcoin/assets/history/route.ts
NextJs의 API Routes를 활용해 임의의 엔드포인트를 지정해주었다. 마치 백엔드에 요청을 보내는 것 같은 효과를 띄게 된다.
import { instance } from '@/app/api';
import { NextResponse } from 'next/server';

export async function GET(req: Request) {
  const { searchParams } = new URL(req.url);
  const coin = searchParams.get('coin');
  const interval = searchParams.get('interval');
  console.log(coin, interval);

  if (!coin || !interval) {
    return NextResponse.json({ error: 'Missing coin or interval' }, { status: 400 });
  }
  try {
    const url = `/assets/${coin}/history?interval=${interval}`;
    const { data } = await instance.get(url);
    return NextResponse.json(data, { status: 200 });
  } catch (error) {
    console.error('error', error);
    return NextResponse.json({ error: 'GET error', status: 500 });
  }
}
g
Query 요청 - src/queries/useBitHistoryQuery.ts
요청하는 비트코인의 아이디와, 간격을 파라미터로 받는다.
import { useQuery } from '@tanstack/react-query';

import axios from 'axios';
import { format } from 'date-fns';

interface HistoryArr {
  date: string;
  priceUsd: string;
  time: number;
}

interface ParsedArr {
  date: string;
  priceUsd: number;
  time: number;
}

interface GetBitHistoryRequest {
  coin: string;
  interval: string;
}

interface GetBitHistoryResponse {
  data: HistoryArr[];
}

export interface UseBitHistoryQueryType {
  data: ParsedArr[];
  isLoading?: boolean;
  error?: any;
}

const getBitHistory = async ({ coin, interval }: GetBitHistoryRequest): Promise<GetBitHistoryResponse> => {
  const url = `/api/bitcoin/assets/history?coin=${coin}&interval=${interval}`;
  const result = await axios.get(url);
  const { data } = result.data;
  return { data };
};

const getFormattedDate = (date: string, interval: string) => {
  switch (interval) {
    case 'm1':
    case 'm5':
    case 'm15':
    case 'm30':
      return format(new Date(date), 'yyyy-MM-dd HH:mm');
    case 'h1':
    case 'h2':
    case 'h6':
    case 'h12':
      return format(new Date(date), 'yyyy-MM-dd HH:mm');
    case 'd1':
      return format(new Date(date), 'yyyy-MM-dd');
    default:
      return format(new Date(date), 'yyyy-MM-dd');
  }
};

const useBitHistoryQuery = ({ coin, interval }: GetBitHistoryRequest) => {
  // useQuery 제네릭은 queryFn의 반환 값, error, select의 반환 값
  const { data, isLoading, error } = useQuery<GetBitHistoryResponse, unknown, ParsedArr[]>({
    queryKey: ['bitHistory', coin, interval],
    queryFn: () => getBitHistory({ coin, interval }),
    select: ({ data }: GetBitHistoryResponse) => {
      // queryFn의 반환 값인 GetBitHistoryResponse
      return data.map(item => ({
        date: getFormattedDate(item.date, interval),
        priceUsd: Number(item.priceUsd),
        time: item.time,
      }));
    },
    // queryFn 오류 시 select 호출 X

    refetchInterval: 10000, // 10초마다 새로 고침
  });
  return { data, isLoading, error };
};

export default useBitHistoryQuery;
차트 렌더링 - src/app/chart/page.tsx
recharts를 활용해 요청한 데이터를 렌더링한다.
'use client';

import { useState } from 'react';
import { LineChart, Line, XAxis, YAxis, CartesianGrid, Tooltip, Legend, ResponsiveContainer } from 'recharts';

import { APIComponent } from '@/components';
import { useBitHistoryQuery } from '@/queries';

import { coinId } from '@/lib';

type CoinOptionType = {
  value: string;
  label: string;
};

export default function Home() {
  const coinOptions: CoinOptionType[] = Object.keys(coinId).map(key => {
    return {
      value: key,
      label: key,
    };
  });
  const intervalOptions = ['m1', 'm5', 'm15', 'm30', 'h1', 'h2', 'h6', 'h12', 'd1'];

  const [selectOption, setSelectOption] = useState<CoinOptionType>(coinOptions[0]);
  const [selectInterval, setSelectInterval] = useState<number>(0);

  const { data, isLoading, error } = useBitHistoryQuery({
    coin: selectOption.value,
    interval: intervalOptions[selectInterval],
  });

  const onChangeCoin = (event: any) => {
    const selectedIndex = event.target.selectedIndex;
    console.log(selectedIndex);
    if (selectedIndex) {
      setSelectOption(coinOptions[selectedIndex]);
    }
  };
  const getTickValue = (value: string) => {
    if (selectInterval === intervalOptions.length - 1) {
      return value;
    }
    return value.split(' ')[1];
  };

  return (
    <APIComponent {...{ isLoading, error }}>
      <div className='flex h-full w-full flex-col items-center gap-4 p-4'>
        <div className='flex w-full justify-between'>
          <div className='flex w-[300px] flex-col gap-4'>
            선택한 코인 : {selectOption.label}
            <select
              title='코인 선택'
              value={selectOption.value} // 현재 선택된 옵션
              onChange={onChangeCoin}
              className='w-full rounded-md border border-foreground bg-background p-2 text-foreground'
            >
              {coinOptions.map(option => (
                <option key={option.value} value={option.value}>
                  {option.label}
                </option>
              ))}
            </select>
          </div>
          <div className='flex h-full w-full items-end justify-end'>
            {intervalOptions.map((option, index) => {
              const unSelectedOption = 'bg-background text-foreground border border-foreground';
              const selectedOption = 'bg-foreground text-background';

              return (
                <div
                  key={option}
                  className={`m-1 h-8 w-10 cursor-pointer rounded text-center leading-8 ${selectInterval === index ? selectedOption : unSelectedOption} `}
                  onClick={() => setSelectInterval(index)}
                >
                  {option}
                </div>
              );
            })}
          </div>
        </div>
        {data && (
          <ResponsiveContainer width='100%' height={400} className='bg-background text-foreground'>
            <LineChart width={500} height={300} data={data} margin={{ top: 20, right: 20, left: 20, bottom: 20 }}>
              <CartesianGrid strokeDasharray='3 3' />
              <XAxis dataKey='date' tickFormatter={value => getTickValue(value)} />
              <YAxis domain={['auto', 'auto']} />
              <Tooltip />
              <Line type='monotone' dataKey='priceUsd' stroke='#8884d8' dot={false} />
            </LineChart>
          </ResponsiveContainer>
        )}
      </div>
    </APIComponent>
  );
}