✏️ 환경설정
📍 dependency
// monitering
implementation 'org.springframework.boot:spring-boot-starter-actuator' // actuator
implementation 'io.micrometer:micrometer-core'
implementation 'io.micrometer:micrometer-registry-prometheus' // 프로메테우스
📍 application yml
management:
  endpoints:
    web:
      exposure:
        include: health, info, prometheus
📍 세팅 확인
/actuator경로로 브라우저를 통해 들어가면 모니터링 되고있는 메트릭 정보를 확인할 수 있는 url 을 json 형식으로 제공 하고있다.- 안내하고 있는 url 중
prometheusurl 로 접속해보면 프로메테우스가 조회한 메트릭 정보를 확인할 수 있다. - text 정보로 조회되는데 사람이 읽을 수 없어서 시각화 과정을 거처야 한다.
- 안내하고 있는 url 중
{
  "_links": {
    "self": {
      "href": "http://localhost:8080/actuator",
      "templated": false
    },
    "health-path": {
      "href": "http://localhost:8080/actuator/health/{*path}",
      "templated": true
    },
    "health": {
      "href": "http://localhost:8080/actuator/health",
      "templated": false
    },
    "info": {
      "href": "http://localhost:8080/actuator/info",
      "templated": false
    },
    "prometheus": {
      "href": "http://localhost:8080/actuator/prometheus",
      "templated": false
    }
  }
}
✏️ 프로메테우스 설치
📍 설정 파일 만들기
prometheus가 실행되기 위해선 yml 설정파일이 필요하다.
vim prometheus/prometheus.yml global:
scrape_interval: 5s
scrape_configs:
- job_name: '프로젝트 이름' # 임의로 설정하면 됨
metrics_path: '/actuator/prometheus'
static_configs:
- targets: ['서버:포트']- Ex)
- dns 를 사용하고 있다면 별도로
서버:포트로 구성된 host 를 생성해줘야 한다.
- dns 를 사용하고 있다면 별도로
global:
  scrape_interval: 5s
scrape_configs:
  - job_name: 'baeker'
    metrics_path: '/actuator/prometheus'
    static_configs:
      - targets: ['49.50.164.83:8080']
📍 prometheus run
- 아래명령어를 입력해 prometheus 를 실행시켜준다.
docker run \
  -p 9090:9090 \
  -e TZ=Asia/Seoul \
  -v /home/ubuntu/dep/prometheus.yml:/etc/prometheus/prometheus.yml \
  --name prometheus \
  -d \
  bitnami/prometheus:latest \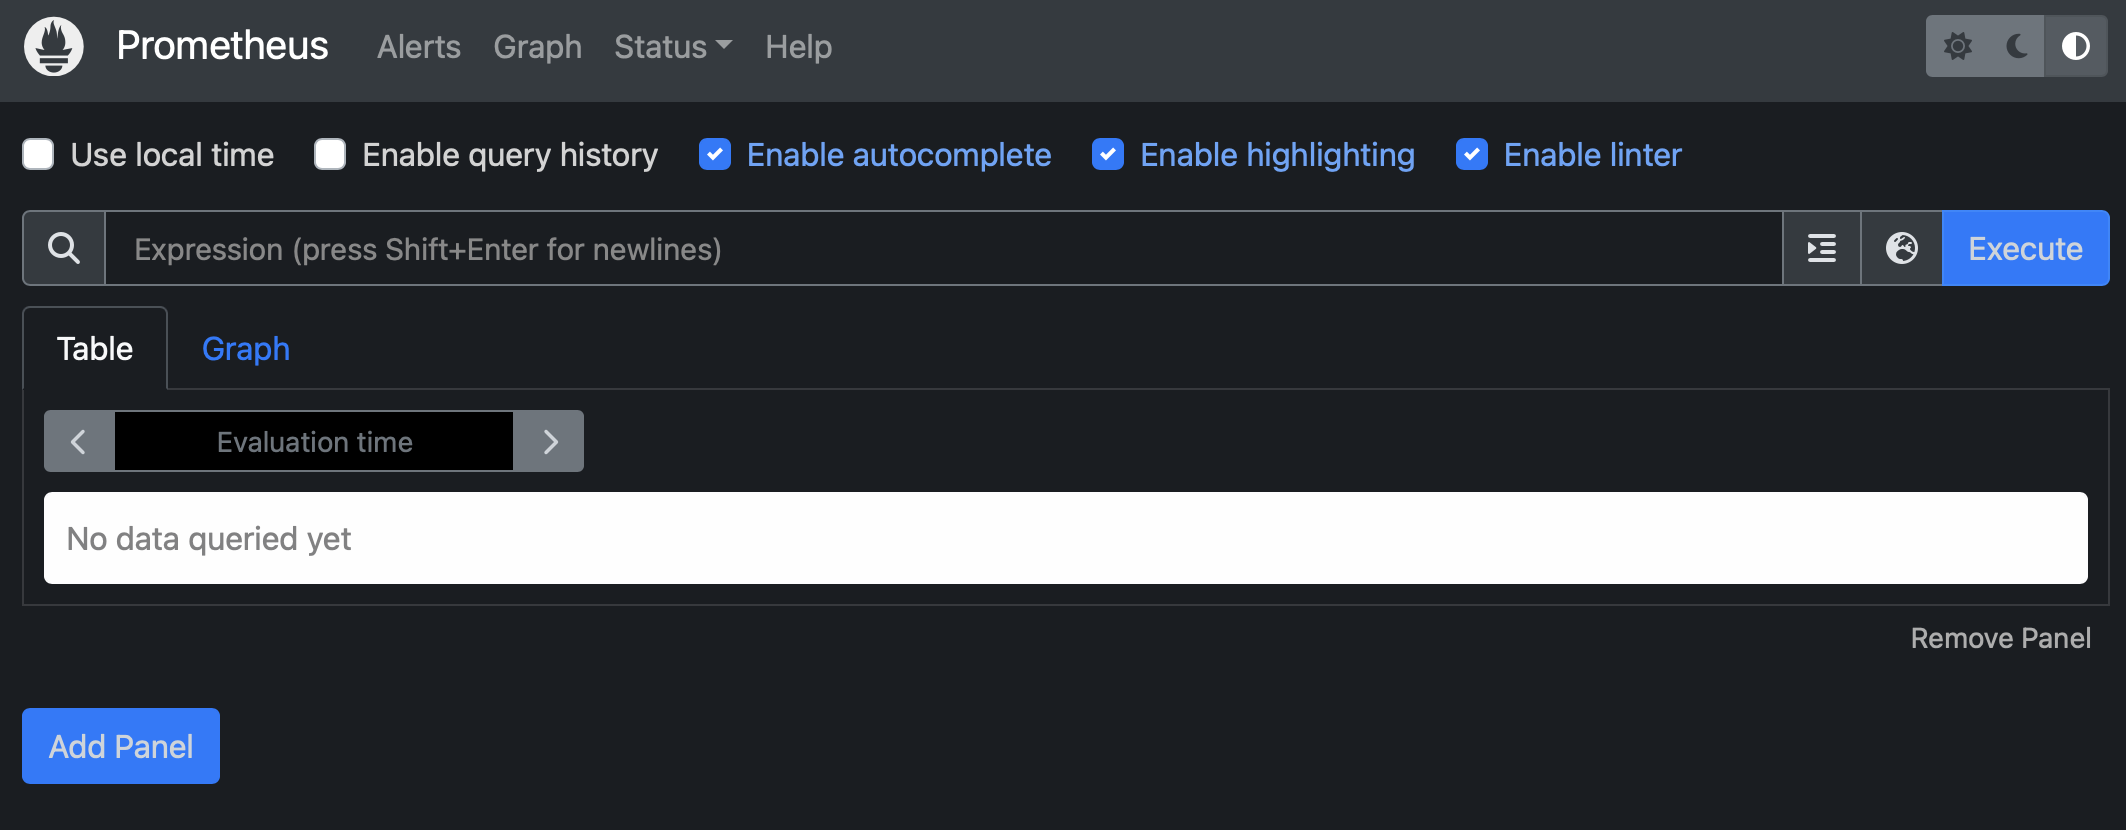
--config.file=/etc/prometheus/prometheus.yml- 도커가 정상적으로 실행되고 있다면 9090 포트로 접속했을 때 프로메테우스의 ui 페이지에 접속하게 된다.
- 상단 네비바 → Status → targets → Endpoint 의 url 을 선택
- 프로메테우스가 수집한 메트릭 데이터를 확인할 수 있다.
- 만약 down 으로 되어있다면 정상적으로 메트릭 정보를 수집하고 있지 않다는 의미이다.
- 상단 네비바 → Status → targets → Endpoint 의 url 을 선택
✏️ Grafana 시작하기
- 프로메테우스가 수집한 메트릭 데이터를 시각화 해서 확인할 수 있지만 더 전문적으로 데이터를 시각화 할 수 있는 Grafana 를 사용해 prometheus 가 수집한 정보를 관리할 수 있다.
📍 Grafana 접속
- grafana 실행
docker run -d \
  -e TZ=Asia/Seoul \
  --name=grafana \
  -p 3000:3000 \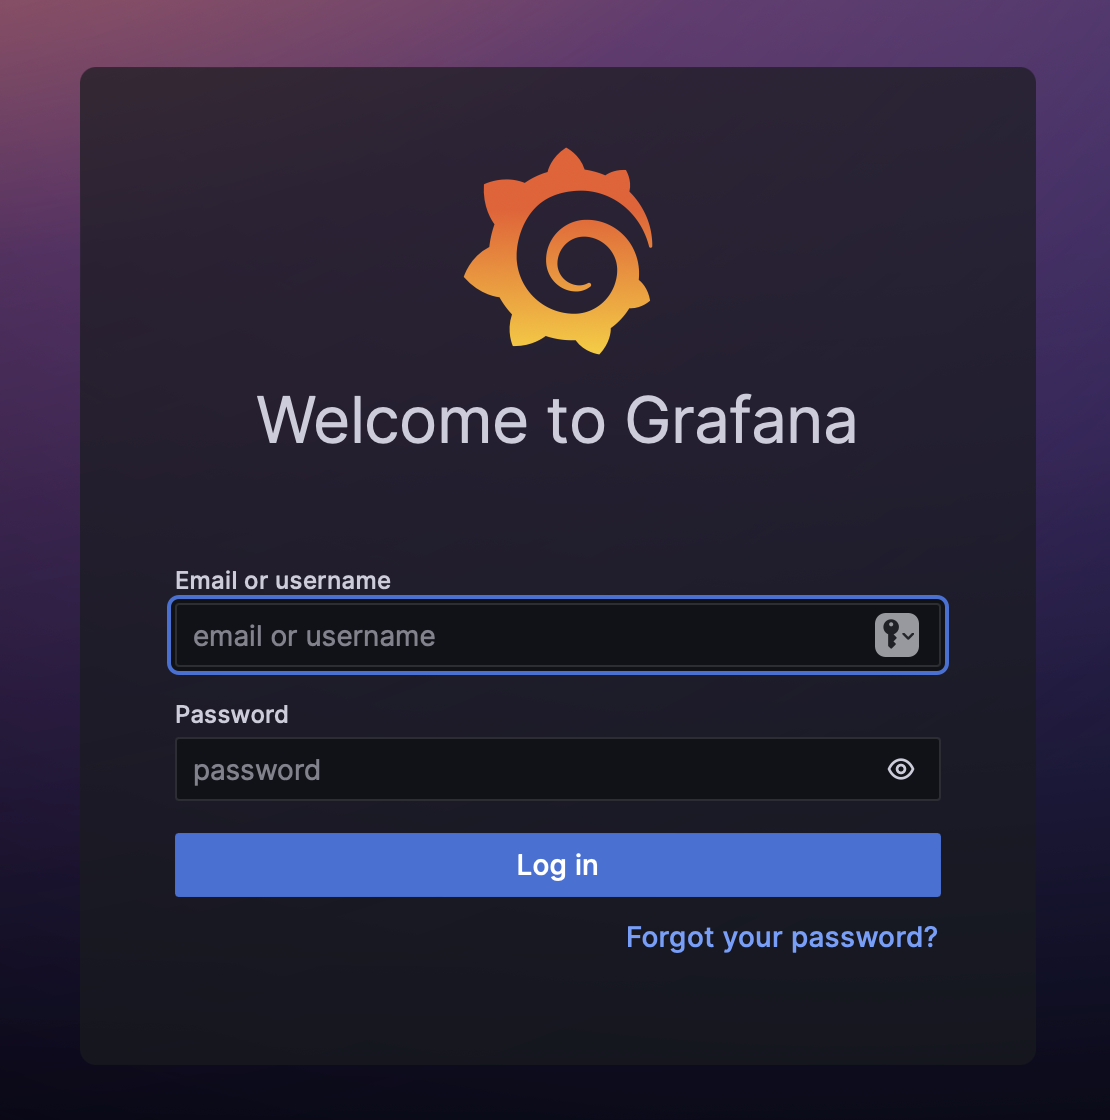
grafana/grafana- 실행되는 것을 확인한 후 3000 번 포트로 이동하면 grafana 로그인 페이지가 나온다.
- 최초 접속시 id 와 pw 는 admin 이다.
📍 대시보드 생성
- 왼쪽 상단 햄버거 매뉴 → Connections → Data sources → Add data source → Prometheus 선택
- Http 항목의 url 에 prometheus 의 url 을 입력 → Save & test → 성공 메시지가 나타나면 연결 성공
📍 그래프 추가하기
- 직접 설정하고, query 를 작성해 모니터링 하기 원하는 그래프를 추가하거나,
그라파나 랩에서 템플릿을 Import 할 수 있다.

잘못된 내용 PR 환영