
🎨 그래프 커스터마이징
1. 그래프 크기 조절 (figsize)
✅ 방법 1: pyplot 방식
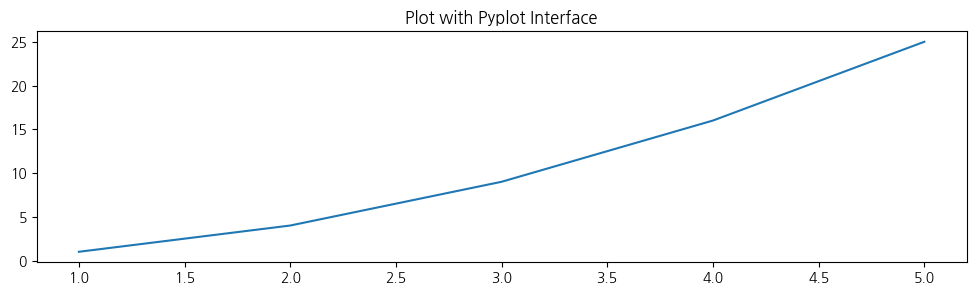
plt.figure(figsize=(12, 3))  # 가로 12인치, 세로 3인치 크기의 그래프 생성
x = [1, 2, 3, 4, 5]
y = [1, 4, 9, 16, 25]
plt.plot(x, y)
plt.title("Plot with Pyplot Interface")
plt.show()
✅ 방법 2: subplots 방식
fig, ax = plt.subplots(figsize=(12, 3))  # fig와 ax 객체에 크기 설정
x = [1, 2, 3, 4, 5]
y = [1, 9, 16, 25, 32]
ax.plot(x, y)
ax.set_title('PLo')
plt.show()
🔍 메서드 설명
plt.figure(figsize=(w,h)): pyplot 방식으로 그래프 크기 지정 (인치 단위)plt.subplots(figsize=(w,h)): 객체지향 방식에서도 크기 지정
2. 축 범위 지정 (set_xlim, set_ylim)
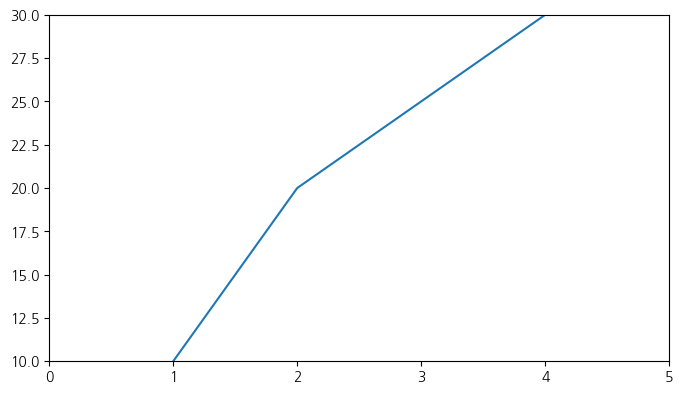
x = [1, 2, 3, 4]
y = [10, 20, 25, 30]
plt.figure(figsize=(8, 4.5))
plt.plot(x, y)
plt.xlim(0, 5)  # x축 범위 지정
plt.ylim(10, 30)  # y축 범위 지정
plt.show()fig, ax = plt.subplots(figsize=(8, 4.5))
ax.plot(x, y)
ax.set_xlim(0, 5)
ax.set_ylim(10, 30)
plt.show()🔍 메서드 설명
plt.xlim()/plt.ylim(): pyplot 방식 축 범위 조절ax.set_xlim()/ax.set_ylim(): 객체지향 방식 축 범위 설정
3. 축 뒤집기 (invert_yaxis)
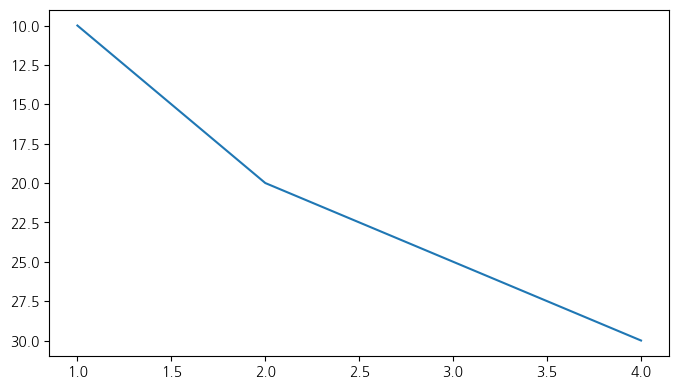
plt.figure(figsize=(8, 4.5))
plt.plot(x, y)
plt.gca().invert_yaxis()  # 현재 축(gca)을 가져와 y축 뒤집기
plt.show()fig, ax = plt.subplots(figsize=(8, 4.5))
ax.plot(x, y)
ax.invert_yaxis() # y축 반전
plt.show()🔍 메서드 설명
gca(): 현재 활성화된 축을 반환invert_yaxis(): y축 방향을 위아래 반전
4. 눈금자/보조 눈금 (minorticks_on, grid)
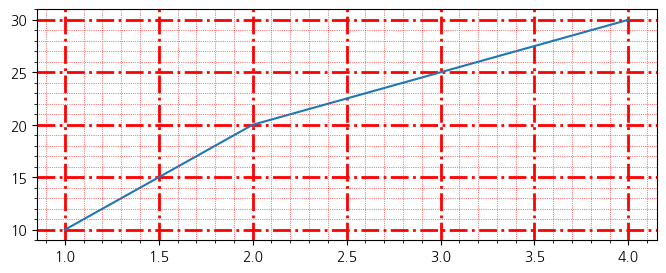
x = [1, 2, 3, 4]
y = [10, 20, 25, 30]
fig, ax = plt.subplots(figsize=(8, 3))
ax.plot(x, y)
ax.minorticks_on()  # 보조 눈금 켜기
ax.grid(which='major', axis='both', color='red', linestyle='-.', linewidth=2)
ax.grid(which='minor', axis='both', color='red', linestyle=':', linewidth=0.5)
plt.show()
🔍 메서드 설명
minorticks_on(): 보조 눈금 표시grid(): 눈금선 설정 (which=major/minor,axis=x/y/both등 조절 가능)
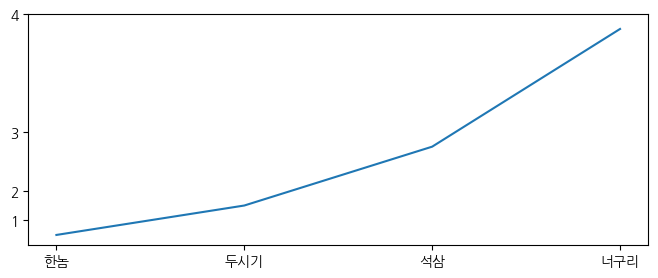
5. 눈금 라벨 지정 (xticks, yticks, set_xticks, set_xticklabels)
✅ pyplot 방식
x = [1, 2, 3, 4]
y = [2, 4, 8, 16]
plt.figure(figsize=(8, 3))
plt.plot(x, y)
plt.xticks([1, 2, 3, 4], ['한놈', '두시기', '석삼', '너구리'])
plt.yticks([3, 5, 9, 17], ['1', '2', '3', '4'])
plt.show()
✅ subplots 방식
fig, ax = plt.subplots(figsize=(8, 3))
ax.plot(x, y)
ax.set_xticks([1, 2, 3, 4])
ax.set_xticklabels(['한놈', '두시기', '석삼', '너구리'])
ax.set_yticks([2, 4, 8, 16])
plt.show()
🔍 메서드 설명
xticks()/yticks(): 눈금 값 및 라벨 지정 (pyplot 방식)set_xticks()/set_xticklabels(): axes 객체 기준으로 눈금 라벨 지정
6. 제목, 축 라벨, 범례 설정

✅ pyplot 방식
x = [1, 3, 5, 7, 9, 11, 13]
y = [10, 20, 30, 45, 80, 95, 100]
plt.plot(x, y, label='여윽시 서브플롯이다', color='#1B1B1B', linestyle='--', marker='o')
plt.xlabel('xname')  # x축 라벨 설정
plt.ylabel('yname')  # y축 라벨 설정
plt.title('식사들 하셨어요?')  # 그래프 제목 설정
plt.legend()  # 범례 표시
plt.show()
✅ subplots 방식
x = [1, 2, 3, 4, 5]
y = [10, 18, 15, 48, 96]
fig, ax = plt.subplots()
ax.plot(x, y, label='여윽시 서브플롯이다', color='#1B1B1B', linestyle='--', marker='o')
ax.set_xlabel('X')  # x축 라벨
ax.set_ylabel('Y')  # y축 라벨
ax.set_title('객체 지향 인터페이스')  # 제목 설정
ax.legend()  # 범례 표시
plt.show()
🔍 메서드 설명
title()/set_title(): 그래프 제목 설정xlabel()/set_xlabel(): x축 이름 설정ylabel()/set_ylabel(): y축 이름 설정legend()/ax.legend(): 범례 표시 (label 지정 필수)
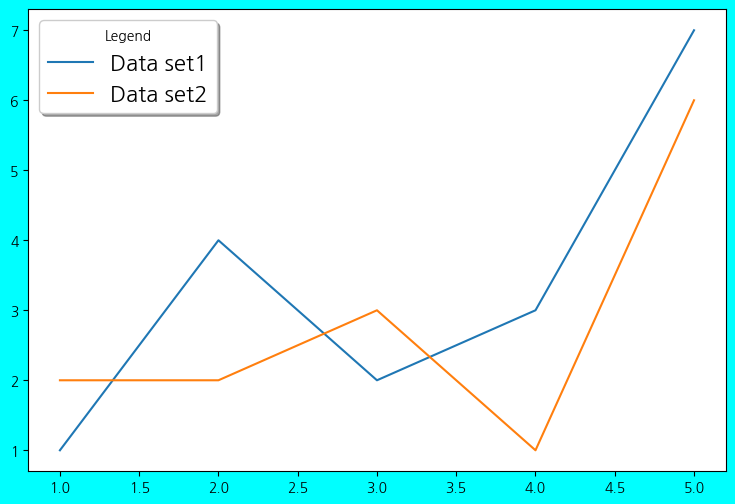
7. 범례 커스터마이징 (legend() 인자 활용)
x = [1, 2, 3, 4, 5]
y1 = [1, 4, 2, 3, 7]
y2 = [2, 2, 3, 1, 6]
plt.figure(figsize=(9, 6), facecolor='Cyan')
plt.plot(x, y1, label='Data set1')
plt.plot(x, y2, label='Data set2')
plt.legend(loc='best', fontsize=16, shadow=True, title='Legend')
plt.show()fig, ax = plt.subplots(figsize=(16, 9), facecolor='black')
x = [1, 2, 3, 4, 5]
y1 = [1, 4, 2, 3, 7]
y2 = [6, 5, 1, 7, 3]
ax.plot(x, y1, label='y1')
ax.plot(x, y2, label='y2')
ax.legend(loc='upper right', fontsize=16, shadow=True, title='THAD')
plt.show()🔍 주요 인자 설명
loc: 범례 위치 지정 ('best','upper right','lower left'등)fontsize: 글자 크기shadow: 그림자 효과title: 범례 상단 제목 추가

this man을 꿈 속에서 보신 적이 있으신가요?