이번 포스팅에서는 Leaflet와 SVG/Canvas를 사용하여 Pixel Art 이미지를 표시하고, 픽셀을 선택하여 색상을 변경하는 기능을 구현하는 과정을 공유하고자 합니다. 이 과정에서 겪었던 시행착오와 해결 방법을 상세히 기록하였습니다.
프로젝트 개요
Leaflet는 주로 지도 시각화를 위해 사용되지만, 이 프로젝트에서는 Leaflet의 줌 및 팬 기능을 활용하여 Pixel Art 이미지를 표시하고, 각 픽셀을 선택하는 기능을 구현했습니다. 초기에는 SVG를 사용했지만, 이후 Canvas로 전환하여 최적화 및 기능 향상을 도모했습니다.
1. 기본 설정
먼저, 기본적인 Leaflet 설정을 진행했습니다.
<!DOCTYPE html>
<html lang="en">
  <head>
    <meta charset="UTF-8" />
    <meta name="viewport" content="width=device-width, initial-scale=1.0" />
    <title>Leaflet with Pixel Art</title>
    <link rel="stylesheet" href="https://unpkg.com/leaflet/dist/leaflet.css" />
    <style>
      #map {
        height: 600px;
        width: 800px;
      }
    </style>
  </head>
  <body>
    <div id="map"></div>
    <script src="https://unpkg.com/leaflet/dist/leaflet.js"></script>
  </body>
</html>
2. SVG를 사용한 초기 구현
처음에는 SVG를 사용하여 이미지를 픽셀 단위로 표시하고, 클릭 이벤트를 통해 색상을 변경하는 기능을 구현했습니다.
document.addEventListener('DOMContentLoaded', () => {
    if (L.DomUtil.get('map')._leaflet_id) {
        L.DomUtil.get('map')._leaflet_id = null;
    }

    const map = L.map('map', {
        crs: L.CRS.Simple,
        minZoom: -5
    }).setView([0, 0], 0);

    const imageUrl = './sample.webp';
    const imageBounds = [[0, 0], [512, 512]];

    const imageOverlay = L.imageOverlay(imageUrl, imageBounds).addTo(map);
    map.fitBounds(imageBounds);

    imageOverlay.on('load', () => {
        const img = document.querySelector('.leaflet-image-layer');
        const svg = document.createElementNS("http://www.w3.org/2000/svg", "svg");
        svg.setAttribute("width", img.naturalWidth);
        svg.setAttribute("height", img.naturalHeight);
        svg.style.position = "absolute";
        svg.style.top = "0";
        svg.style.left = "0";

        const pixelSize = 10; // 픽셀 블록 크기
        const selectedPixels = {}; // 선택된 픽셀의 원래 색상 저장

        // SVG에 픽셀 아트를 그림
        const drawPixelatedImage = () => {
            const ctx = document.createElement('canvas').getContext('2d');
            ctx.canvas.width = img.naturalWidth;
            ctx.canvas.height = img.naturalHeight;
            ctx.drawImage(img, 0, 0);

            for (let y = 0; y < ctx.canvas.height; y += pixelSize) {
                for (let x = 0; x < ctx.canvas.width; x += pixelSize) {
                    const pixelData = ctx.getImageData(x, y, pixelSize, pixelSize).data;
                    const r = pixelData[0];
                    const g = pixelData[1];
                    const b = pixelData[2];

                    const rect = document.createElementNS("http://www.w3.org/2000/svg", "rect");
                    rect.setAttribute("x", x);
                    rect.setAttribute("y", y);
                    rect.setAttribute("width", pixelSize);
                    rect.setAttribute("height", pixelSize);
                    rect.setAttribute("fill", `rgb(${r}, ${g}, ${b})`);
                    rect.addEventListener('click', () => {
                        const pixelKey = `${x},${y}`;
                        if (selectedPixels[pixelKey]) {
                            rect.setAttribute("fill", `rgb(${selectedPixels[pixelKey][0]}, ${selectedPixels[pixelKey][1]}, ${selectedPixels[pixelKey][2]})`);
                            delete selectedPixels[pixelKey];
                        } else {
                            selectedPixels[pixelKey] = [r, g, b];
                            rect.setAttribute("fill", "red");
                        }
                        console.log(`Coordinates: (${x}, ${y}), Color: rgb(${r}, ${g}, ${b})`);
                    });
                    svg.appendChild(rect);
                }
            }
        };

        drawPixelatedImage();
        img.style.display = 'none';
        img.parentNode.insertBefore(svg, img);

        const updateSvgPosition = () => {
            const bounds = imageOverlay._bounds;
            const topLeft = map.latLngToLayerPoint(bounds.getNorthWest());
            const bottomRight = map.latLngToLayerPoint(bounds.getSouthEast());

            svg.style.width = `${bottomRight.x - topLeft.x}px`;
            svg.style.height = `${bottomRight.y - topLeft.y}px`;
            svg.style.transform = `translate(${topLeft.x}px, ${topLeft.y}px)`;
        };

        map.on('zoomend', updateSvgPosition);
        map.on('moveend', updateSvgPosition);
        updateSvgPosition();
    });
});
3. Canvas로 전환한 이유
SVG를 사용한 초기 구현은 픽셀 단위의 세부 조작이 가능했지만, 성능 문제가 발생했습니다. 특히 큰 이미지의 경우 SVG 요소가 많아지면 브라우저 성능이 저하되었습니다. 이를 해결하기 위해 Canvas로 전환했습니다.
4. Canvas를 사용한 최종 구현
Canvas를 사용하여 픽셀 단위 이미지를 그리고, 클릭 이벤트를 통해 색상을 변경하는 기능을 구현했습니다.
document.addEventListener('DOMContentLoaded', () => {
    if (L.DomUtil.get('map')._leaflet_id) {
        L.DomUtil.get('map')._leaflet_id = null;
    }

    const map = L.map('map', {
        crs: L.CRS.Simple,
        minZoom: -5
    }).setView([0, 0], 0);

    const imageUrl = './sample.webp';
    const imageBounds = [[0, 0], [512, 512]];

    const imageOverlay = L.imageOverlay(imageUrl, imageBounds).addTo(map);
    map.fitBounds(imageBounds);

    imageOverlay.on('load', () => {
        const img = document.querySelector('.leaflet-image-layer');
        const canvas = document.createElement('canvas');
        canvas.width = img.naturalWidth;
        canvas.height = img.naturalHeight;
        const ctx = canvas.getContext('2d');
        ctx.drawImage(img, 0, 0);

        img.style.display = 'none';
        img.parentNode.insertBefore(canvas, img);

        canvas.style.position = 'absolute';
        canvas.style.top = '0';
        canvas.style.left = '0';

        const pixelSize = 10; // 픽셀 블록 크기
        const selectedPixels = {}; // 선택된 픽셀의 원래 색상 저장

        // 캔버스에 픽셀 아트를 그림
        const drawPixelatedImage = () => {
            for (let y = 0; y < canvas.height; y += pixelSize) {
                for (let x = 0; x < canvas.width; x += pixelSize) {
                    const pixelData = ctx.getImageData(x, y, pixelSize, pixelSize).data;
                    const r = pixelData[0];
                    const g = pixelData[1];
                    const b = pixelData[2];

                    ctx.fillStyle = `rgb(${r}, ${g}, ${b})`;
                    ctx.fillRect(x, y, pixelSize, pixelSize);
                }
            }
        };

        drawPixelatedImage();

        const updateCanvasPosition = () => {
            const bounds = imageOverlay._bounds;
            const topLeft = map.latLngToLayerPoint(bounds.getNorthWest());
            const bottomRight = map.latLngToLayerPoint(bounds.getSouthEast());

            canvas.style.width = `${bottomRight.x - topLeft.x}px`;
            canvas.style.height = `${bottomRight.y - topLeft.y}px`;
            canvas.style.transform = `translate(${topLeft.x}px, ${topLeft.y}px)`;
        };

        map.on('zoomend', updateCanvasPosition);
        map.on('moveend', updateCanvasPosition);
        updateCanvasPosition();

        let isDragging = false;

        canvas.addEventListener('mousedown', () => {
            isDragging = false;
        });

        canvas.addEventListener('mousemove', () => {
            isDragging = true;
        });

        canvas.addEventListener('mouseup', (e) => {
            if (!isDragging) {
                const rect = canvas.getBoundingClientRect();
                const scaleX = canvas.width / rect.width;
                const scaleY = canvas.height / rect.height;
                const x = Math.floor((e.clientX - rect.left) * scaleX / pixelSize) * pixelSize;
                const y = Math.floor((e.clientY - rect.top) * scaleY / pixelSize) * pixelSize;


 const pixelKey = `${x},${y}`;
                const pixel = ctx.getImageData(x, y, pixelSize, pixelSize).data;

                if (selectedPixels[pixelKey]) {
                    const originalColor = selectedPixels[pixelKey];
                    ctx.fillStyle = `rgb(${originalColor[0]}, ${originalColor[1]}, ${originalColor[2]})`;
                    delete selectedPixels[pixelKey];
                } else {
                    selectedPixels[pixelKey] = [pixel[0], pixel[1], pixel[2]];
                    ctx.fillStyle = "red";
                }
                ctx.fillRect(x, y, pixelSize, pixelSize);
                console.log(`Coordinates: (${x}, ${y}), Color: rgb(${pixel[0]}, ${pixel[1]}, ${pixel[2]})`);
            }
        });
    });
});
5. 시행착오 및 문제 해결
문제 1: 확대 및 축소 기능이 정상 작동하지 않음
- 해결 방법:
updateCanvasPosition함수를 통해 줌 및 이동 이벤트에 따라 캔버스의 위치를 업데이트하여 문제를 해결했습니다.
문제 2: 선택한 픽셀이 잘못된 위치에서 선택됨
- 해결 방법:
getBoundingClientRect와scaleX,scaleY를 사용하여 정확한 좌표를 계산하도록 수정했습니다.
문제 3: 드래그 중에도 픽셀 선택 이벤트 발생
- 해결 방법:
mousedown,mousemove,mouseup이벤트를 통해 드래그 중에는 픽셀 선택 이벤트가 발생하지 않도록 했습니다.
문제 4: SVG 성능 문제
- 해결 방법: SVG 대신 Canvas를 사용하여 성능 문제를 해결했습니다.
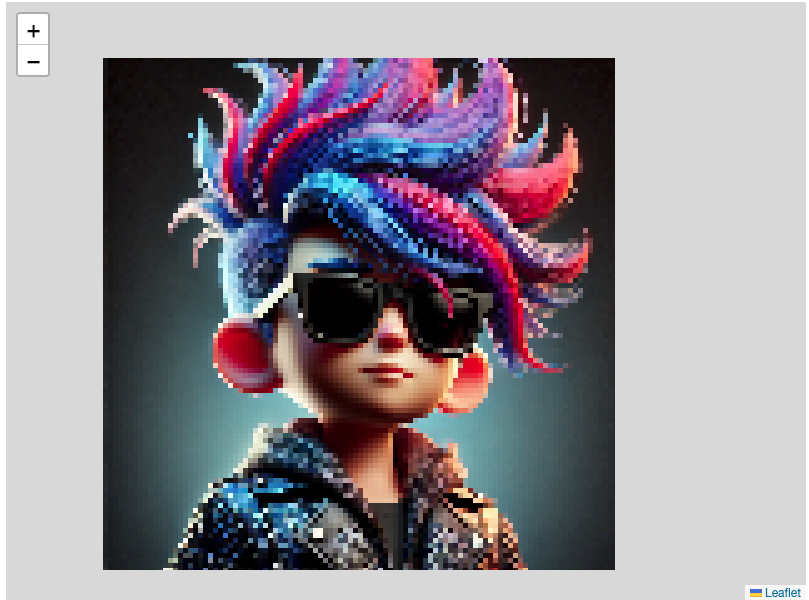
최종 결과
- 확대 및 축소 기능이 잘 작동하며, 각 픽셀을 선택하고 다시 선택하여 색상을 변경할 수 있습니다.
- 선택된 픽셀의 좌표와 색상 정보는 콘솔에 로그로 출력됩니다.
- Canvas를 사용하여 성능을 최적화했습니다.
결론
이번 프로젝트를 통해 Leaflet와 SVG/Canvas를 결합하여 Pixel Art 이미지를 표시하고, 각 픽셀을 선택하는 기능을 구현했습니다. 이 과정에서 여러 시행착오를 겪었지만, 이를 해결하며 많은 것을 배울 수 있었습니다. 이 글이 비슷한 기능을 구현하고자 하는 분들께 도움이 되길 바랍니다.
위의 글을 바탕으로 필요에 따라 추가 정보를 삽입하거나 수정하여 블로그에 게시하시면 됩니다. 추가 질문이 있으시면 언제든지 문의해주세요!