
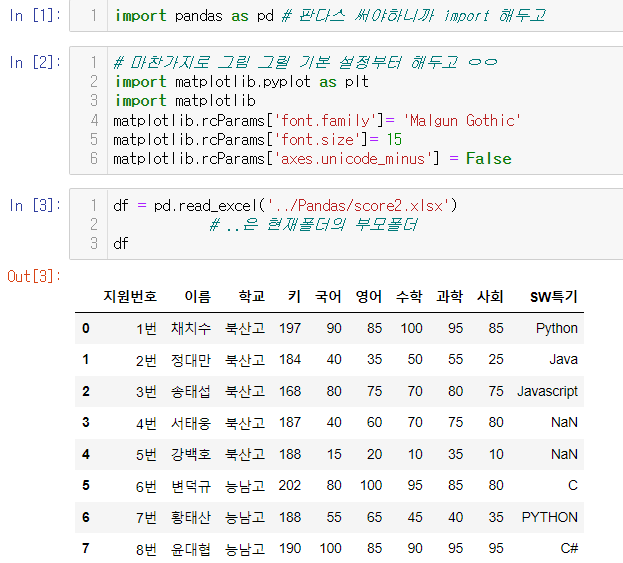
리스트에 수작업으로 넣어서 만든 데이터 말고, 실제 pandas 데이터프레임을 가져와서 작업해보자.
- 기본 설정 & 데이터 준비
(.read_excel()로 Pandas 배울 때 썼던 '슬램덩크 학생' 데이터 다시 불러옴)
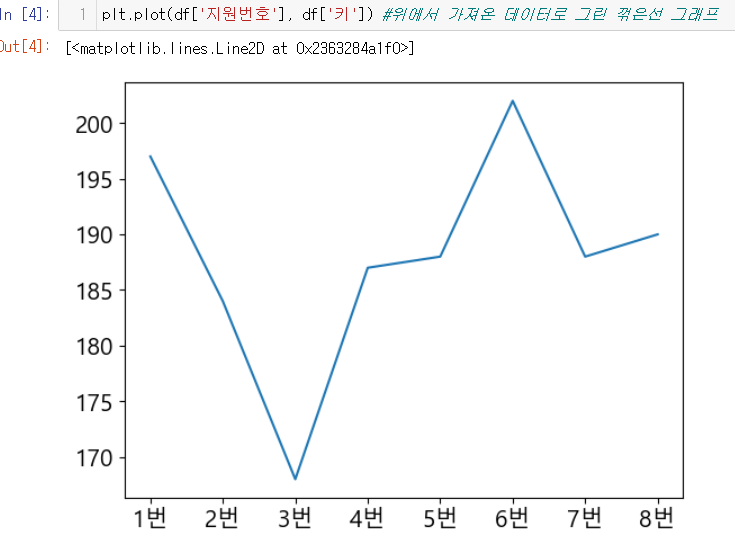
그래프 생성
- 똑같이
plt.plot()하면 되는데, x와 y값으로 DataFrame을 전달해주면 됨!
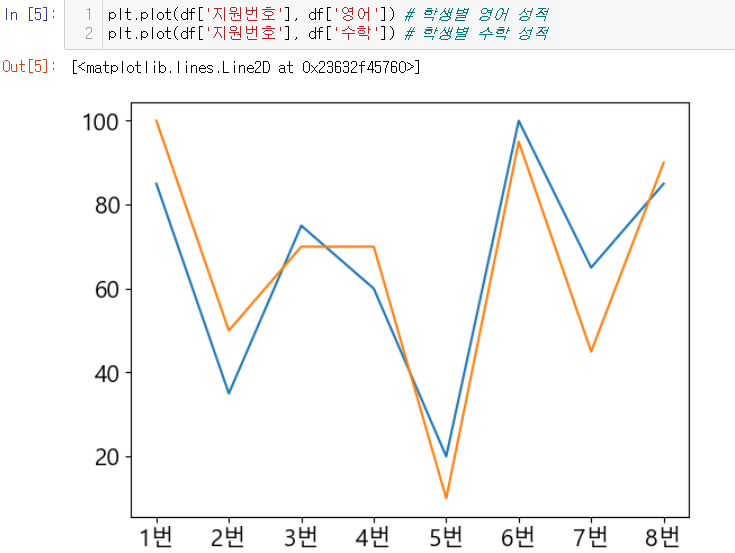
- 역시 그래프 여러 개를 한 번에 그릴 수도 있음.
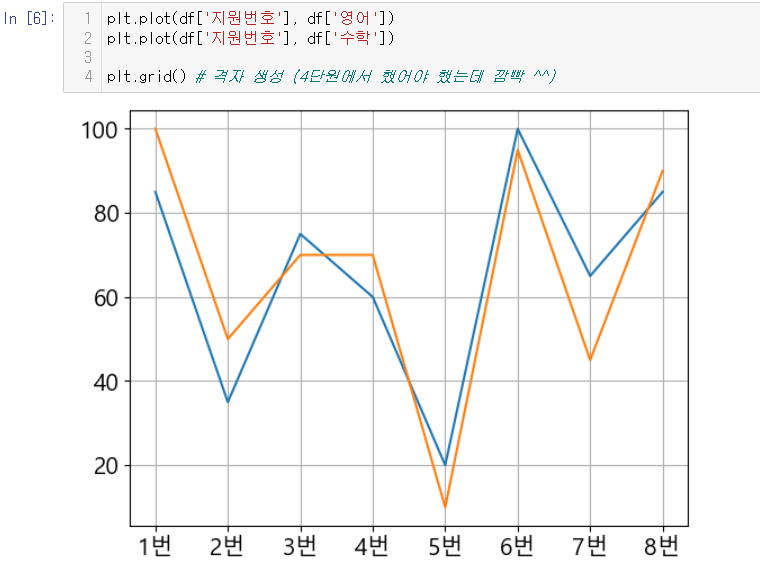
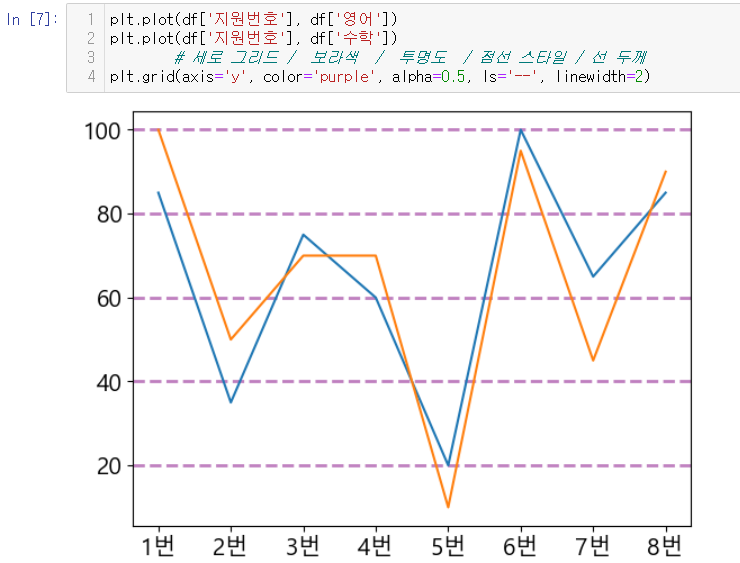
격자 설정
plt.grid()를 써서 격자를 깔아주면 수치를 확인하기 더 좋음.
(04차시에 했어야 하는 건데 깜빡했네요^^;)
- 격자에 대한 세부적인 설정도 가능함.
↪axis,color,alpha,linestyle,linewidth등

생각은 그만