시작
svg를 이용해 라인차트를 그릴 일이 있었다. 그런데 사용하는 차트에서 기본적으로 제공하는 animated 속성은 내가 원하던 것과는 달랐다. 라인차트의 선이 그려지는 것이 아닌 데이터 셋이 변화할 때 라인이 변화하는 것이었다.
물론 충분히 좋은 효과였지만 내가 원하는 것은 첫번째부터 마지막 데이터까지 라인이 그려지는 효과였다. masked-carousel 구현때와 같이 reanimated 를 사용해서 svg path를 한번 그려 보기로 했다.
svg path + animation?
내가 하려는게 정말 가능한 것인지, 어떤 방식으로 구현해야 하는지를 구글링 해보았다. 애니메이션 효과는 svg path의 dash 관련 속성을 이용해서 애니메이션처럼 효과를 낼 수 있었다.
- stroke-dasharray
기본적으로 solid line인 path를 점선(또는 파선)으로 만들 수 있는 속성이다. 아래 예제에서 stroke-dasharray에 설정한 값들에 따라 선이 변형되는 것을 볼 수 있다.
<svg viewBox="0 0 30 12" xmlns="http://www.w3.org/2000/svg">
  <style>
    line {
      stroke: black;
    }
  </style>
  <!-- No dashes nor gaps -->
  <line x1="0" y1="1" x2="30" y2="1" />

  <!-- Dashes and gaps of the same size -->
  <line x1="0" y1="3" x2="30" y2="3" stroke-dasharray="4" />

  <!-- Dashes and gaps of different sizes -->
  <line x1="0" y1="5" x2="30" y2="5" stroke-dasharray="4 1" />

  <!-- Dashes and gaps of various sizes with an odd number of values -->
  <line x1="0" y1="7" x2="30" y2="7" stroke-dasharray="4 1 2" />

  <!-- Dashes and gaps of various sizes with an even number of values -->
  <line x1="0" y1="9" x2="30" y2="9" stroke-dasharray="4 1 2 3" />

  <!-- Dashes starting with a gap -->
  <line x1="0" y1="11" x2="30" y2="11" stroke-dasharray="0 4 0" />
</svg>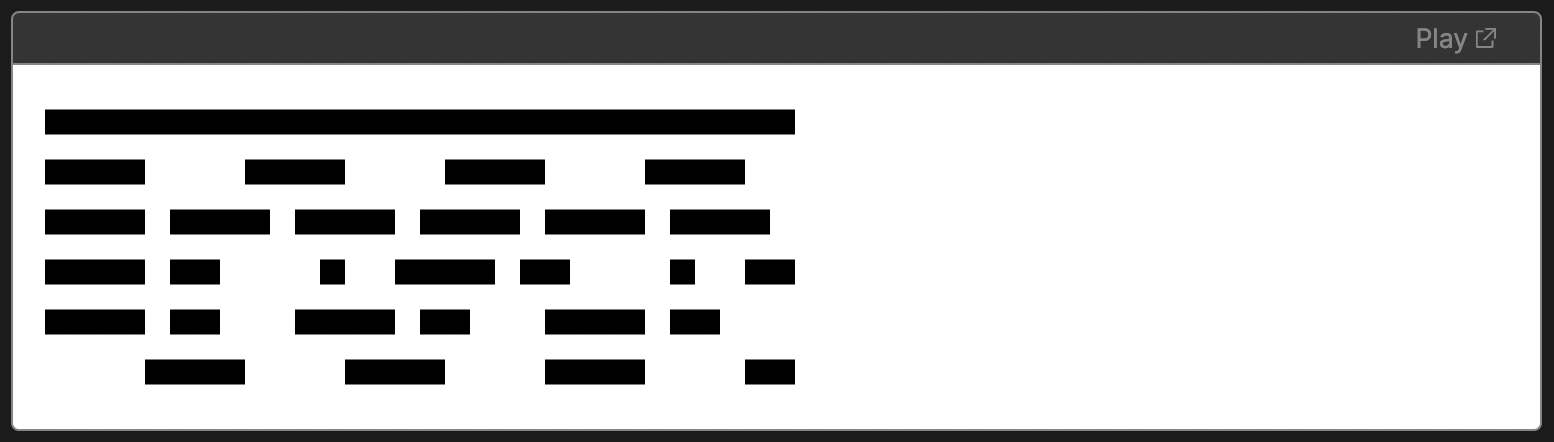
- stroke-dashoffset
기본적으로 path의 dash속성이 시작되는 지점을 설정할 수 있는 속성이다. 아래 예제에서 stroke-dashoffset값에 따라 dasharray가 시작되는 지점이 달라진다.
<svg viewBox="-3 0 33 10" xmlns="http://www.w3.org/2000/svg">
  <!-- No dash array -->
  <line x1="0" y1="1" x2="30" y2="1" stroke="black" />

  <!-- No dash offset -->
  <line x1="0" y1="3" x2="30" y2="3" stroke="black" stroke-dasharray="3 1" />

  <!--
  The start of the dash array computation
  is pulled by 3 user units
  -->
  <line
    x1="0"
    y1="5"
    x2="30"
    y2="5"
    stroke="black"
    stroke-dasharray="3 1"
    stroke-dashoffset="3" />

  <!--
  The start of the dash array computation
  is pushed by 3 user units
  -->
  <line
    x1="0"
    y1="7"
    x2="30"
    y2="7"
    stroke="black"
    stroke-dasharray="3 1"
    stroke-dashoffset="-3" />

  <!--
  The start of the dash array computation
  is pulled by 1 user units which ends up
  in the same rendering as the previous example
  -->
  <line
    x1="0"
    y1="9"
    x2="30"
    y2="9"
    stroke="black"
    stroke-dasharray="3 1"
    stroke-dashoffset="1" />

  <!--
  the following red lines highlight the
  offset of the dash array for each line
  -->
  <path d="M0,5 h-3 M0,7 h3 M0,9 h-1" stroke="rgba(255,0,0,.5)" />
</svg>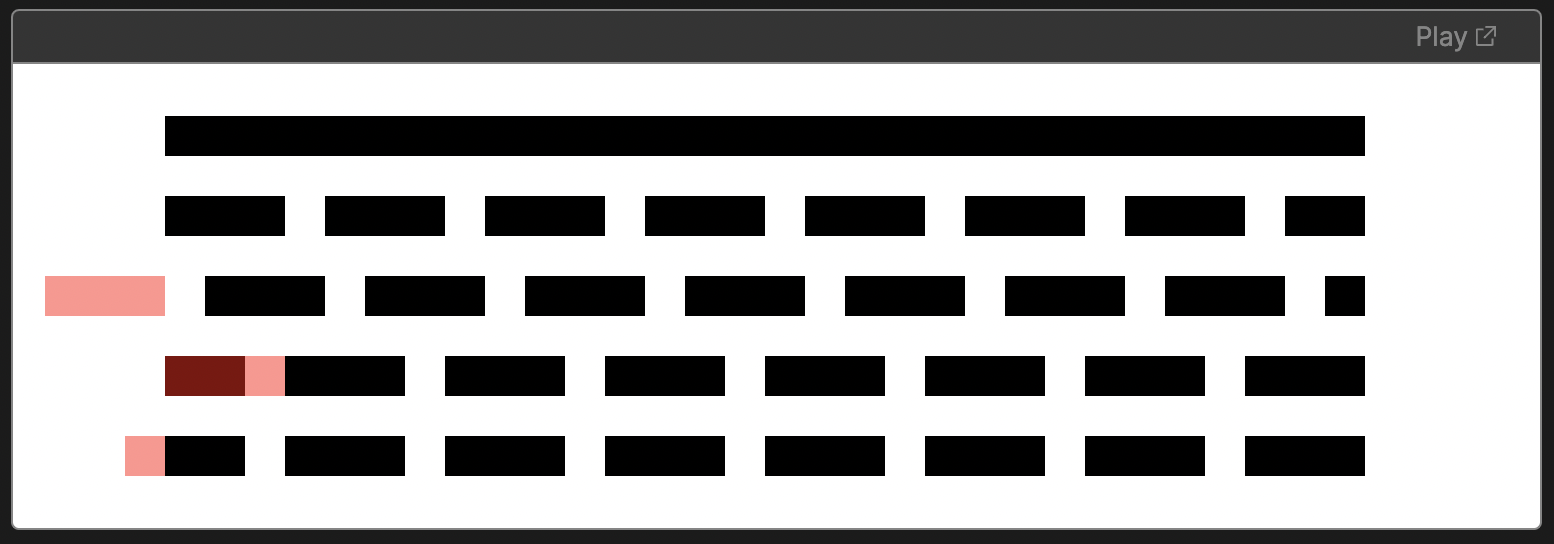
dasharray + dashoffset
선이 그려지는 것 처럼 보이기 위해서는 path를 그리고, 그 path의 길이와 동일하게 dasharray를 설정한 후 dashoffset값을 reanimated의 withTiming을 통해 시간에 따라 변경한다면 dash가 드러나며 선이 그려지는 것 처럼 보일 수 있다.
import { svgPathProperties } from "svg-path-properties";

/*...*/

const PATH_STRING = "M61.511 47.312C60.231 48.2507 ..."
const PATH_LENGTH = new svgPathProperties(PATH_STRING).getTotalLength();
const ANIM_DURATION = 5000;

/*...*/

const AnimatedPath = Animated.createAnimatedComponent(Path);
const strokeOffsetValue = useSharedValue(0);
const animatedProps = useAnimatedProps(() => {
  return {
    strokeDashoffset: PATH_LENGTH - PATH_LENGTH * strokeOffsetValue.value,
  };
});

const executePathAnim = () => {
  strokeOffsetValue.value = withTiming(1, {
    duration: ANIM_DURATION
  });
};

/*...*/<Svg>
<AnimatedPath
d={PATH_STRING}
animatedProps={animatedProps}
stroke={"#1d1d1d"}
strokeWidth={2}
strokeDasharray={PATH_LENGTH}
/>
</Svg>
createAnimatedComponent는?애니메이션을 적용하고 싶은 컴포넌트를
createAnimatedComponent을 통해 접근하면 해당 컴포넌트의 속성이나 스타일에 reanimated 애니메이션을 적용할 수 있다.
svg-path-properties는?동적으로 생성되는 라인 차트의 총 길이를 Path의 속성을 통해 가져오기 위해서 사용한 패키지이다.
뭔가 이상하게 그려진다
위의 예제코드와 구현결과를 보았을때 ANIM_DURATION이 4초로 설정되어있음에도 너무 빨리 그려지는 것을 볼 수 있다. 아마도 여러 글자들로 이루어진 Svg Path가 하나의 문자열로 되어있어 getTotalLength()에서 제대로 된 길이를 가져오지 못하는 것으로 보인다. 글자를 쪼개어 각자 컴포넌트로 구현해주기로 했다.
/*...*/
const PATH_STRING = [
  "M61.511 47.312 ...",
  "M68.89 9.10402C68.89 8.59 ...",
  "..."
]
/*...*/
const AnimatedPathWrapper = ({
    sharedValue,
    pathString,
  }: {
    sharedValue: Animated.SharedValue<number>;
    pathString: string;
  }) => {
    const pathLength = new svgPathProperties(pathString).getTotalLength();
    const AnimatedPath = Animated.createAnimatedComponent(Path);
    const animatedProps = useAnimatedProps(() => {
      return {
        strokeDashoffset: pathLength - pathLength * sharedValue.value,
      };
    });

    return (
      <AnimatedPath
        d={pathString}
        animatedProps={animatedProps}
        stroke={"#1d1d1d"}
        strokeWidth={2}
        strokeDasharray={pathLength}
      />
    );
};<Svg>
{PATH_STRING.map((value) => {
return (
<AnimatedPathWrapper
sharedValue={strokeOffsetValue}
pathString={value}
/>
);
})}
</Svg>
목표 50% 달성
여기까지 svg path가 그려지는 애니메이션까지는 만들어보았다. 다음 글에서는 react-native-svg-charts 패키지와 함께 라인 차트에 애니메이션을 적용할 수 있는지 알아보겠다.
소스코드 전체는 여기에서 확인가능하다!
참고