3. 데이터 정보 가져오기
import pandas as pd
from glob import glob

# 파일 목록 한번에 가져오기
glob("../data/지역_위치별*.xls") # 파일명이 '지역_위치별~ '로 해당하는 파일 전부 읽어오기 ['../data\지역위치별(주유소) (1).xls',
'../data\지역위치별(주유소) (10).xls',
'../data\지역위치별(주유소) (11).xls',
'../data\지역위치별(주유소) (12).xls',
'../data\지역위치별(주유소) (13).xls',
'../data\지역위치별(주유소) (14).xls',
'../data\지역위치별(주유소) (15).xls',
'../data\지역위치별(주유소) (16).xls',
'../data\지역위치별(주유소) (17).xls',
'../data\지역위치별(주유소) (18).xls',
'../data\지역위치별(주유소) (19).xls',
'../data\지역위치별(주유소) (2).xls',
'../data\지역위치별(주유소) (20).xls',
'../data\지역위치별(주유소) (21).xls',
'../data\지역위치별(주유소) (22).xls',
'../data\지역위치별(주유소) (23).xls',
'../data\지역위치별(주유소) (24).xls',
'../data\지역위치별(주유소) (3).xls',
'../data\지역위치별(주유소) (4).xls',
'../data\지역위치별(주유소) (5).xls',
'../data\지역위치별(주유소) (6).xls',
'../data\지역위치별(주유소) (7).xls',
'../data\지역위치별(주유소) (8).xls',
'../data\지역위치별(주유소) (9).xls',
'../data\지역_위치별(주유소).xls']
# 파일명 저장
stations_files = glob("../data/지역_*.xls")
stations_files[:5]

# 하나만 읽어오기
# tmp = pd.read_excel(stations_files[0]) --> unnamed 같이 여러 알수없는 column명 있어서 header 따로설정
tmp = pd.read_excel(stations_files[0], header=2)
tmp.tail(3)
tmp_raw = []
for file_name in stations_files:
    tmp = pd.read_excel(file_name, header=2)
    tmp_raw.append(tmp)
tmp_raw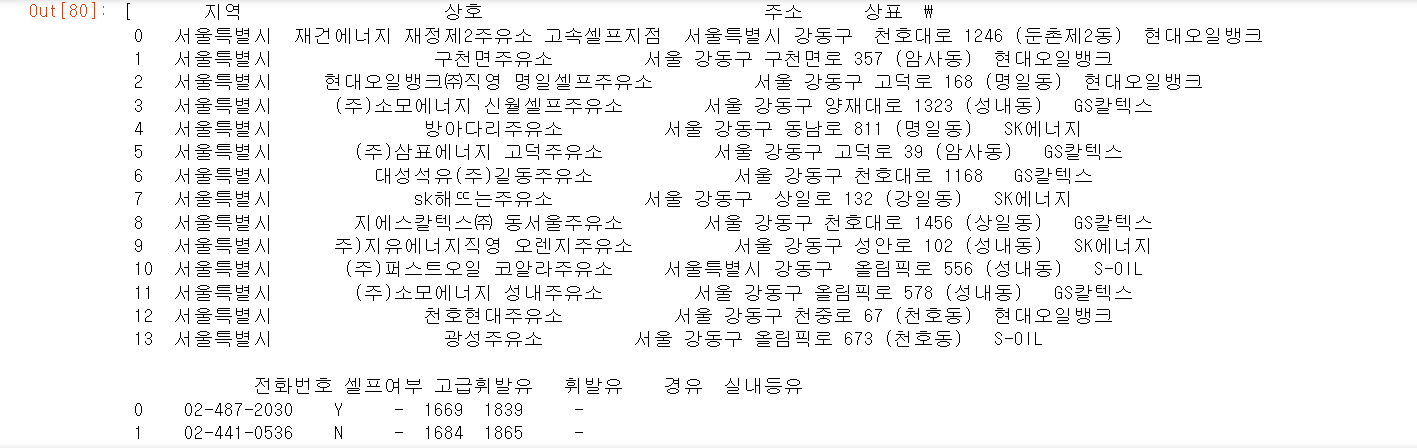
station_raw = pd.concat(tmp_raw)
station_raw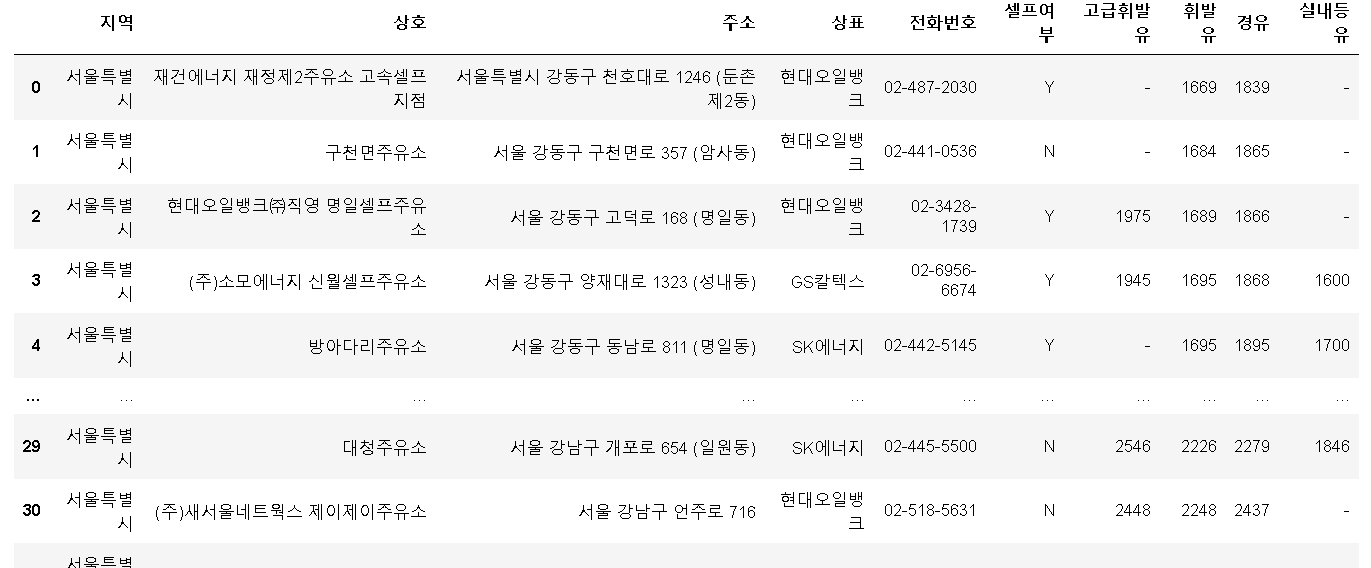
station_raw.columnsIndex(['지역', '상호', '주소', '상표', '전화번호', '셀프여부', '고급휘발유', '휘발유', '경유', '실내등유'], dtype='object')
stations = pd.DataFrame({
    "상호" : station_raw["상호"],
    "주소" : station_raw["주소"],
    "가격" : station_raw["휘발유"],
    "셀프여부" : station_raw["셀프여부"],
    "상표" : station_raw["상표"],
})
stations.tail()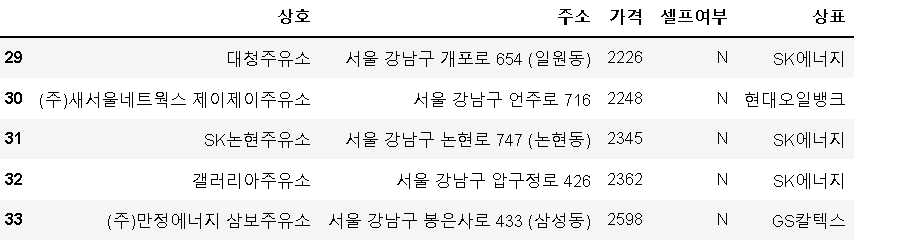
for eachAddress in stations["주소"]:
    print(eachAddress.split()[1])
# 구 column 만들기
stations["구"] = [eachAddress.split()[1] for eachAddress in stations["주소"]]
stations.head()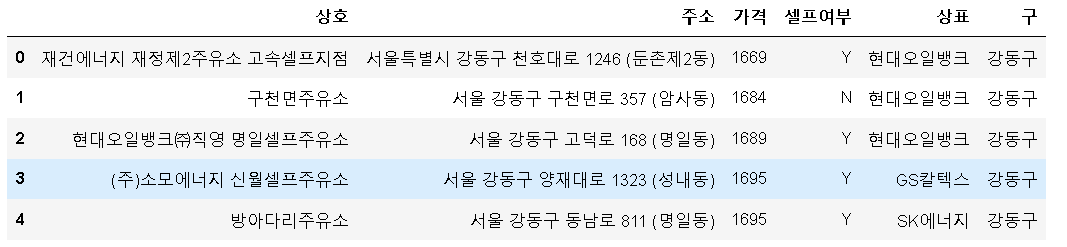
stations["구"].unique()array(['강동구', '동대문구', '동작구', '마포구', '서대문구', '서초구', '성동구', '성북구', '송파구',
'양천구', '영등포구', '강북구', '용산구', '은평구', '종로구', '중구', '중랑구', '강서구',
'관악구', '광진구', '구로구', '금천구', '노원구', '도봉구', '강남구'], dtype=object)
# 가격 데이터형 변환 object -> float
# 그 전에 가격정보가 없는 데이터 확인

stations[stations["가격"]=="-"]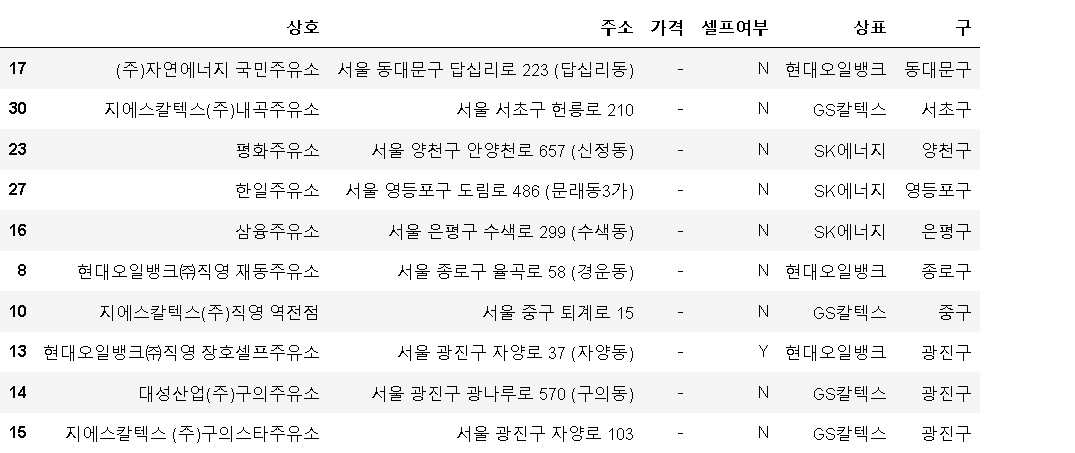
# 가격정보가 있는 주유소만 사용

stations = stations[stations["가격"]!="-"]
stations.info()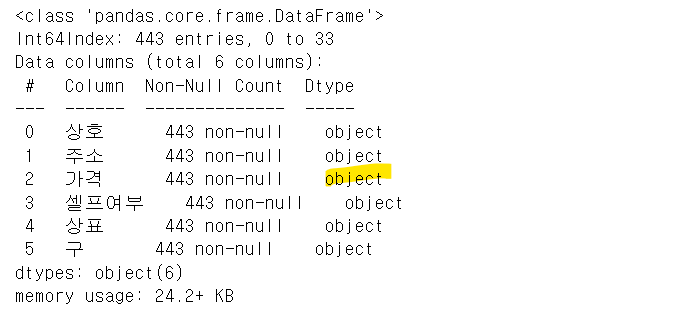
stations["가격"] = stations["가격"].astype("float")
stations.info()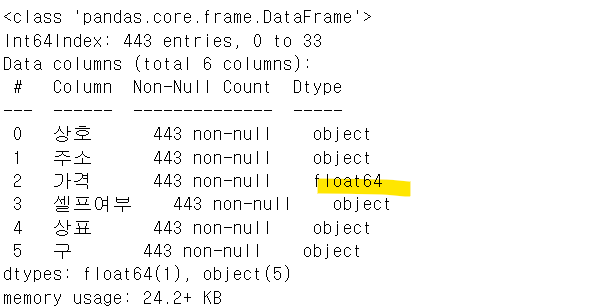
# 인덱스 재정렬
stations.reset_index(inplace=True)

stations.tail()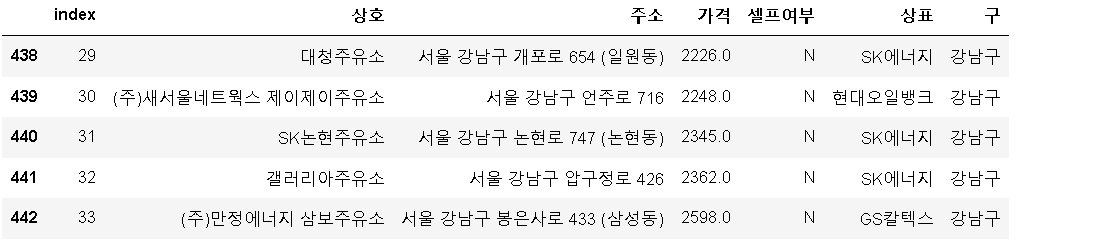
# index컬럼 삭제
del stations["index"]
4. 주유 가격 정보 시각화
import matplotlib.pyplot as plt
import seaborn as sns
import platform
from matplotlib import font_manager, rc

get_ipython().run_line_magic("matplotlib", "inline")
# %matplotlib inline

path = "C:/Windows/Fonts/malgun.ttf"

if platform.system() == "Darwin":
    rc("font", family="Arial Unicode MS")
elif platform.system() == "Windows":
    font_name = font_manager.FontProperties(fname=path).get_name()
    rc("font", family=font_name)
else:
    print("Unkown system. sorry!!")


# boxplot (pandas)

stations.boxplot(column="가격", by="셀프여부", figsize=(12, 8));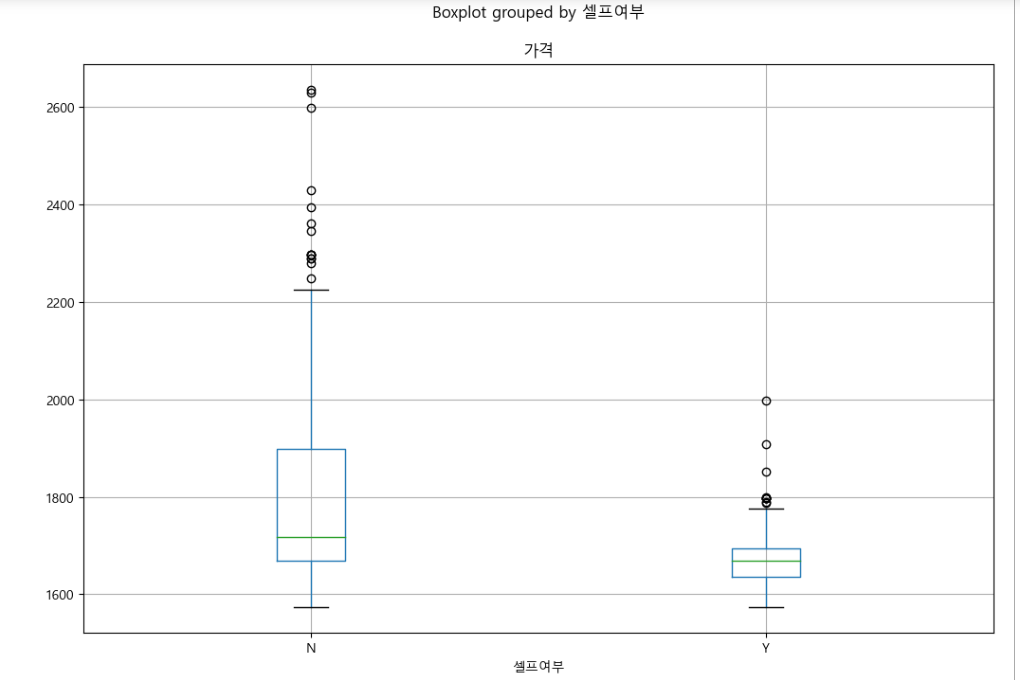
# boxplot (seaborn)

plt.figure(figsize=(12, 8))
sns.boxplot(x="셀프여부", y="가격", data=stations, palette="Set3")
plt.grid(True)
plt.show()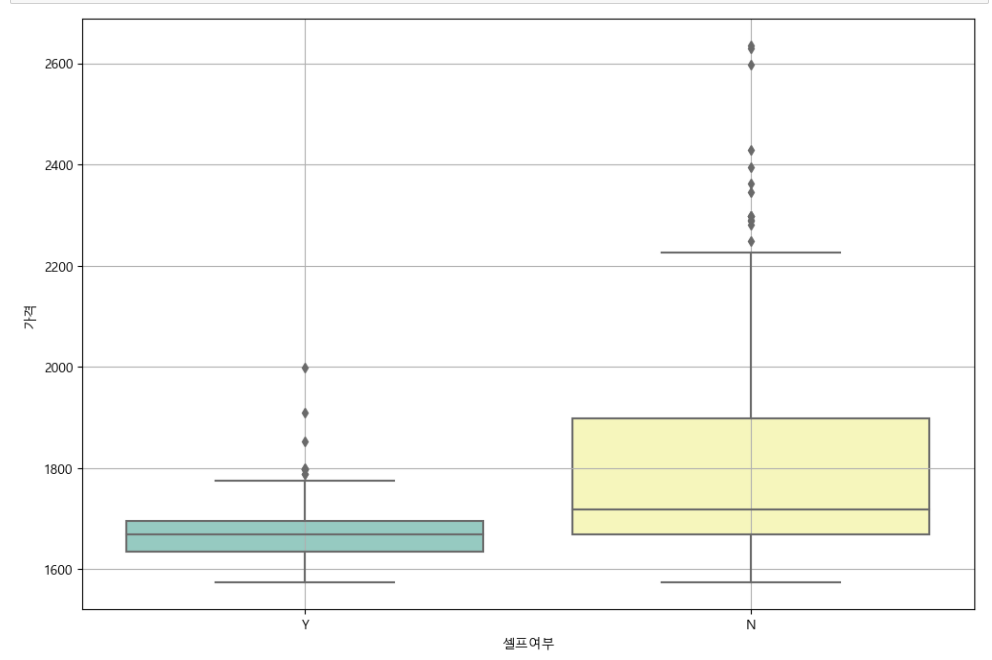
# boxplot(seaborn)
# 브랜드 별 가격정보까지 확인

plt.figure(figsize=(12, 8))
sns.boxplot(x="상표", y="가격", hue="셀프여부", data=stations, palette="Set1")
plt.grid(True)
plt.show()

#셀프가 싼 것을 확인할 수 있다.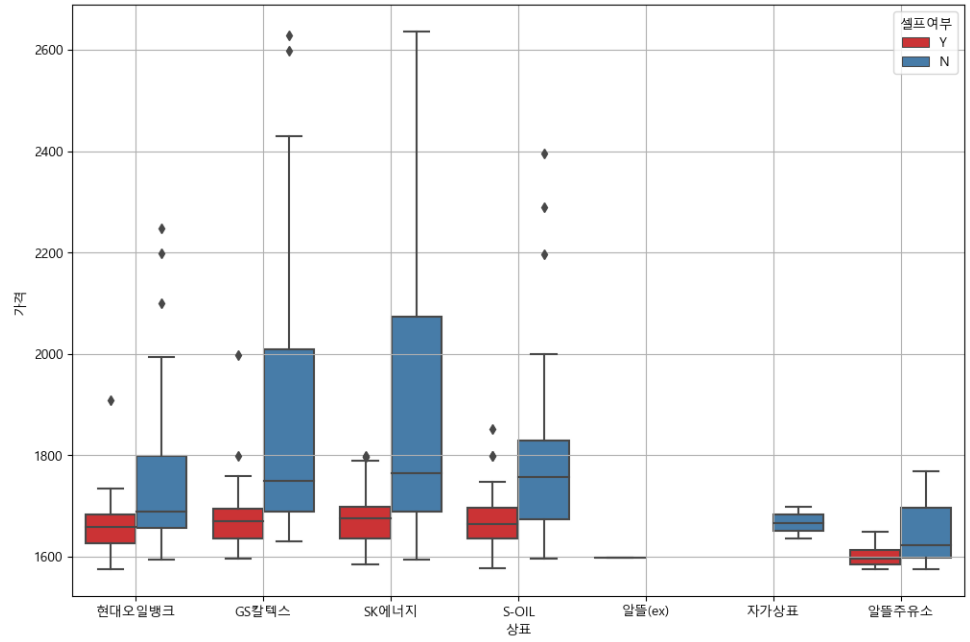
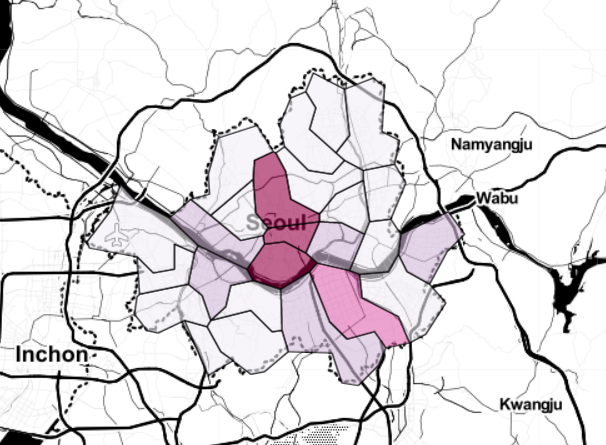
5. 주유 가격 정보 지도 시각화
import json
import folium
import warnings
warnings.simplefilter(action="ignore", category=FutureWarning)  #경고 문구 방지

# 가장 비싼 주유소 10개
stations.sort_values(by="가격", ascending=False).head(10)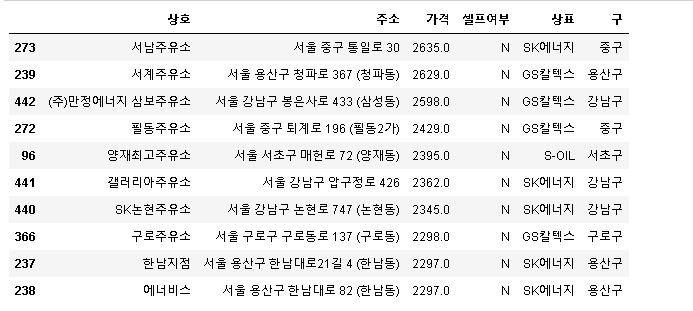
# 가장 싼 주유소 10개
stations.sort_values(by="가격", ascending=True).head(10)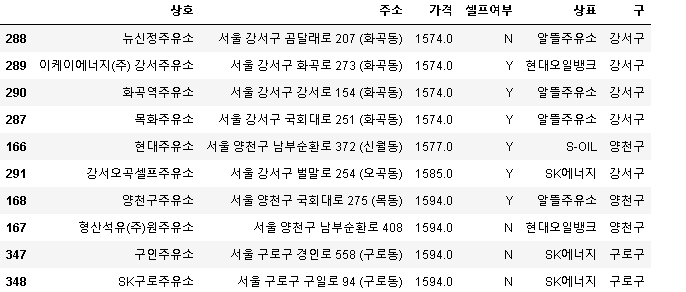
import numpy as np

gu_data = pd.pivot_table(data=stations, index="구", values="가격", aggfunc=np.mean)
gu_data.head()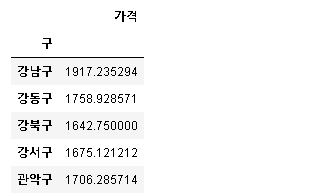
geo_path = "../data/02. skorea_municipalities_geo_simple.json"
geo_str = json.load(open(geo_path, encoding="utf-8"))

my_map = folium.Map(location=[37.5502, 126.982], zoom_start=11, tiles="Stamen Toner")
my_map.choropleth(
    geo_data=geo_str,
    data=gu_data,
    columns=[gu_data.index, "가격"],
    key_on="feature.id",
    fill_color="PuRd"
)
my_map