
1. Prometheus와 Grafana란?
✅ Prometheus
Prometheus는 시계열(Time-series) 데이터를 수집하고 저장하는 오픈소스 모니터링 시스템이다.
주기적으로 대상 애플리케이션의 메트릭을 pull 방식으로 수집하며, 기본적인 Alert Rule도 제공한다.
✅ Grafana
Grafana는 Prometheus 등 다양한 데이터 소스에서 데이터를 가져와 시각화하는 대시보드 툴이다.
데이터를 차트, 테이블, 게이지 등 다양한 형태로 표현할 수 있어 운영 상태를 직관적으로 파악할 수 있다.
2. 설치 및 실행
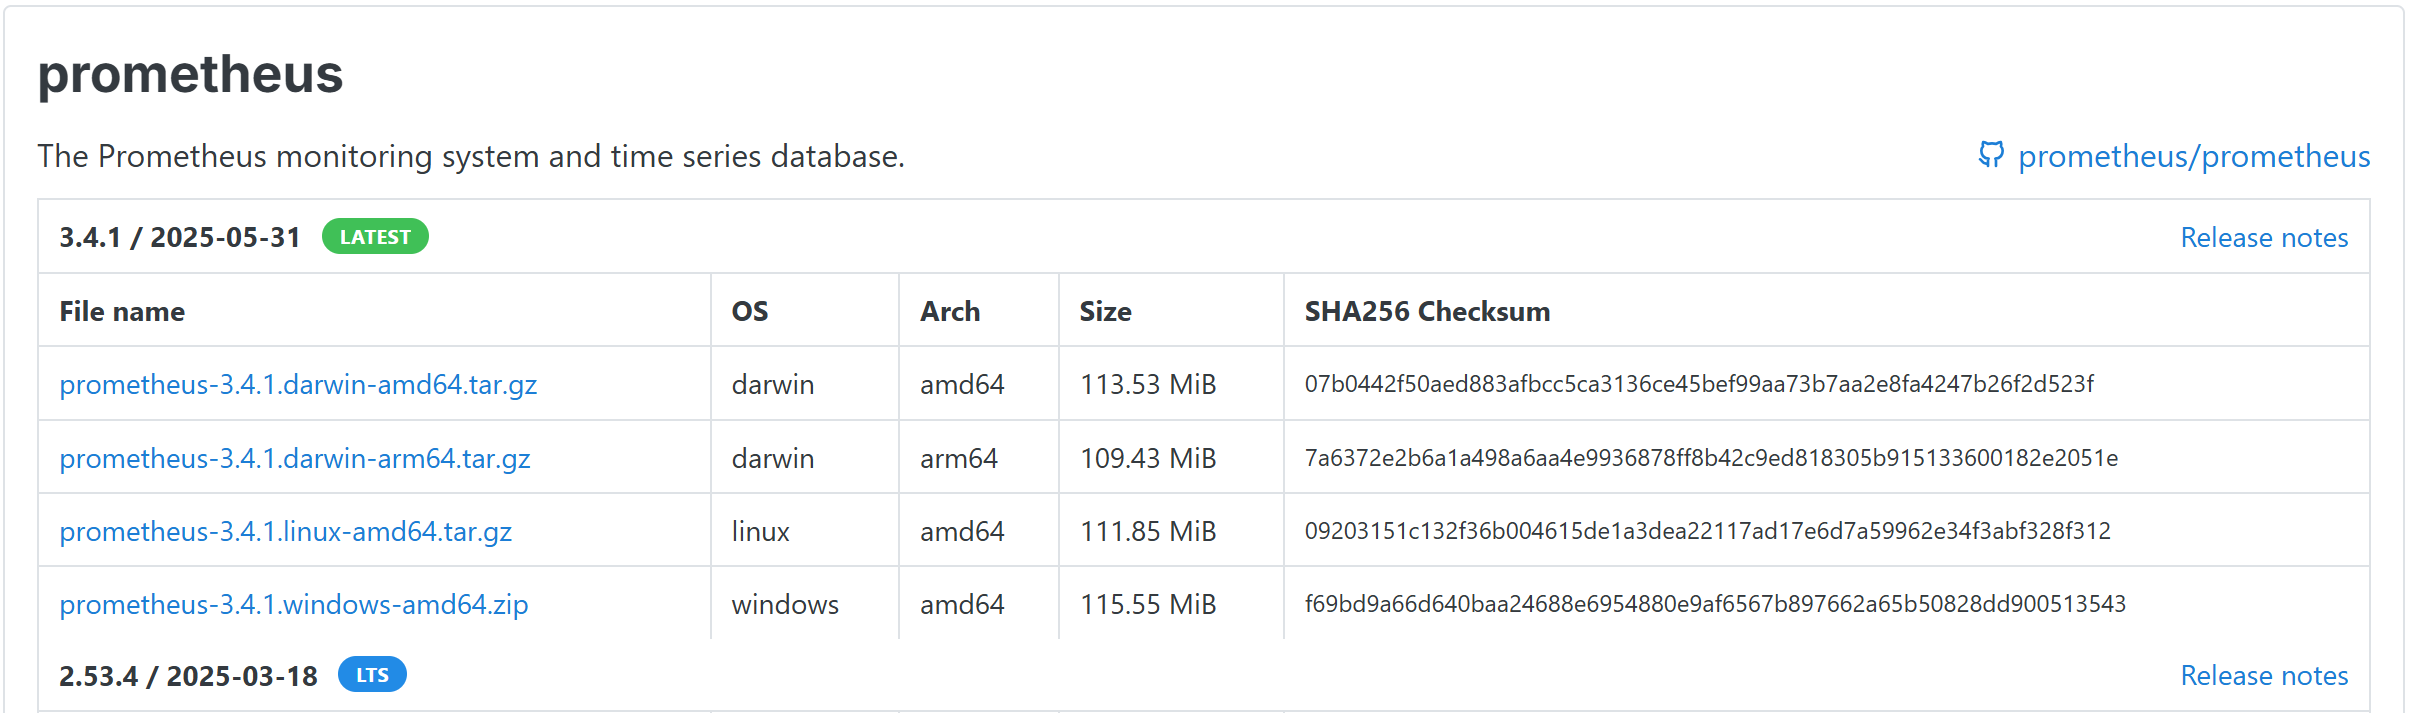
프로메테우스 설치: https://prometheus.io/download/
그라파나 설치: https://grafana.com/grafana/download
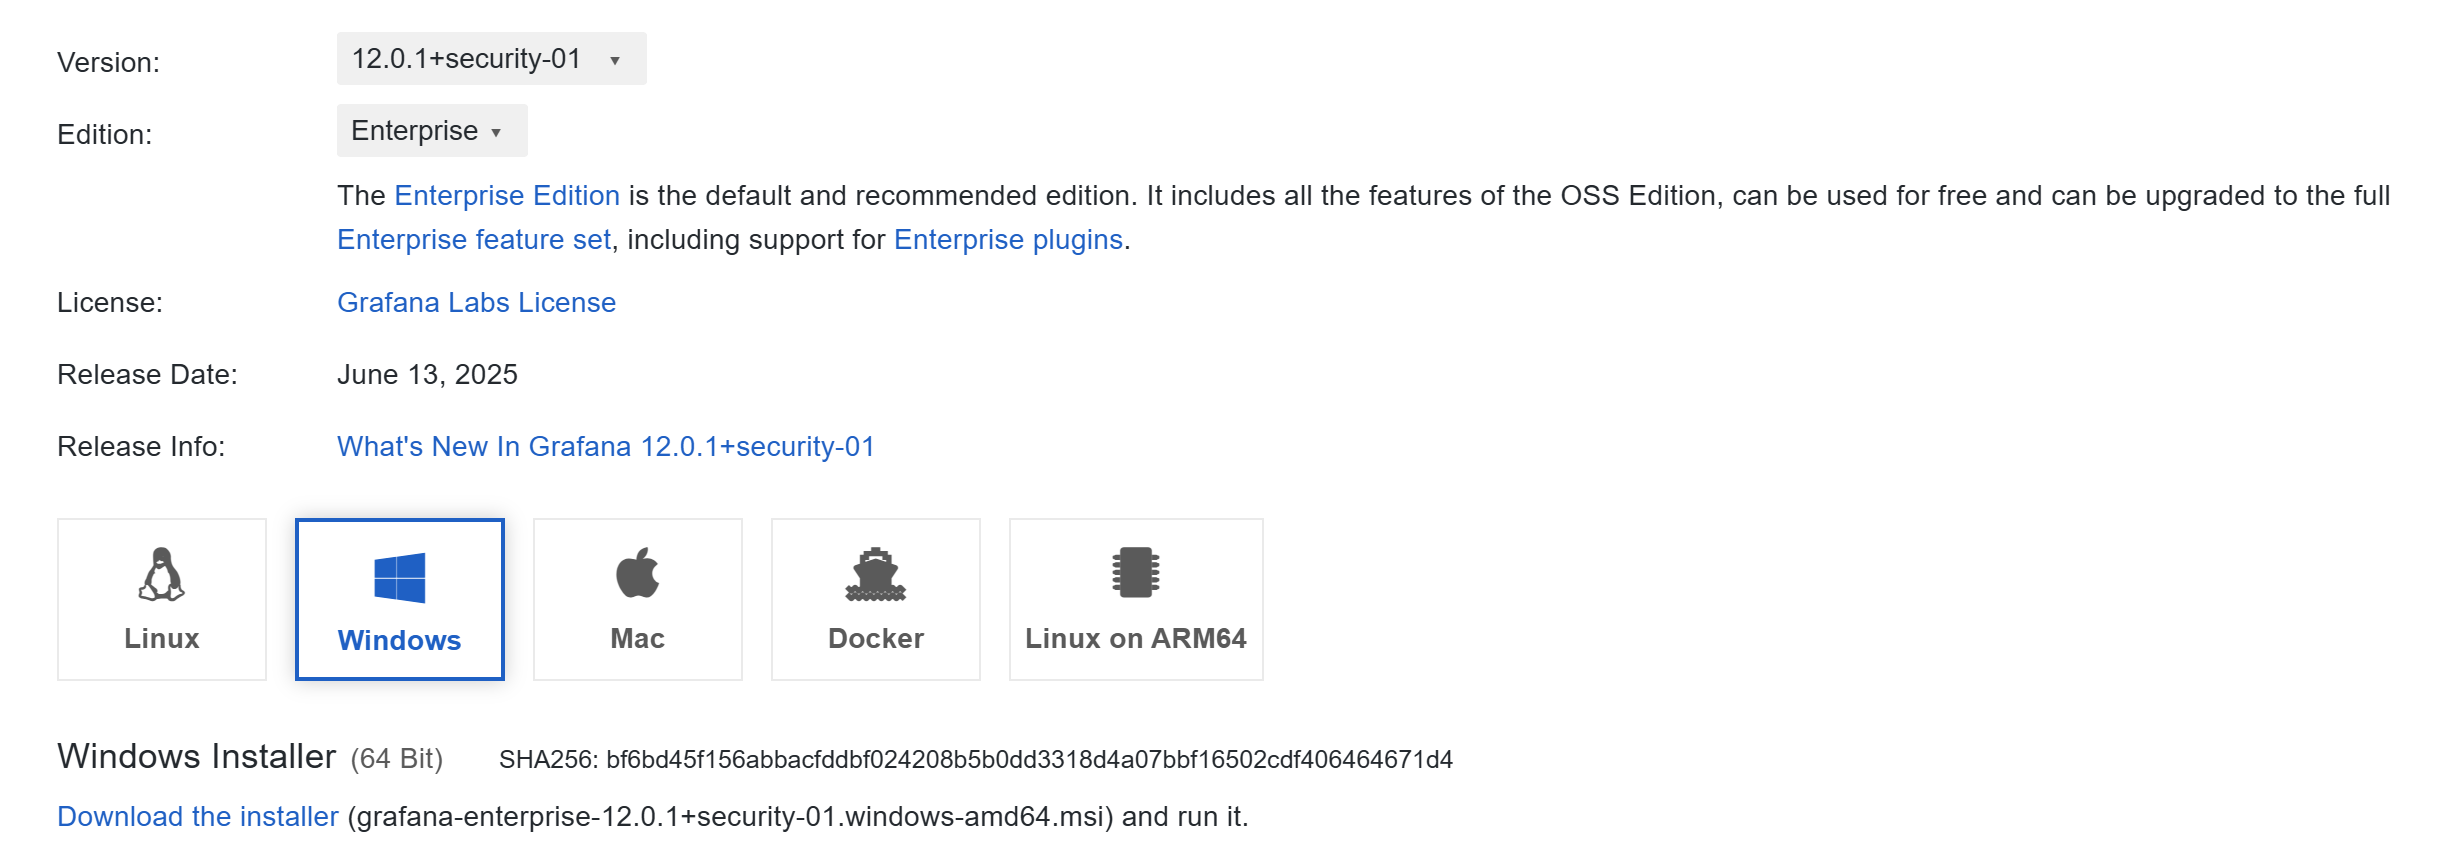
다운로드 받은 후:
-
Prometheus는 압축 해제
-
Grafana는 .msi 설치 진행
3. Spring Boot 설정
3.1 build.gradle 설정
dependencies {
    implementation 'org.springframework.boot:spring-boot-starter-actuator'
    implementation 'io.micrometer:micrometer-registry-prometheus'
}
3.2 application.yaml 설정
management:
  endpoints:
    web:
      exposure:
        include: prometheus
      base-path: /actuator
  metrics:
    export:
      prometheus:
        enabled: true
3.3 엔드 포인트 확인
Spring Boot 애플리케이션을 실행하고 브라우저에서 확인
http://localhost:8080/actuator/prometheus위 주소가 Prometheus가 데이터를 수집할 대상
4. Prometheus 설정
4.1 prometheus.yml 설정
프로메테우스를 압축 해제한 폴더에 있는 prometheus.yml을 아래와 같이 수정
global:
  scrape_interval: 15s
  evaluation_interval: 15s
alerting:
  alertmanagers:
    - static_configs:
        - targets:

rule_files:

scrape_configs:
  - job_name: 'spring-actuator'
    metrics_path: '/actuator/prometheus'
    static_configs:
      - targets: ['localhost:8080']
        labels:
          app: "prometheus"
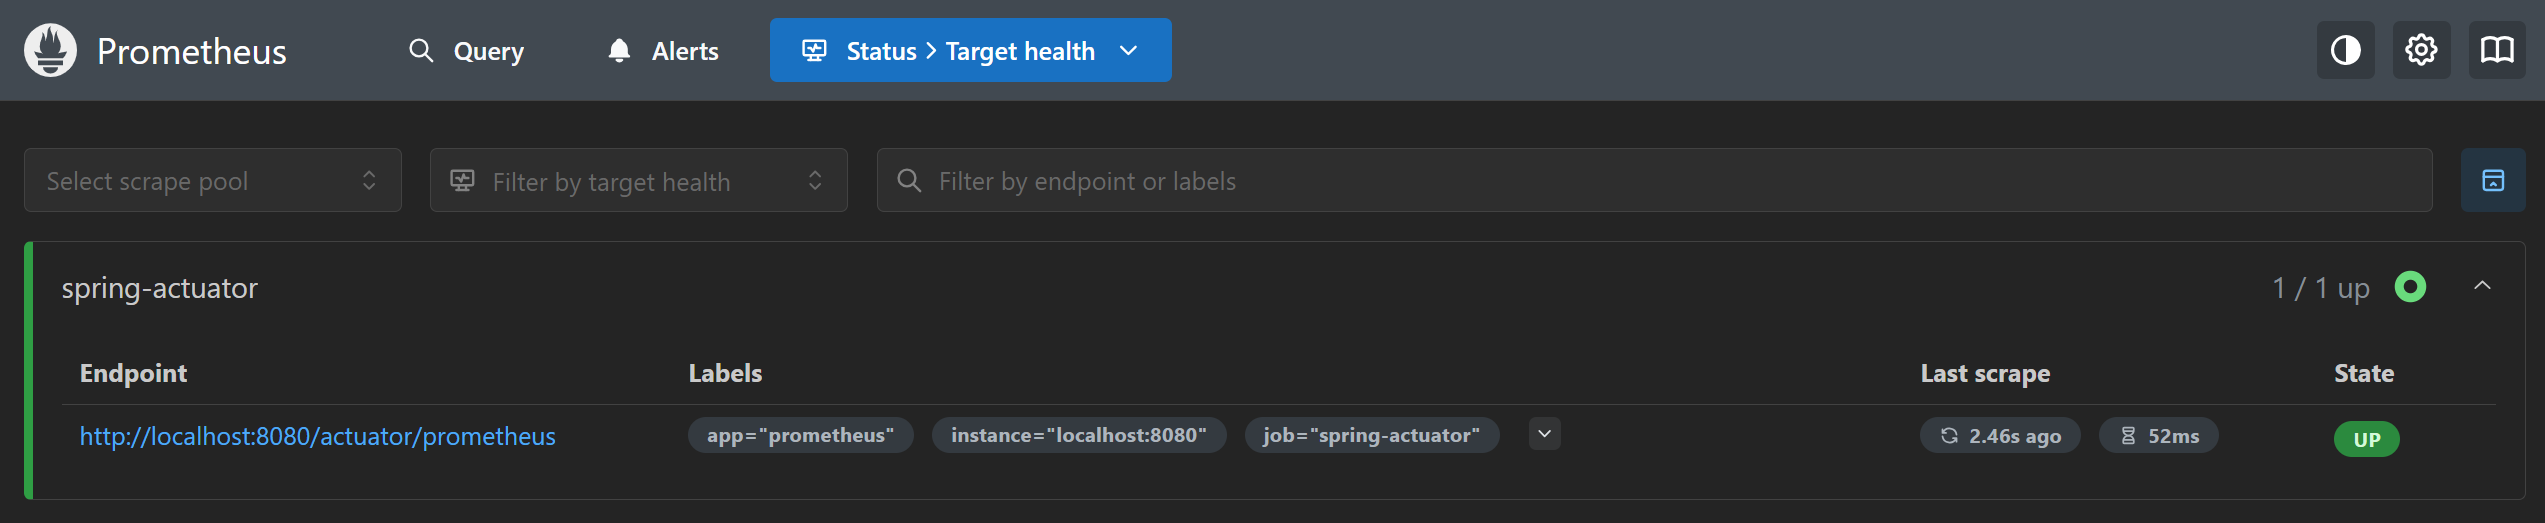
4.2 Prometheus 실행 및 확인
압축 해제한 폴더 안의prometheus.exe를 실행한 상태로 http://localhost:9090에 접속한 뒤,
메뉴 상단의 Status를 클릭하고 Target health를 선택하면 아래와 같은 화면을 볼 수 있다.
5. Grafana 설정 및 대시보드 구성
5.1 Grafana 접속
http://localhost:3000으로 접속을 한 뒤,
- ID: admin
- PW: admin → 로그인 후 새 비밀번호 설정
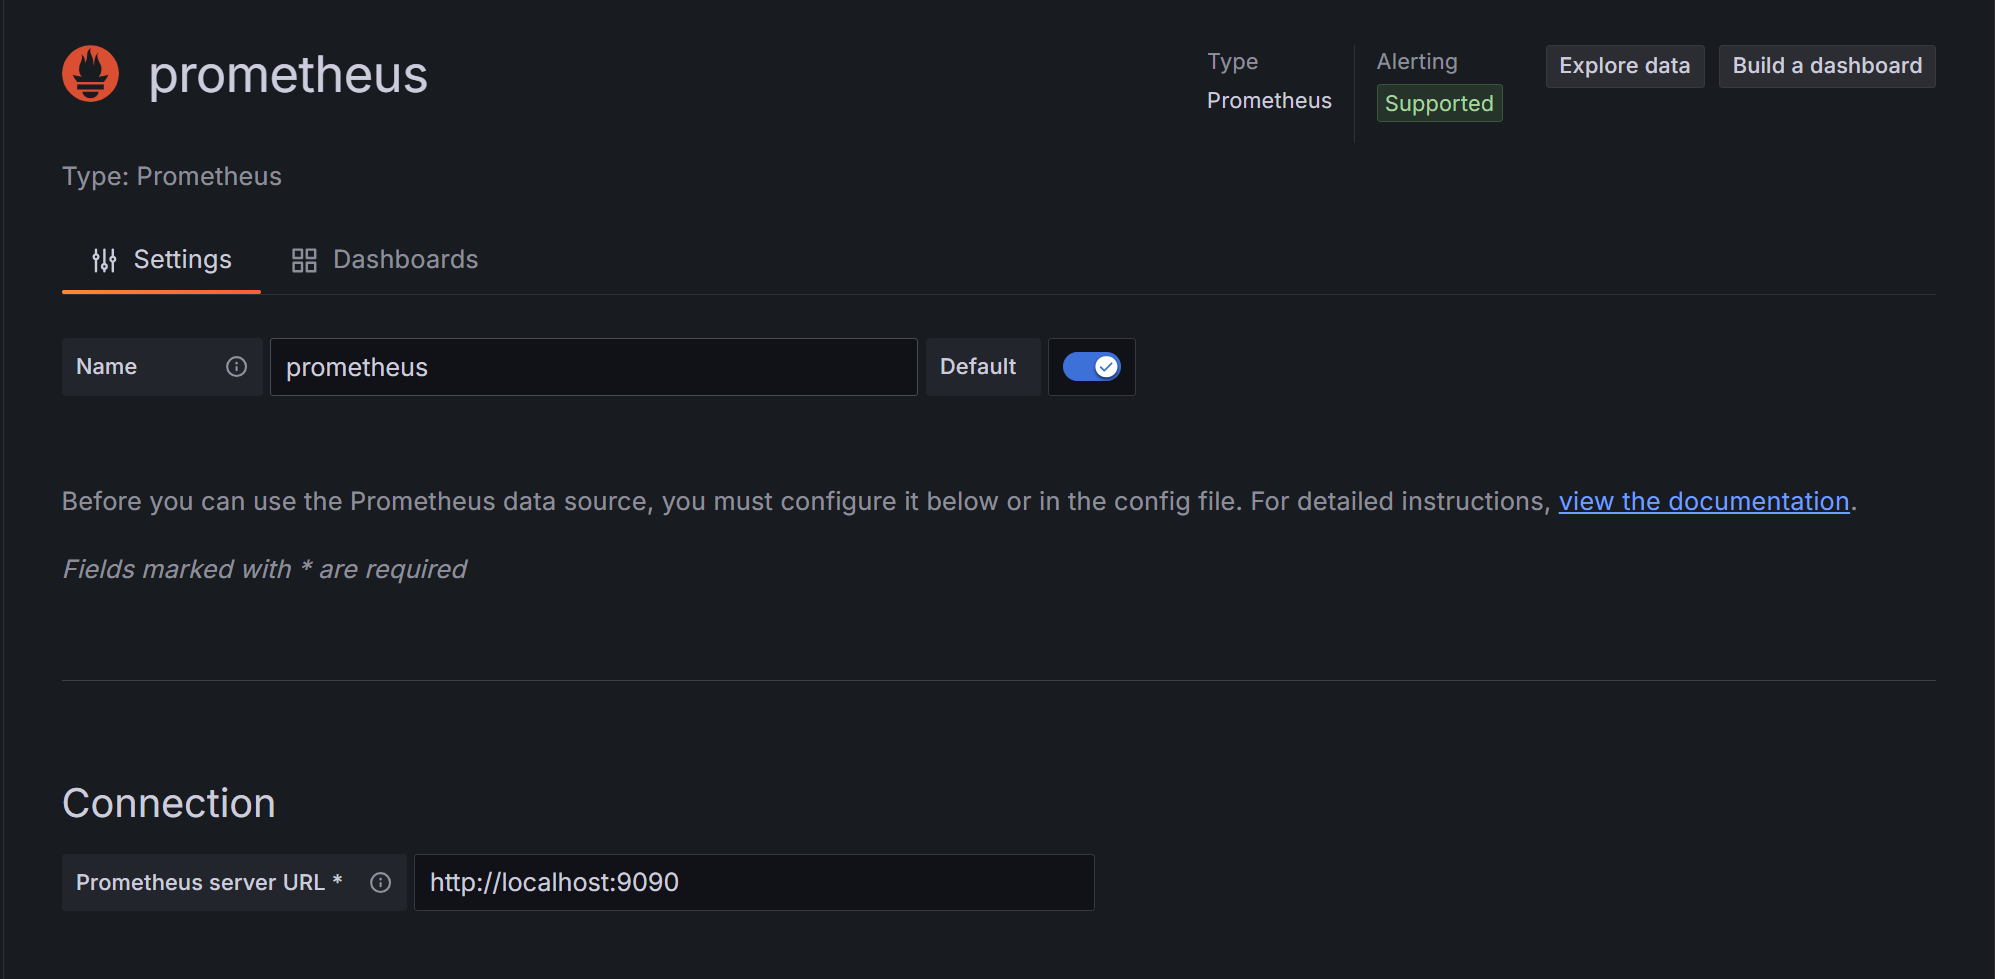
5.2 Prometheus 연결
-
왼쪽 사이드바 → Connections → Data Sources
-
Add data source → Prometheus 선택
-
Connection에
http://localhost:9090입력 후 Save & test 클릭
5.3 대시보드 구성
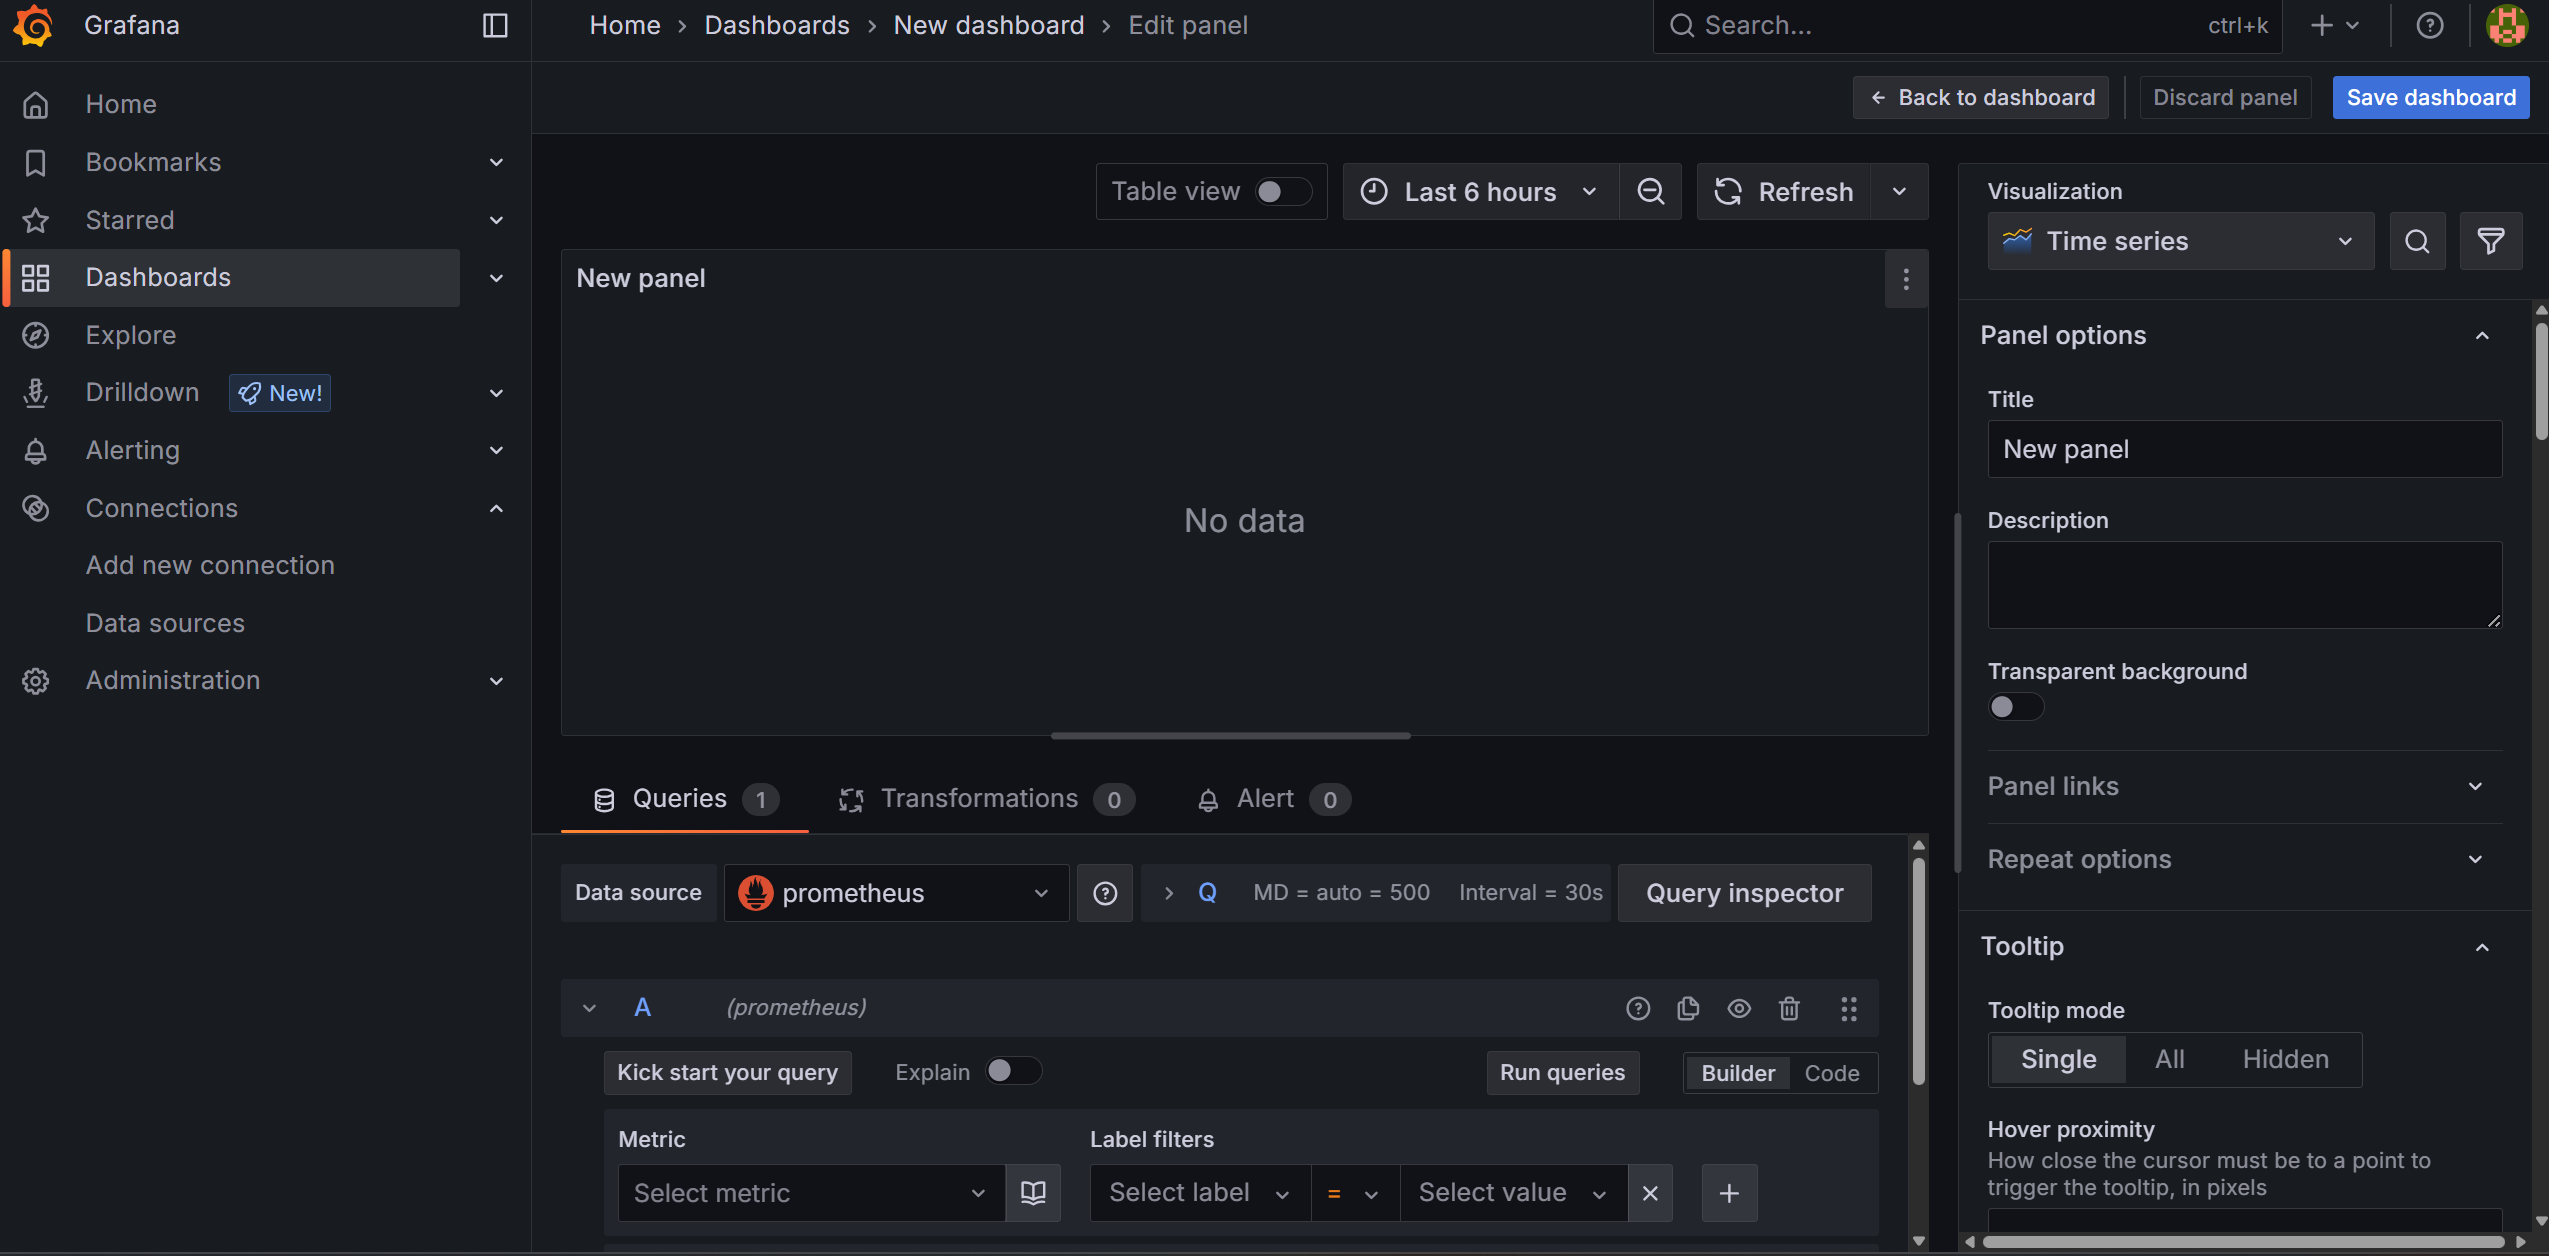
Dashboards -> Create dashboard -> Add visualization 을 한 뒤, 프로메테우스를 선택 하면 아래와 같은 화면을 볼 수 있다.
해당 화면에서 하단의 Metric를 선택 후, (옵션) 원하는 Label filiters를 선택한 뒤 Run queries를 클릭 하면 다음의 결과를 얻을 수 있다.
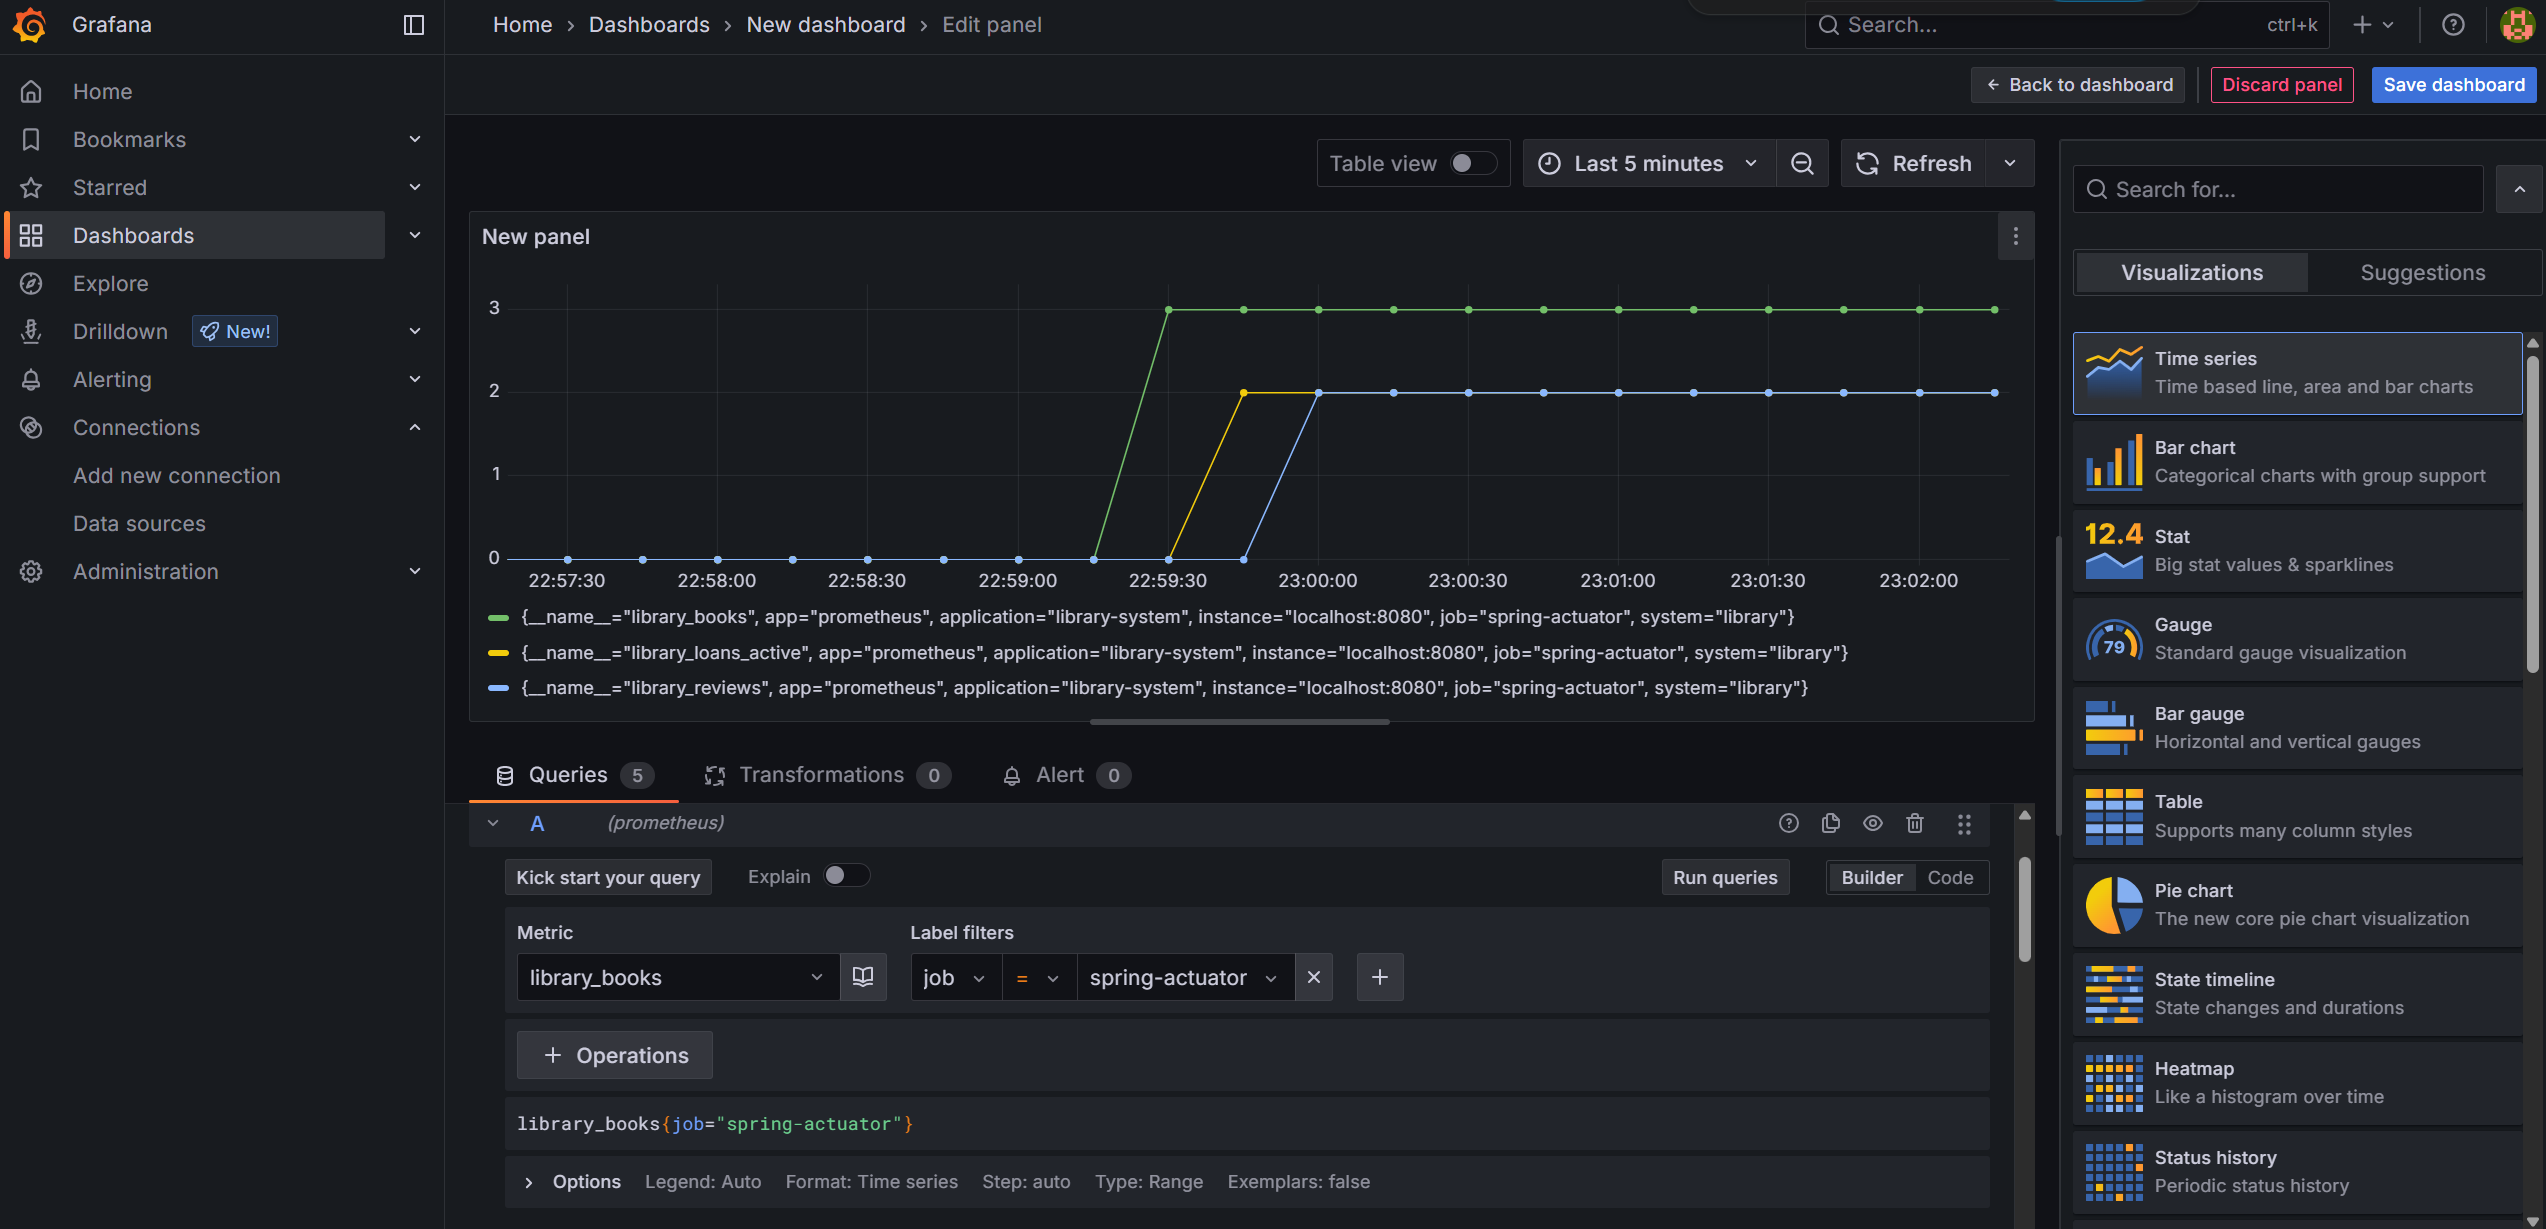
좀 더 다양한 시각화 모형을 보고 싶다면, 오른쪽의 패널의 Visualization 중 원하는 모형을 선택하면 된다 (아래의 사진은 Gauge를 선택한 모습이다.)

추가 팁
여러 패널 대신 하나의 패널에서 여러 메트릭을 표현할 수 있으며,
Legend alias에 {{__field.name}}, {{job}}, {{app}} 등 템플릿 사용 가능


자세한 설명 좋네요~