히스토그램이란, 이미지에서 픽셀 별 색상 값의 분포
import numpy as np
import cv2 as cv
from matplotlib import pyplot as plt
img = cv.imread('home.jpg')
color = ('b','g','r')
for i,col in enumerate(color):
    histr = cv.calcHist([img],[i],None,[256],[0,256])
    plt.plot(histr,color = col)
    plt.xlim([0,256])
plt.show()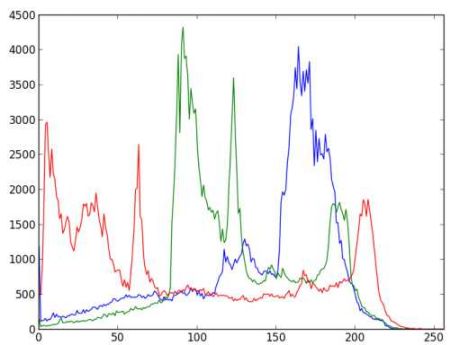
https://docs.opencv.org/master/d1/db7/tutorial_py_histogram_begins.html

안녕하세요~