◾시계열 데이터
시계열 데이터: 시간의 흐름에 대해 특정 패턴과 같은 정보를 가지고 있는 데이터- 기초 시계열은 대부분 Forecast
Seasonal Time Series: 시계열 데이터에서 주기성을 가지고 있는 데이터- 예 : 주식 등
- 트렌드를 찾고 트렌드를 뺀 주기적 특성
◾import
# import
import pandas as pd
import pandas_datareader.data as web
import numpy as np
import matplotlib.pyplot as plt
import yfinance as yf
import time

from bs4 import BeautifulSoup
from fbprophet import Prophet
from datetime import datetime
from pandas_datareader import data
from urllib.request import Request, urlopen
from selenium import webdriver
from selenium.webdriver.common.action_chains import ActionChains

%matplotlib inline
◾Fbprohet
1. fbprophet 설치
- 설치
- Visual C++ Build Tool 설치 : 링크
- pip install pandas-datareader | conda install pandas-datareader
- pip install fbprophet | conda install -c conda-forge fbprophet
- 안된다면 colab 사용
2. fbprophet 기초
- 간단한 테스트
# 데이터 준비
time = np.linspace(0, 1, 365*2)
result = np.sin(2*np.pi*12*time)
ds = pd.date_range('2017-01-01', periods=365*2, freq='D')
df = pd.DataFrame({'ds' : ds, 'y' : result})
df.head()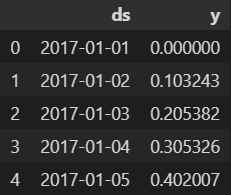
- 그래프
# 데이터 확인
df['y'].plot(figsize=(10,6));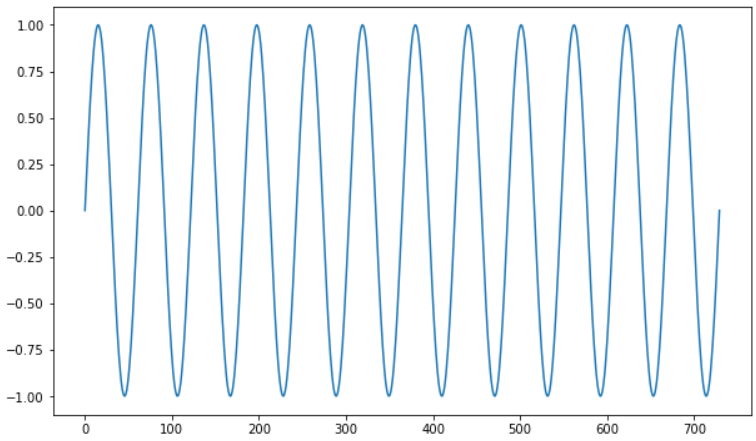
- 데이터 예측 및 그래프
# 예측 시도
m = Prophet(yearly_seasonality=True, daily_seasonality=True)
m.fit(df)
future = m.make_future_dataframe(periods=30)
forecast = m.predict(future)
m.plot(forecast);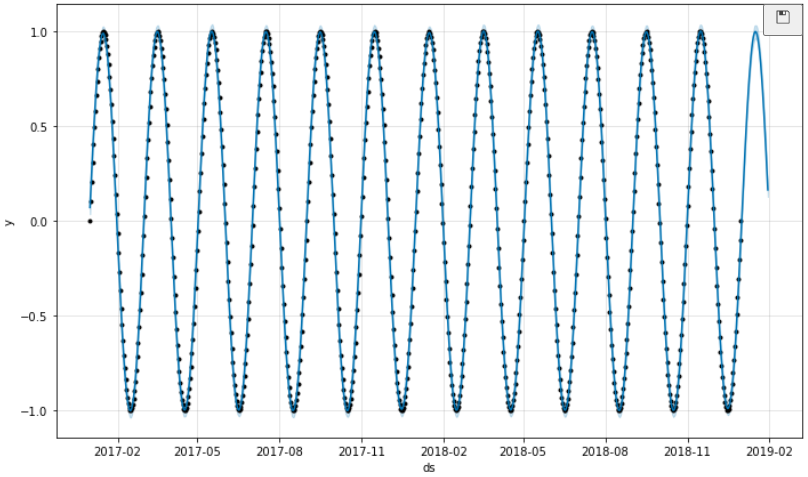
# 난이도 높은 데이터 준비
time = np.linspace(0, 1, 365*2)
result = np.sin(2*np.pi*12*time) + time

ds = pd.date_range('2017-01-01', periods=365*2, freq='D')
df = pd.DataFrame({'ds' : ds, 'y' : result})

df['y'].plot(figsize=(10,6));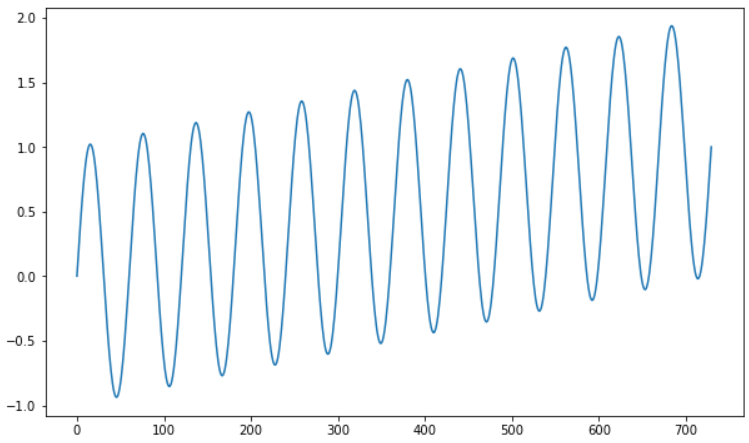
# 예측
m = Prophet(yearly_seasonality=True, daily_seasonality=True)
m.fit(df)
future = m.make_future_dataframe(periods=30)
forecast = m.predict(future)
m.plot(forecast);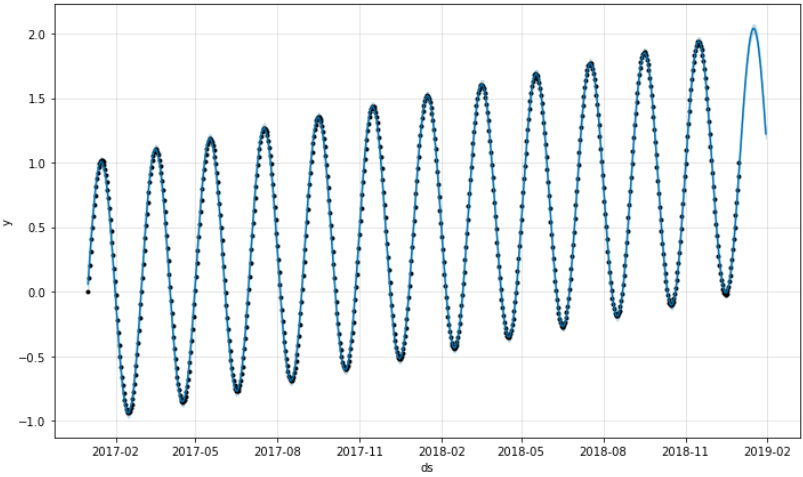
- 노이즈 데이터로 테스트
# 노이즈 데이터
time = np.linspace(0, 1, 365*2)
result = np.sin(2*np.pi*12*time) + time + np.random.randn(365*2)/4

ds = pd.date_range('2017-01-01', periods=365*2, freq='D')
df = pd.DataFrame({'ds' : ds, 'y' : result})

df['y'].plot(figsize=(10,6));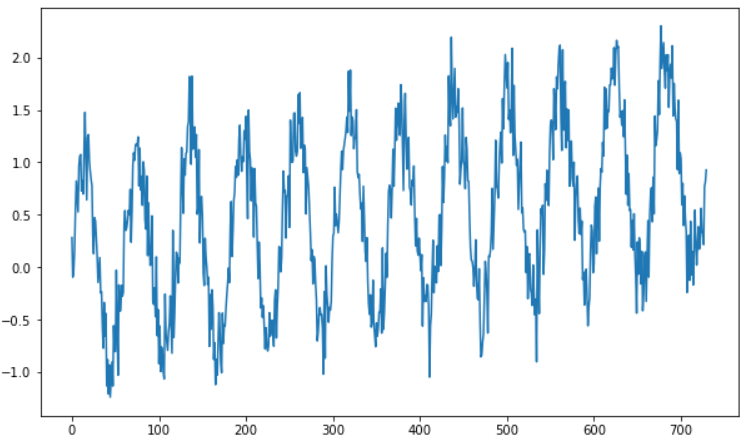
# 예측
m = Prophet(yearly_seasonality=True, daily_seasonality=True)
m.fit(df)
future = m.make_future_dataframe(periods=30)
forecast = m.predict(future)
m.plot(forecast);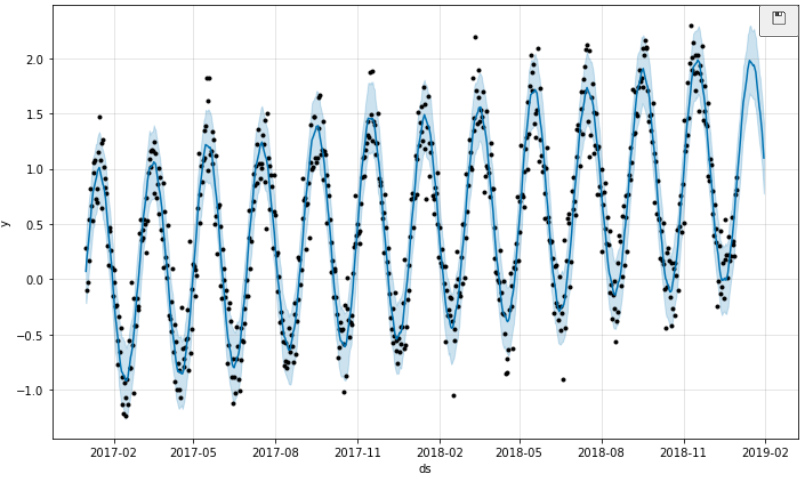
◾주식 데이터 분석
- 야후 주식의 데이터 사용 : 네이버 주가
# 데이터 추출 : 네이버
req = Request(
    "https://finance.yahoo.com/quote/035420.KS/history?p=035420.KS&guccounter=1",
    headers={"User-Agent" : "Chrome"},
)
page = urlopen(req).read()

soup = BeautifulSoup(page, 'html.parser')
table = soup.find("table")
df_raw = pd.read_html(str(table))[0]
df_raw.head(3)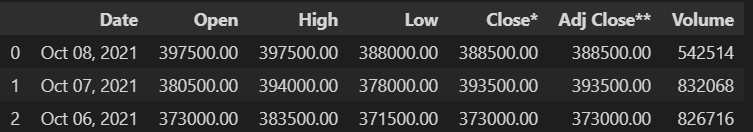
# fbprophet 형식에 맞추고 nan 제외
# 종가(Close*) 사용
df_tmp = pd.DataFrame({'ds' : df_raw['Date'], 'y' : df_raw["Close*"]})
df_target = df_tmp[:-1]
df_target.head()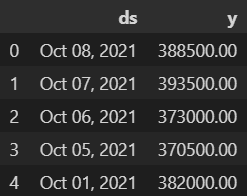
# 날짜 형식 변경
df = df_target.copy()
df['ds'] = pd.to_datetime(df_target['ds'], format="%b %d, %Y")
df.head()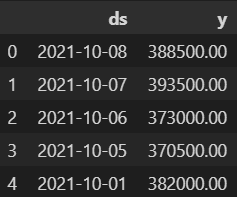
# 정보 확인
df.info()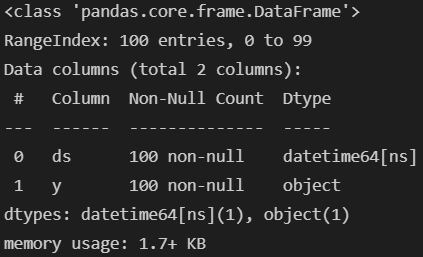
# y컬럼 데이터 타입 변경
df["y"] = df['y'].astype("float")

# 예측
m = Prophet(yearly_seasonality=True, daily_seasonality=True)
m.fit(df);
future = m.make_future_dataframe(periods=30)
forecast = m.predict(future)
forecast[['ds', 'yhat', 'yhat_lower', 'yhat_upper']].tail()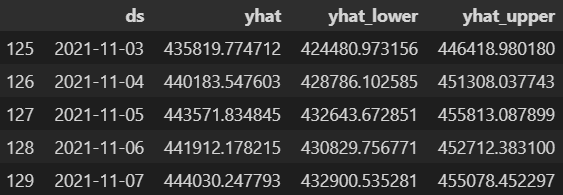
# 실제 데이터와 예측 데이터 비교
plt.figure(figsize=(12, 6))
plt.plot()
plt.plot(df['ds'], df['y'], label = 'real')
plt.plot(forecast['ds'], forecast['yhat'], label = 'forecast')
plt.grid(True)
plt.show();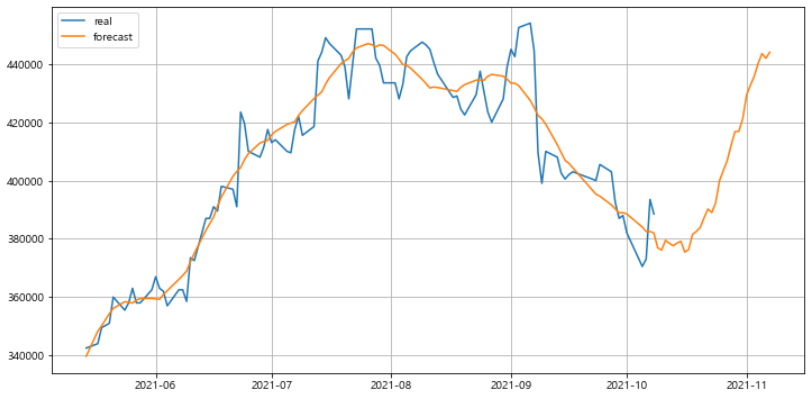
# 예측 그래프
m.plot(forecast);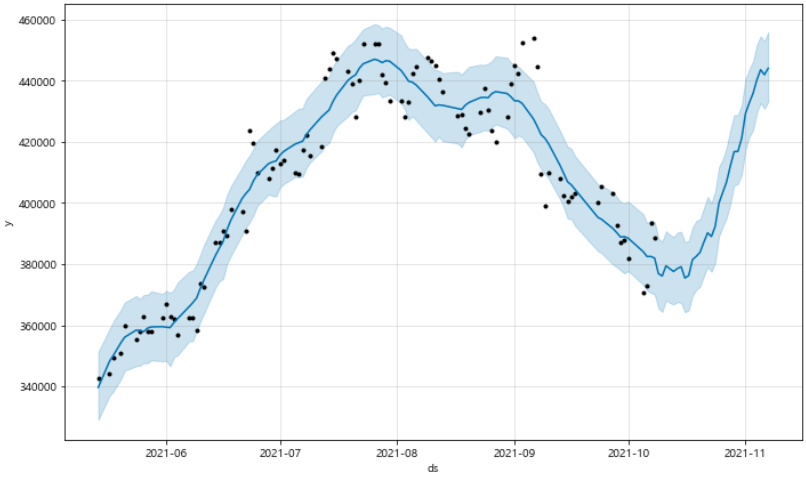
# 트렌드 분석
m.plot_components(forecast);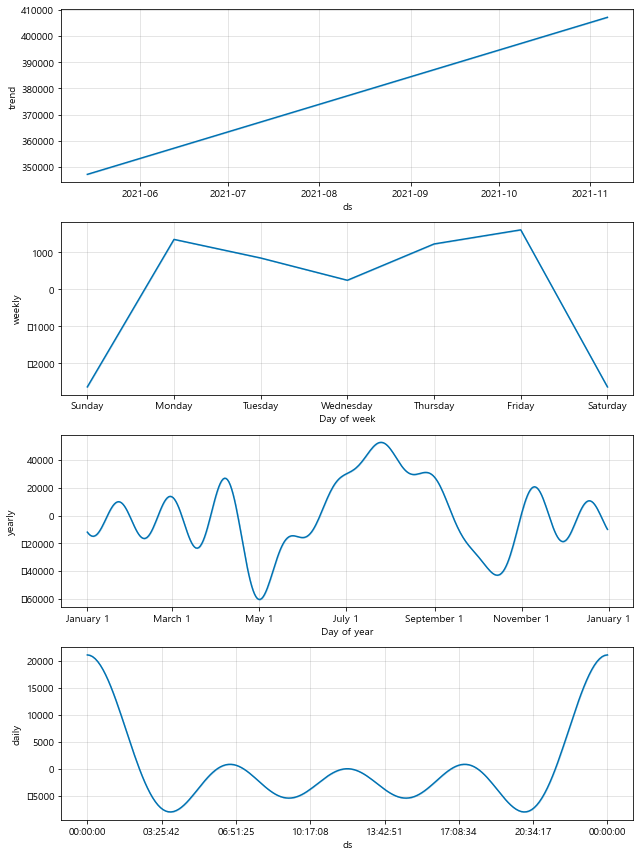
- yfinance 모듈
- data_reader를 통해 주가 정보를 얻는 기능이 있었지만 안정성 문제로 동작하지 않는다.
- 우회적으로 야후의 기능을 복구시켜주는 모듈
- pip install yfinance
# 테스트 : 대한항공(003490)
start_date = "2010-03-01"
end_date = "2018-02-28"
KoreaAir = data.get_data_yahoo("003490.KS", start_date, end_date)
KoreaAir.head()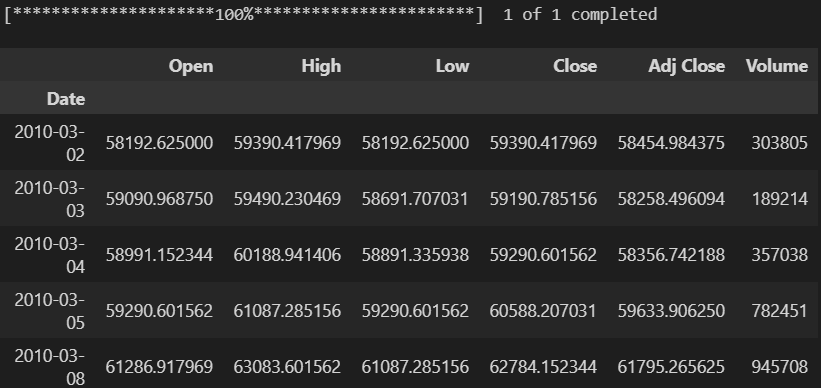
# 종가 그래프
KoreaAir["Close"].plot(figsize=(12, 6), grid=True);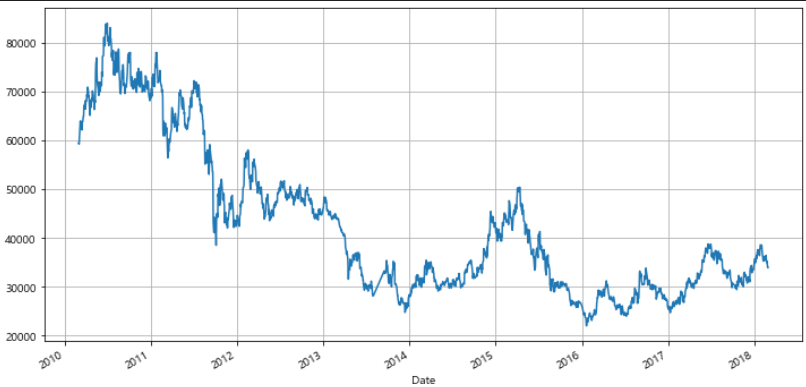
# 2017-11-30 잘라내기 : 예측값과 비교해보기 위해
KoreaAir_trunc = KoreaAir[:"2017-11-30"]
KoreaAir_trunc.head()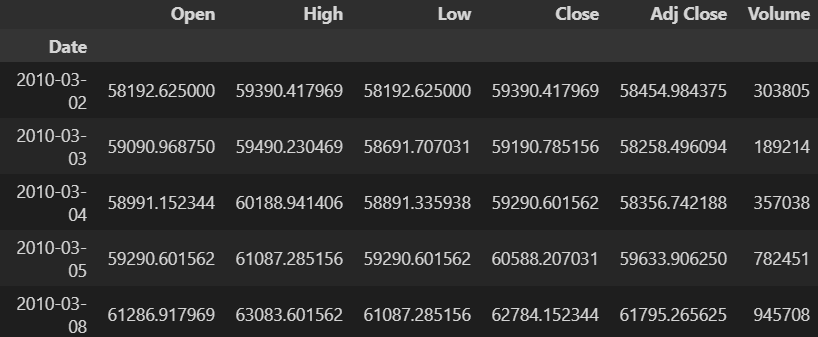
# 데이터 정리
df = pd.DataFrame({'ds' : KoreaAir_trunc.index, 'y':KoreaAir_trunc["Close"]})
df.reset_index(inplace=True)
del df["Date"]
df.head()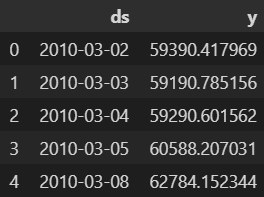
# 예측
m = Prophet(yearly_seasonality=True, daily_seasonality=True)
m.fit(df)
future = m.make_future_dataframe(periods=90)
forecast = m.predict(future)
forecast[['ds', 'yhat', 'yhat_lower', 'yhat_upper']].tail()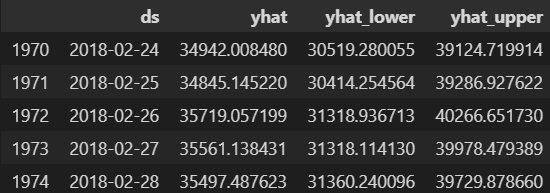
# 실제와 예측값 비교 그래프
plt.figure(figsize=(12, 6))
plt.plot(KoreaAir.index, KoreaAir["Close"], label="real")
plt.plot(forecast["ds"], forecast["yhat"], label="forecast")
plt.grid(True)
plt.legend()
plt.show();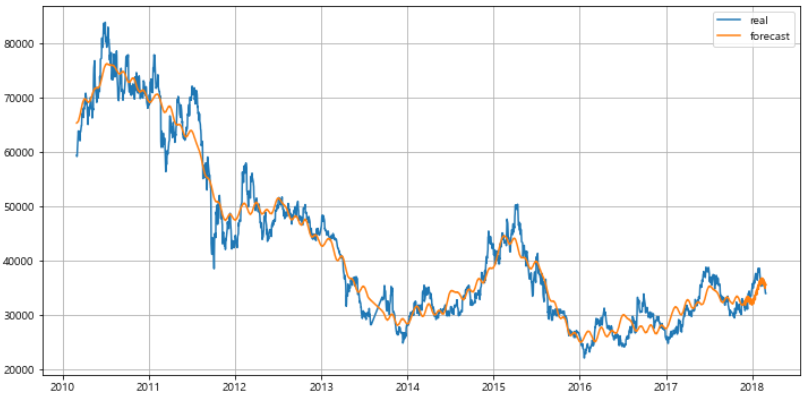
# 예측 그래프
m.plot(forecast);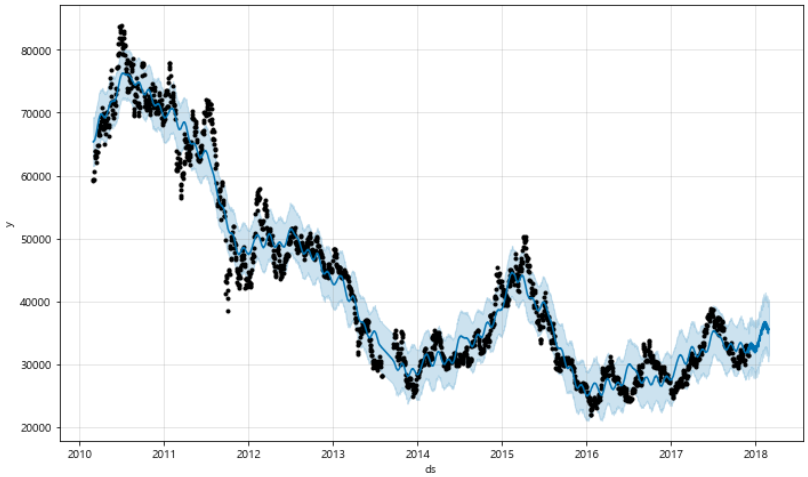
# 트렌드 분석
m.plot_components(forecast);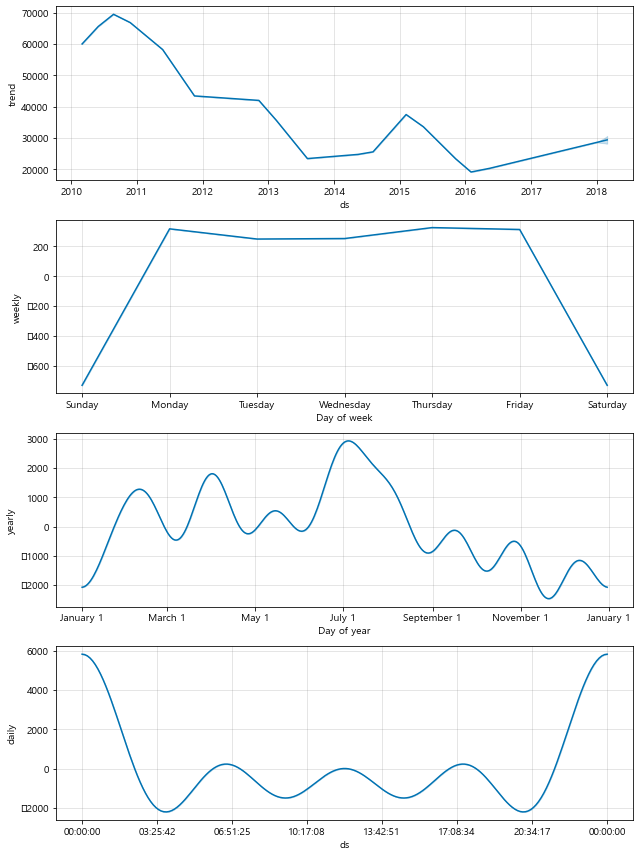
◾비트코인 데이터 분석
- 비트코인 데이터 : https://bitcoincharts.com/charts/bitstampUSD#rg60ztgSzm1g10zm2g25zv
- symbol, time period에 따라 주소값이 변경된다.
- time에 따라 rg일수로 변경됨을 확인(2달 rg60, 2년 rg730)
# 웹 페이지 접근
# 2년 URL 주소
driver = webdriver.Chrome('../driver/chromedriver.exe')
driver.get("https://bitcoincharts.com/charts/bitstampUSD#rg730ztgSzm1g10zm2g25zv")

# raw_data 메뉴가 가려지기 때문에 스크롤 조정
xpath = '''//*[@id="content_chart"]/div/div[2]/a'''
variable = driver.find_element_by_xpath(xpath)
driver.execute_script('return arguments[0].scrollIntoView();', variable)
variable.click()

# 데이터 추출
html = driver.page_source

soup = BeautifulSoup(html, 'html.parser')
table = soup.find("table", id='chart_table')
table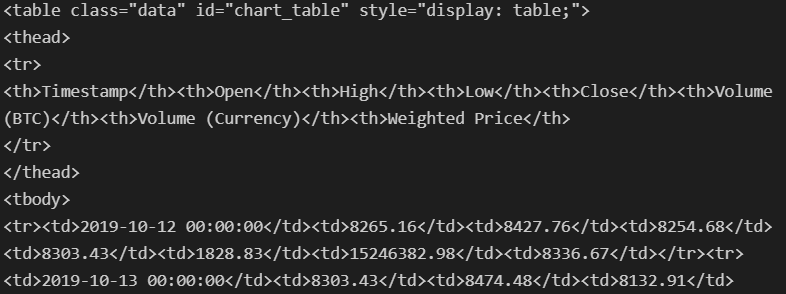
- 데이터프레임 생성 :
read_html
# read_html로 데이터프레임 생성
df = pd.read_html(str(table))
bitcoin = df[0]
bitcoin.head()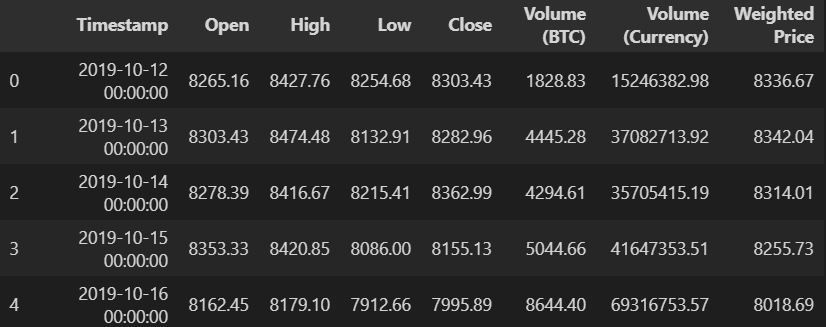
# 셀레니움 종료
driver.close()

# 종가 그래프
bitcoin["Close"].plot(figsize=(12, 6), grid=True);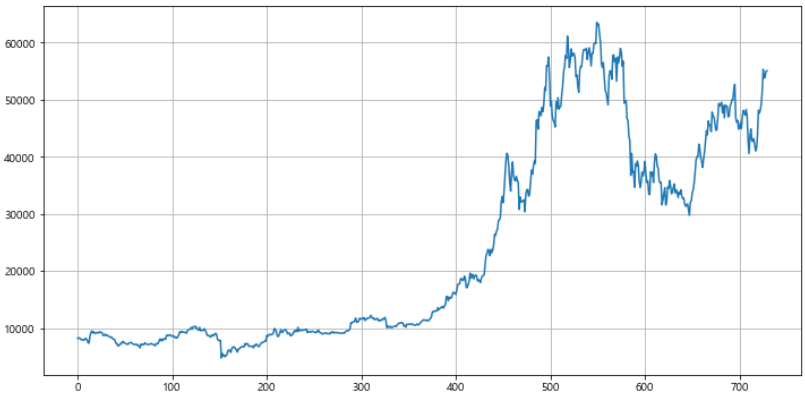
# 종가로 Prophet 적용
df = pd.DataFrame({'ds' : bitcoin["Timestamp"], 'y' : bitcoin["Close"]})

# 예측
m = Prophet(yearly_seasonality=True, daily_seasonality=True)
m.fit(df);
future = m.make_future_dataframe(periods=30)
forecast = m.predict(future)
forecast[['ds', 'yhat', 'yhat_lower', 'yhat_upper']].tail()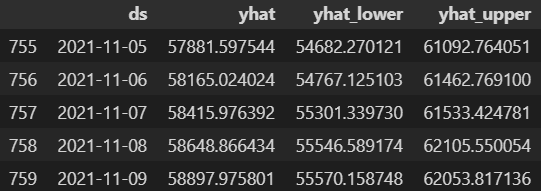
# 실제, 예측 비교 그래프
plt.figure(figsize=(12, 6))
plt.plot(df['ds'], df['y'], label='real')
plt.plot(forecast['ds'], forecast['yhat'], label='forecast')
plt.grid(True)
plt.legend(loc=2)
plt.show();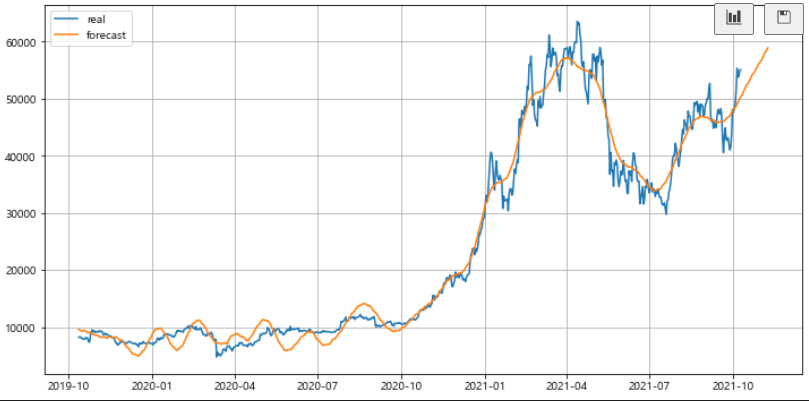
# 예측 그래프
m.plot(forecast);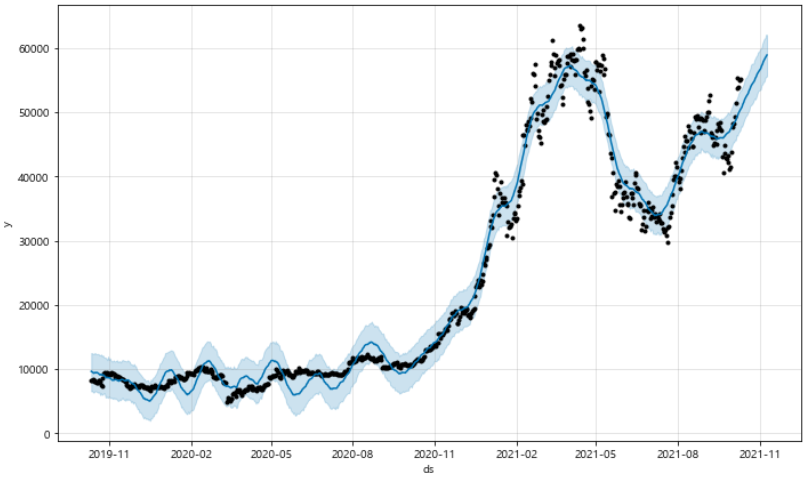
# 트렌드 분석
m.plot_components(forecast);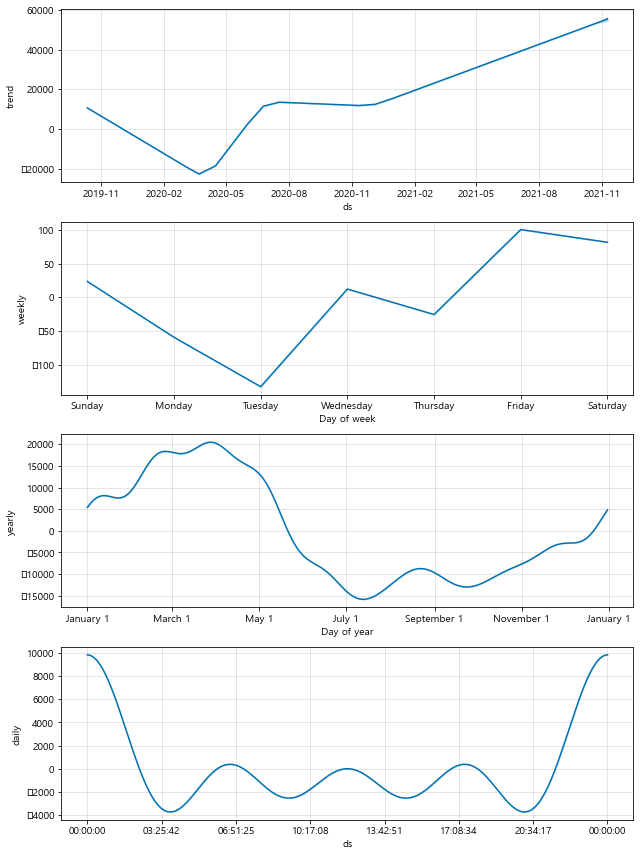

후라이드 치킨