◾Pipeline
- 지금까지 jupyter notebook 상황에서 데이터의 전처리와 여러 알고리즘을 반복 실행했다.
- 하이퍼파라미터의 튜닝 과정을 번갈아 하게되면 실행 순서에 혼돈이 있을 수 있다.
- 클래스로 진행할수도 있지만
sklearn의Pipeline기능을 사용할 수 있다. Pipeline: 데이터 사전 처리 및 분류의 모든 단계를 포함하는 단일 개체를 만들 수 있다.- train과 test 데이터 손실을 회피
- 교차 검증 및 기타 모델 선택 유형 쉽게 생성
- 재현성 증가
# 와인 데이터 활용
import pandas as pd

red_wine = pd.read_csv('../data/01/winequality-red.csv', sep=';')
white_wine = pd.read_csv('../data/01/winequality-white.csv', sep=';')

red_wine['color'] = 1
white_wine['color'] = 0

wine = pd.concat([red_wine, white_wine])
wine.reset_index(drop = True, inplace = True)

X = wine.drop(['color'], axis=1)
y = wine['color']- 레드/화이트 와인 분류기의 동작 Process
- Scaler(
StandardScaler()) ->test_train_split()-> clf:classifier(DecisionTreeClassifier()) - test_train_split()은 Pipeline 내부가 아니여도 된다.
- Scaler(
# Pipeline을 통한 구현
from sklearn.pipeline import Pipeline
from sklearn.tree import DecisionTreeClassifier
from sklearn.preprocessing import StandardScaler

# 진행할 동작 입력
estimators = [
    ('scaler', StandardScaler()),
    ('clf', DecisionTreeClassifier())
]
# pipeline 입력
pipe = Pipeline(estimators)- pipe : Pipeline 객체
- steps : 진행할 동작(스텝)
- [index], [key] : 스텝별 실행
- set_params : 각 스텝별 속성 설정, (
스텝이름__속성=값)
pipe
pipe.steps, pipe.steps[0], pipe.steps[1]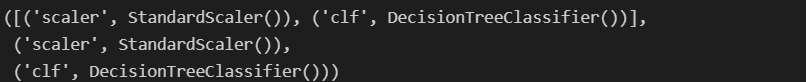
pipe[0], pipe['scaler']
pipe.set_params(clf__max_depth=2)
pipe.set_params(clf__random_state=13)
pipe[1], pipe['clf']
- Pipeline을 이용한 분류기 구성
# Pipeline 구성
from sklearn.model_selection import train_test_split

X_train, X_test, y_train, y_test = train_test_split(X, y, test_size=0.2, random_state=13, stratify=y)
pipe.fit(X_train, y_train)
# 성과 측정
from sklearn.metrics import accuracy_score

y_pred_tr = pipe.predict(X_train)
y_pred_test = pipe.predict(X_test)

print("Train Acc : {}".format(accuracy_score(y_train, y_pred_tr)))
print("Test Acc : {}".format(accuracy_score(y_test, y_pred_test)))
# 트리 확인
import matplotlib.pyplot as plt
from sklearn.tree import plot_tree

plt.figure(figsize=(12, 7))
plot_tree(pipe['clf'], feature_names = X_train.columns)
plt.show()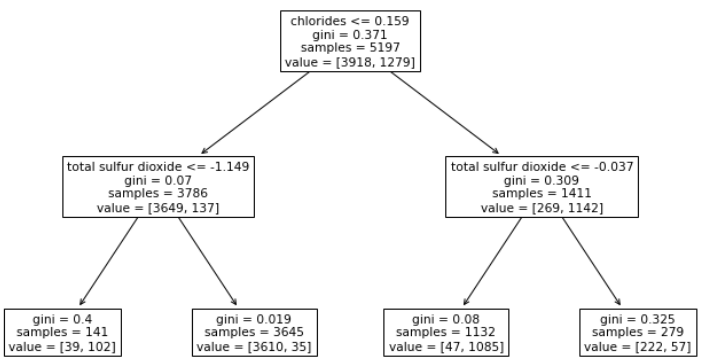

후라이드 치킨