◾개요
- opinet : 링크
- 대한민국 주유 가격
- 싼 주유소 찾기 - 지역별 : 링크
- 목표 데이터 : 브랜드, 가격, 셀프 주유 여부, 위치
- 데이터가 바뀌어도 주소가 변경되지 않아 BeautifulSoup로 접근하기 어렵다
◾import
import folium
import json
import matplotlib.pyplot as plt
import numpy as np
import pandas as pd
import seaborn as sns
import time
import warnings

from glob import glob
from selenium import webdriver
from tqdm import notebook

from matplotlib import rc
%matplotlib inline
# get_ipython().run_line_magic("matplotlib", "inline")
plt.rcParams["axes.unicode_minus"] = False
rc('font', family='Malgun Gothic')

warnings.simplefilter(action="ignore", category=FutureWarning)
◾주유소 가격 정보 획득
- 웹 주소 접근
- 해당 URL로 한 번에 접근이 안된다.
- 메인 페이지로 접속이 되고, 팝업창이 하나 나온다.
driver = webdriver.Chrome("../driver/chromedriver.exe")
driver.get("https://www.opinet.co.kr/searRgSelect.do")

# 팝업창 화면 전환 후 닫기
driver.switch_to_window(driver.window_handles[-1])
driver.close()
time.sleep(2)
driver.switch_to_window(driver.window_handles[-1])

driver.get("https://www.opinet.co.kr/searRgSelect.do")
1. 광역시도

- id 값을 사용하여 접근
# id로 접근
sido_list_raw = driver.find_element_by_id('SIDO_NM0')
# option 태그로 데이터 확인
sido_list = sido_list_raw.find_elements_by_tag_name('option')
# value 옵션 조회
sido_names = [option.get_attribute('value') for option in sido_list]
sido_names.remove("")- 값 전달
sido_list_raw.send_keys(sido_names[3])
# 서울로 고정
sido_list_raw.send_keys(sido_names[0])
2. 시/군/구

- id와 옵션 확인
# id로 확인
gu_list_raw = driver.find_element_by_id('SIGUNGU_NM0')
# option으로 추출
gu_list = gu_list_raw.find_elements_by_tag_name('option')
# value 옵션 확인
gu_names = [option.get_attribute('value') for option in gu_list]
gu_names.remove("")

# 구 변경 테스트
gu_list_raw.send_keys(gu_names[1])
3. 엑셀 저장
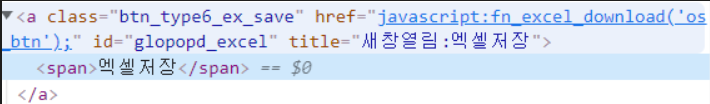
- id 확인
# 클릭하여 저장 테스트
element_get_excel = driver.find_element_by_id('glopopd_excel').click()
# element_get_excel = driver.find_element_by_css_selector('#glopopd_excel').click()
4. 데이터 다운로드
- 모든 구 엑셀 파일 저장
for gu in notebook.tqdm(gu_names):
    element = driver.find_element_by_id("SIGUNGU_NM0")
    element.send_keys(gu)
    # 빠른 속도로 진행되면 갱신이 제대로 이루어지지 않을 수 있다.
    time.sleep(2)

    element_get_excel = driver.find_element_by_id('glopopd_excel').click()
    time.sleep(1)
# 드라이버 종료
driver.close()- 엑셀 파일 확인
- 지역, 상호, 주소, 상표, 전화번호, 셀프여부, 오일(고급휘발유, 휘발유, 경유)

- 지역, 상호, 주소, 상표, 전화번호, 셀프여부, 오일(고급휘발유, 휘발유, 경유)
◾주유소 가격 정보 정리
- 파일 목록 가져오기
glob('경로/파일명.확장자')
glob("../data/05/gu/*.xls")- 파일 목록 저장
stations_files = glob("../data/05/gu/*.xls")- 파일 테스트
tmp = pd.read_excel(stations_files[0], header=2)
tmp.head(2)
concat: 형식이 동일하고 연결하면 되는 경우 사용
tmp_raw = []

for file_name in stations_files:
    tmp = pd.read_excel(file_name, header=2)
    tmp_raw.append(tmp)

station_raw = pd.concat(tmp_raw)
station_raw.head(2)
station_raw.tail(2)

- 정보 확인 : 인덱스가 맞지 않는 것을 확인
station_raw.info()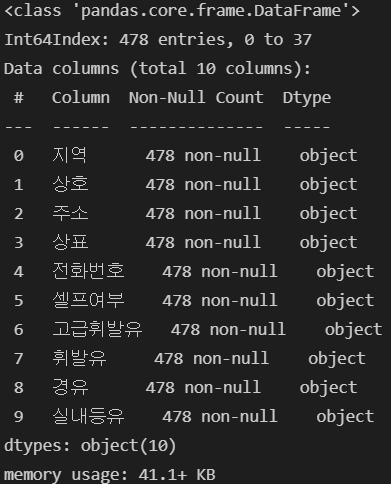
- 필요한 데이터만 추출
# 데이터 추출
stations = pd.DataFrame(
    {
        "상호" : station_raw.get("상호"),
        "주소" : station_raw.get("주소"),
        "가격" : station_raw.get("휘발유"),
        "셀프" : station_raw.get("셀프여부"),
        "상표" : station_raw.get("상표"),
    }
)

# 구 정보 추가
stations["구"] = [eachAddress.split()[1] for eachAddress in stations.get("주소")]

# 가격 타입 변경
# 없는 값 제외
stations = stations[stations["가격"] != "-"]
# 타입 변경
stations["가격"] = stations["가격"].astype("float")

# 인덱스 번호 재설정
stations.reset_index(inplace=True)
# 이전의 index 컬럼 삭제
del stations['index']

stations.tail(2)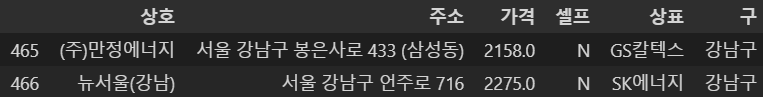
- 데이터 저장
stations.to_excel('../data/05/05. stations_final.xlsx', encoding='utf-8')◾주유소 가격 시각화
1. 데이터 시각화
- 데이터 확인
stations = pd.read_excel('../data/05/05. stations_final.xlsx', index_col = 0)- 셀프 주유소 여부에 따른 가격 차이
- 셀프 주유소인 경우가 대체로 저렴한 것을 확인
# pandas boxplot
stations.boxplot(column="가격", by = '셀프', figsize=(12, 8));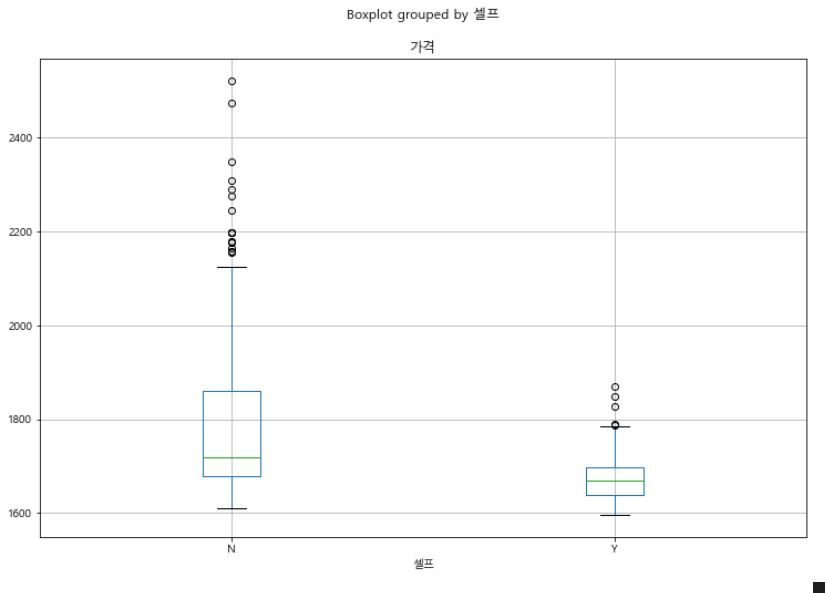
# Seaborn boxplot
plt.figure(figsize=(12, 8))
sns.boxplot(x='셀프', y='가격', data=stations, palette="Set3")
plt.grid()
plt.show()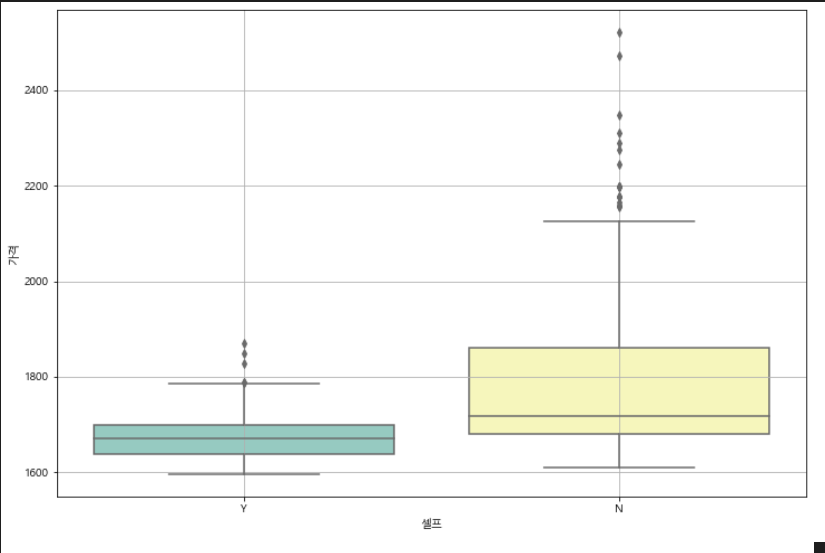
- 메이커 별 가격 분포
# Seaborn boxplot
plt.figure(figsize=(12, 8))
sns.boxplot(x='상표', y='가격', hue = '셀프', data=stations, palette="Set3")
plt.grid()
plt.show()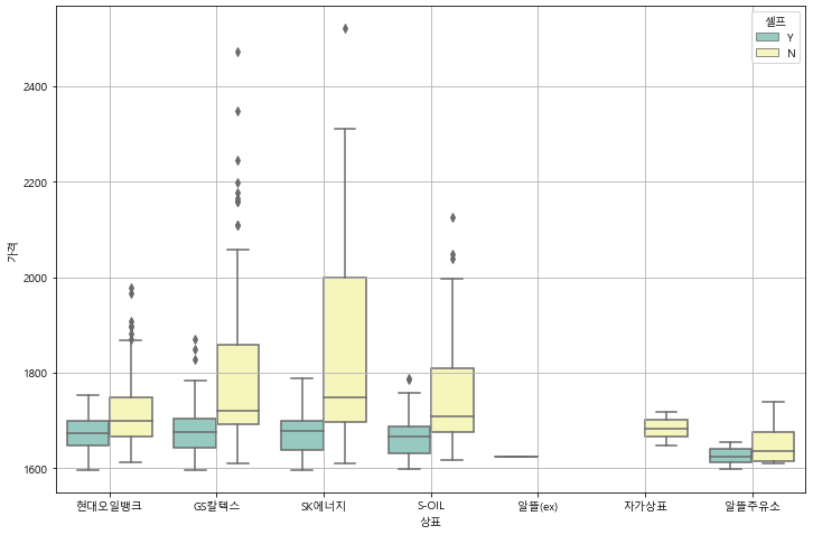
2. 지도 시각화
- 가격 순으로 내림차순 정렬
stations.sort_values(by="가격", ascending=False).head(10)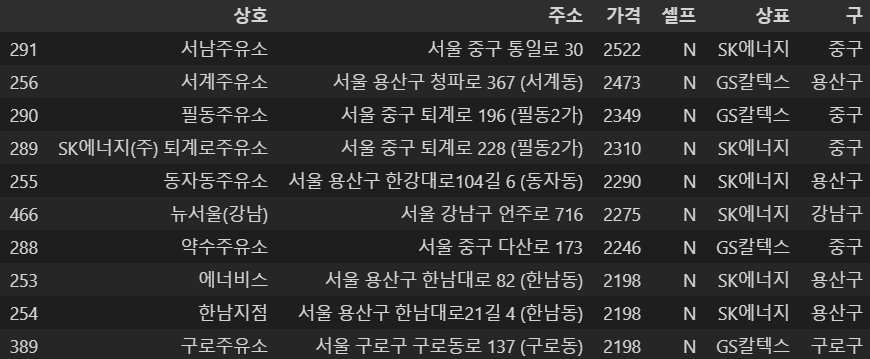
- 가격 순으로 오름차순 정렬
stations.sort_values(by="가격", ascending=True).head(10)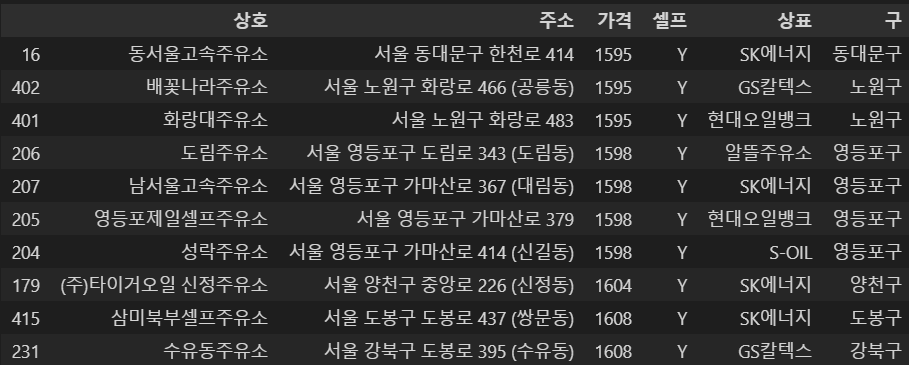
- 구별 평균값
gu_data = pd.pivot_table(
                            data = stations,
                            index = ["구"],
                            values = ["가격"],
                            aggfunc = np.mean
                        )
gu_data.head()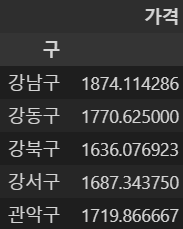
- 지도 시각화
# 지도 시각화
geo_path = "../data/02/02. skorea_municipalities_geo_simple.json"
geo_str = json.load(open(geo_path, encoding="utf-8"))

my_map = folium.Map(
                        location=[37.5502, 126.982],
                        zoom_start=10.5,
                        tiles="Stamen Toner"
                    )

folium.Choropleth(
    geo_data = geo_str,
    data = gu_data,
    columns = [gu_data.index, "가격"],
    key_on = "feature.id",
    fill_color = "PuRd"
).add_to(my_map)

my_map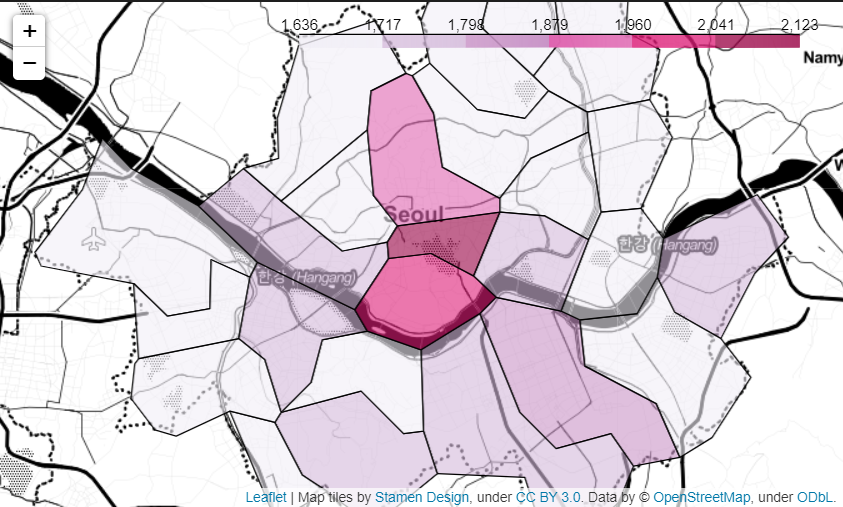

후라이드 치킨