문제 상황
배경
클라이언트 SDK -> log server(springboot) -> logstash -> elasticsearch
위와 같은 과정으로 데이터가 전송됩니다.
데이터의 형태는 아래와 같습니다. 배열안에 여러 개의 로그가 들어가 있는 형태입니다. 로그의 내용은 중요하지 않습니다.
[
  {
    "timestamp": "2025-05-08T00:26:23.500Z",
    "level": "INFO",
    "message": "User clicked on button#sendFetch",
    "source": "frontend",
    "projectKey": "YOUR_PROJECT_KEY_HERE",
    "environment": "development",
    "traceId": "0af413e1-99fd-43cf-b719-9db2cd2969c3",
    "logger": "cholog",
    "logType": "event",
    "payload": null,
    "error": null,
    "http": null,
    "client": {
      "url": "http://127.0.0.1:5500/logger-test.html",
      "userAgent": "Mozilla/5.0 (Windows NT 10.0; Win64; x64) AppleWebKit/537.36 (KHTML, like Gecko) Chrome/136.0.0.0 Safari/537.36",
      "referrer": null
    },
    "event": {
      "type": "user_interaction_click",
      "targetSelector": "button#sendFetch",
      "properties": {
        "elementType": "button",
        "elementId": "sendFetch"
      }
    }
  },
  {
    "timestamp": "2025-05-08T00:26:23.515Z",
    "level": "ERROR",
    "message": "API Call FAILED: POST http://localhost:8080/test",
    "source": "frontend",
    "projectKey": "YOUR_PROJECT_KEY_HERE",
    "environment": "development",
    "traceId": "0af413e1-99fd-43cf-b719-9db2cd2969c3",
    "logger": "cholog",
    "logType": "error",
    "payload": null,
    "error": {
      "type": "TypeError",
      "message": "Failed to fetch",
      "stacktrace": "TypeError: Failed to fetch\n    at window.fetch.window.fetch (https://sim-gyubin.github.io/temp-log-sdk/cholog.min.js:1:6159)\n    at HTMLButtonElement.<anonymous> (http://127.0.0.1:5500/logger-test.html:260:13)"
    },
    "http": {
      "request": {
        "method": "POST",
        "url": "http://localhost:8080/test"
      },
      "response": null,
      "durationMs": 13
    },
    "client": {
      "url": "http://127.0.0.1:5500/logger-test.html",
      "userAgent": "Mozilla/5.0 (Windows NT 10.0; Win64; x64) AppleWebKit/537.36 (KHTML, like Gecko) Chrome/136.0.0.0 Safari/537.36",
      "referrer": null
    },
    "event": null
  },
  {
    "timestamp": "2025-05-08T00:26:23.515Z",
    "level": "ERROR",
    "message": "Fetch 요청 실패:",
    "source": "frontend",
    "projectKey": "YOUR_PROJECT_KEY_HERE",
    "environment": "development",
    "traceId": "0af413e1-99fd-43cf-b719-9db2cd2969c3",
    "logger": "console",
    "logType": "general",
    "payload": null,
    "error": null,
    "http": null,
    "client": {
      "url": "http://127.0.0.1:5500/logger-test.html",
      "userAgent": "Mozilla/5.0 (Windows NT 10.0; Win64; x64) AppleWebKit/537.36 (KHTML, like Gecko) Chrome/136.0.0.0 Safari/537.36",
      "referrer": null
    },
    "event": null
  }
]
문제
kibana를 통해 저장된 데이터 형식이 아래와 같았습니다. 길어서 중간에 대충 지웠습니다. 중요한 것은, 제가 저장하려는 데이터가 message에 그대로 박혀버렸습니다.
- 배열 안의 로그 객체들이 분리가 되지 않습니다.
- json으로 구조화되지 않아, 제 데이터의 키값으로 조회할 수 없습니다.
{
  "@timestamp": [
    "2025-05-07T14:30:01.465Z"
  ],
// 일부 생략
  "http.version.keyword": [
    "HTTP/1.1"
  ],
  "message": [
    "[{\"timestamp\":\"2025-05-07T14:30:00.177Z\",\"level\":\"INFO\",\"message\":\"Navigation event: initial_load to http://127.0.0.1:5500/logger-test.html\",\"source\":\"frontend\",\"projectKey\":\"YOUR_PROJECT_KEY_HERE\",\"environment\":\"development\",\"traceId\":r720fb7983328\",\"logger\":\"console\",\"logType\":\"general\"Chrome/136.0.0.0 Safari/537.36\",\"referrer\":null},\"event\":null}]"
  ],
  "tags": [
    "_jsonparsefailure"
  ],
  "_id": "JHwnq5YB24EjwFGUTTdM",
  "_index": "cholog-sdk-logs-2025.05.07",
  "_score": null
}
Logstash에서 확인할 수 있는 에러 로그는 다음과 같았습니다.
[2025-05-08T00:21:50,399][INFO ][logstash.codecs.json ][main][fab94bb3399f8dbb6023b4787f88e5fe10939e75966d819b320c9d0e6980d974] ECS compatibility is enabled but `target` option was not specified. This may cause fields to be set at the top-level of the event where they are likely to clash with the Elastic Common Schema. It is recommended to set the `target` option to avoid potential schema conflicts (if your data is ECS compliant or non-conflicting, feel free to ignore this message)접근
1. json 코덱 사용
# logstash.conf

input {
  http {
    port => 50000
    codec => json { # 요거!
      target => "log_data"
    }
  }
}

output {
  elasticsearch {
    hosts => ["https://es01:9200"]
    index => "cholog-sdk-logs-%{+YYYY.MM.dd}"
    user => "elastic"
    password => "비밀번호"
    ssl => true
    ssl_certificate_verification => false # 개발용
  }

  stdout {
    codec => rubydebug
  }
}
그러나 문제 상황은 여전했습니다.
제 데이터가 {key:value} Json 객체 형식이 아니라 [{key:value},...] 처럼 배열로 한번 감싸진 Json배열 형태인 것이 원인입니다.
정확히는 http 입력 플러그인이 Content-Type: application/json을 받으면 기본적으로 JSON 파싱을 시도하는데 (설정에 target이 명시되지 않았거나, 명시되었어도)
이때, 객체가 아니라 배열을 마주하게 된다면 최상위 필드로 만들지 못할 것입니다. 그래서 파싱 실패(_jsonparsefailure)로 이어지고 또 원본 문자열을 그냥 뭉텅이로 message 필드에 넣어버립니다.
2.logstash의 split과 filter
logstash.conf를 수정해서 split과 filter를 활용했습니다.
input의json코덱을 없애고json필터로source의 배열 문자열을target에 지정된 필드에 배열 객체로 파싱하고target필드를split으로 분리했습니다.
수정 후 =>
# logstash.conf

input {
  http {
    port => 50000
  }
}

filter {
  # 'message' 필드에 저장된 JSON 배열 문자열을 파싱
  # HTTP input은 보통 요청 본문을 'message' 필드에 저장
  json {
    source => "message"      # 파싱할 소스 필드 (HTTP 요청 본문)
    target => "log_entries_array" # 파싱된 JSON 배열을 임시 필드에 저장
  }

  #'log_entries_array' 필드가 존재하는지 (즉, 위 json 필터가 성공했는지) 확인 후,
  # 배열의 각 요소를 별도의 이벤트로 분리
  if "[log_entries_array]" {
    split {
      field => "log_entries_array" # 분리할 배열 필드
      # 이 작업을 통해 배열의 각 객체가 개별 Logstash 이벤트의 루트가 됩니다.
    }
  } else {
    # JSON 파싱 실패 시 태그를 추가하여 문제를 추적
    mutate {
      add_tag => ["_json_filter_parse_failure_in_filter_stage"]
    }
  }

  # 분리된 개별 이벤트에서 더 이상 필요 없는 원본 'message' 필드와 임시 배열 필드('log_entries_array')를 제거
  # 'split' 필터는 기본적으로 분리가 완료된 새 이벤트에서 원본 배열 필드('log_entries_array')를 제거
  # 따라서 여기서는 'message' 필드만 명시적으로 제거
  mutate {
    remove_field => ["message"]
  }
}

output {
  elasticsearch {
    hosts => ["https://es01:9200"]
    index => "cholog-sdk-logs-%{+YYYY.MM.dd}"
    user => "elastic"
    password => "비밀번호"
    ssl => true                   # HTTPS를 사용한다면 true
    ssl_certificate_verification => false # 로컬에서 개발용 !
  }
  stdout {
    codec => rubydebug
  }
}
적용 후
된 것
배열 안에 들어있던 각 로그 객체가 분리가 되었습니다.
안 된 것
- 분리가 덜 됨
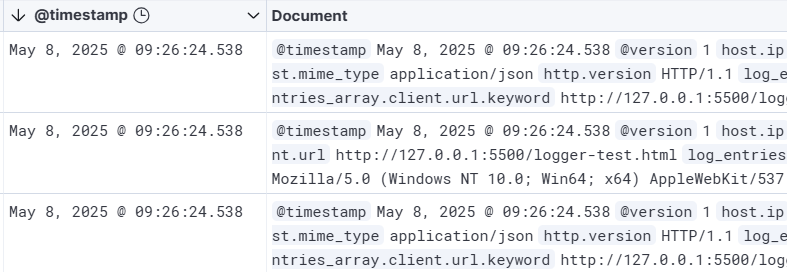
아래 처럼log_entries_array.가 붙어있습니다. 분리된 객체 필드들이 최상위로 올라오길 바랐는데,log_entries_array.객체에 남아있는 듯 합니다.
    "log_entries_array.level.keyword": [
      "INFO"
    ],
    "log_entries_array.environment.keyword": [
      "development"
    ],
그리고 아직_jsonparsefailure 태그가 남아있습니다. 여전히 http에서 자동 파싱을 시도하다가 실패한 것 같습니다. 그러나 Content-type을 바꾸지 않을 것이므로 태그를 지우는 명령어를 두겠습니다.
3. jsonencode
docker 컨테이너 안에 json_encode 플러그인을 설치해주었습니다.
혹은 ruby로도 할 수 있는 것 같습니다
docker exec -it <your_logstash_container_id_or_name> /bin/bash

bin/logstash-plugin install logstash-filter-json_encode
conf파일을 아래와 같이 수정하였습니다. Gemini 2.5가 도와주었습니다. 쌩큐
log_entries_array접두사를TEMP_PARSED_JSON_ARRAY로 바꿨습니다. (구분 목적일 뿐, 큰 의미없음)split필터 이후 아래와 같은 로직이 있습니다.
- 1단계 (json_encode): TEMP_PARSED_JSON_ARRAY 필드 안에 들어있던 객체 (실제 로그 데이터)를 통째로 JSON 문자열로 변환하여 임시 필드 [@metadata][temp_json_string]에 저장합니다.
- 2단계 (json 필터와 target => ""): 이것이 가장 핵심적인 해결 부분입니다! 임시 필드에 저장된 JSON 문자열을 다시 파싱하면서 target => "" 옵션을 사용했습니다. 이 옵션은 파싱된 JSON 객체의 모든 키-값 쌍을 이벤트의 최상위 레벨로 직접 병합하는 역할을 합니다. 즉, level, message, client.url 등의 필드들이 이 단계에서 최상위로 "승격"된 것입니다.
- 3단계 (mutate remove_field): 더 이상 필요 없는 원본 TEMP_PARSED_JSON_ARRAY 필드(내부에 객체를 담고 있던)와 임시 메타데이터 필드를 제거하여 이벤트를 깔끔하게 정리합니다.
# logstash.conf

input {
  http {
    port => 50000
  }
}

filter {
  # 1. 'message' 필드에 있는 JSON 배열 문자열을 실제 JSON 배열 객체로 파싱합니다.
  json {
    source => "message"
    target => "TEMP_PARSED_JSON_ARRAY"
  }

  # 2. "TEMP_PARSED_JSON_ARRAY" 필드가 실제로 생성되었는지 확인합니다.
  if "[TEMP_PARSED_JSON_ARRAY]" { # 이 조건은 TEMP_PARSED_JSON_ARRAY가 배열일 때를 가정
    split {
      field => "TEMP_PARSED_JSON_ARRAY"
    }

    # 2b. (핵심 문제 해결 - json_encode 필터 사용, if 조건문 수정)
    #     split 후에도 "TEMP_PARSED_JSON_ARRAY" 필드가 남아있고,
    #     이것이 실제 로그 필드들을 담고 있는 객체일 경우 (split의 예기치 않은 동작으로 인해),
    #     해당 객체 내부의 필드들을 이벤트의 최상위 레벨로 끌어올립니다.
    if [TEMP_PARSED_JSON_ARRAY] { # <--- 수정된 부분: 올바른 Logstash 조건문
                                 # 이 시점에서 TEMP_PARSED_JSON_ARRAY는 객체일 것으로 예상
      json_encode {
        source => "TEMP_PARSED_JSON_ARRAY"
        target => "[@metadata][temp_json_string]"
      }
      json {
        source => "[@metadata][temp_json_string]"
        target => ""
      }
      mutate {
        remove_field => ["TEMP_PARSED_JSON_ARRAY", "[@metadata][temp_json_string]"]
      }
    }
  } else {
    mutate {
      add_tag => ["_json_filter_parse_failure_in_filter_stage"]
    }
  }

  # 3. 원본 `message` 필드는 더 이상 필요 없으므로 제거합니다.
  mutate {
    remove_field => ["message"]
  }

  # 4. `_jsonparsefailure` 태그를 제거합니다.
  if !("_json_filter_parse_failure_in_filter_stage" in [tags]) {
      mutate {
        remove_tag => ["_jsonparsefailure"]
      }
  }
}

output {
  elasticsearch {
    hosts => ["https://es01:9200"]
    index => "cholog-sdk-logs-%{+YYYY.MM.dd}"
    user => "elastic"
    password => "비밀번호"
    ssl => true
    ssl_certificate_verification => false
  }

  stdout {
    codec => rubydebug
  }
}
결과
의도한 대로 저장되었습니다.
저장된 결과 (길어서 중간 날림)
{
  "@timestamp": [
    "2025-05-08T02:25:21.249Z"
  ],
  "@version": [
    "1"
  ],

  "environment": [
    "development"
  ],
  "environment.keyword": [
    "development"
  ],
  "event.properties.elementId": [
    "triggerSyntaxError"
  ],
  "event.properties.elementId.keyword": [
    "triggerSyntaxError"

  "user_agent.original": [
    "Java-http-client/21.0.5"
  ],
  "user_agent.original.keyword": [
    "Java-http-client/21.0.5"
  ],
  "_id": "LJm2rZYBaAsIffW0NJQH",
  "_index": "cholog-sdk-logs-2025.05.08",
  "_score": null
}
그런데 뭔가 이상합니다.
message필드가 사라졌습니다. "User clicked on button#triggerSyntaxError"와 같은 내용을 담는 핵심 필드입니다.
아마 이게 원인인 것 같습니다.
  # 3. 원본 `message` 필드는 더 이상 필요 없으므로 제거합니다.
  mutate {
    remove_field => ["message"]
  }
http입력에서 json 데이터를 message 필드에 담아오는데, 이것을 없애려다가, 최상위로 올라간 제 데이터의 message필드도 같이 날려버린 듯 합니다.
4. remove_field 위치 조정
message필드의 이름을 바꿀까도 고민해봤지만, message가 제일 적합한 이름인 것 같고, 또 logstash의 처리 로직에 허점이 있는거라고 판단해서 conf파일을 수정했습니다.
원본 message필드 (json배열 문자열 담던거)는 TEMP_PARSED_JSON_ARRAY로 파싱된 직후에, 그리고 split 이나 개별 로그의 message 필드가 최상위로 올라오기 전에 제거해야겠습니다.
순서를 조정했습니다.
# logstash.conf

input {
  http {
    port => 50000
  }
}

filter {
  # 1. 'message' 필드(JSON 배열 문자열로 예상)를 파싱하여 'TEMP_PARSED_JSON_ARRAY'에 저장
  json {
    source => "message"
    target => "TEMP_PARSED_JSON_ARRAY"
    # 이 단계에서 파싱 실패 시, "_jsonparsefailure" 태그가 추가되고 'message' 필드는 그대로 남음
  }

  # 2. 위 1단계의 JSON 파싱이 성공하여 "TEMP_PARSED_JSON_ARRAY" 필드가 생성되었다면:
  if "[TEMP_PARSED_JSON_ARRAY]" {
    # 2a. 원본 'message' 필드(JSON 배열 문자열을 담고 있던)는 이제 필요 없으므로 제거
    #     이것이 개별 로그의 'message' 필드가 최상위로 올라오기 전에 실행되므로 안전함
    mutate {
      remove_field => ["message"]
    }

    # 2b. 배열을 분리
    split {
      field => "TEMP_PARSED_JSON_ARRAY"
    }

    # 2c. split 후 "TEMP_PARSED_JSON_ARRAY" 필드가 객체 형태로 남아있는 경우 (예상치 못한 동작)
    #     해당 객체 내부의 필드들을 최상위 레벨로 승격
    if [TEMP_PARSED_JSON_ARRAY] {
      json_encode {
        source => "TEMP_PARSED_JSON_ARRAY"
        target => "[@metadata][temp_json_string]"
      }
      json {
        source => "[@metadata][temp_json_string]"
        target => "" # 개별 로그의 "message" 필드가 있다면 여기서 최상위로 올라옴
      }
      mutate {
        remove_field => ["TEMP_PARSED_JSON_ARRAY", "[@metadata][temp_json_string]"]
      }
    }
  }
  # 만약 1단계의 JSON 파싱이 실패했다면, 'message' 필드는 원본 내용을 그대로 가지고 있으며,
  # json 필터에 의해 '_jsonparsefailure' 태그가 추가된 상태일 것입니다.

  # 3. '_jsonparsefailure' 태그가 있다면 제거
  #    이 태그는 http 입력단의 코덱 또는 위 1단계의 json 필터에서 발생할 수 있음
  if "_jsonparsefailure" in [tags] {
    mutate {
      remove_tag => ["_jsonparsefailure"]
    }
  }
}

output {
  elasticsearch {
    hosts => ["https://es01:9200"]
    index => "cholog-sdk-logs-%{+YYYY.MM.dd}"
    user => "elastic"
    password => "비밀번호"
    ssl => true
    ssl_certificate_verification => false
  }

  stdout {
    codec => rubydebug
  }
}
결과
// ...
    "message": [
      "User clicked on button#triggerSyntaxError"
    ],
// ...
이젠 메시지도 잘 보이는 듯 합니다
끝
단기간의 프로젝트로서 elastic 스택에 대한 이해가 적은 상태라 치였습니다.
이번 트러블 슈팅으로 기술적으로 배운 내용은
- http 입력 플러그인은 Content-Type이 application/json이면 자동으로 JSON 파싱을 시도하며, 이때 배열 데이터를 루트에 병합하려다 실패하면 _jsonparsefailure 태그와 함께 원본 문자열을 message 필드에 남길 수 있다는 점.
- split 필터와 json 필터 그리고 target 옵션을 알게되었습니다.
- logstash의 설정으로 다양한 것이 가능한 것을 알았습니다.
- Gemini가 똑똑한것을 알았습니다.