Bar 그래프의 활용
fig = go.Figure()
fig.add_trace(go.Bar(x=df['시군구명'],y=df['총 의료시설수'],name = "총 의료시설수"))
fig.add_trace(go.Bar(x=df['시군구명'],y=df['약국 시설수'],name = "약국 시설수"))
fig.update_xaxes(tickangle=60)
fig.update_layout(title_text='총 병원 수와 약국 시설 수')
fig.show()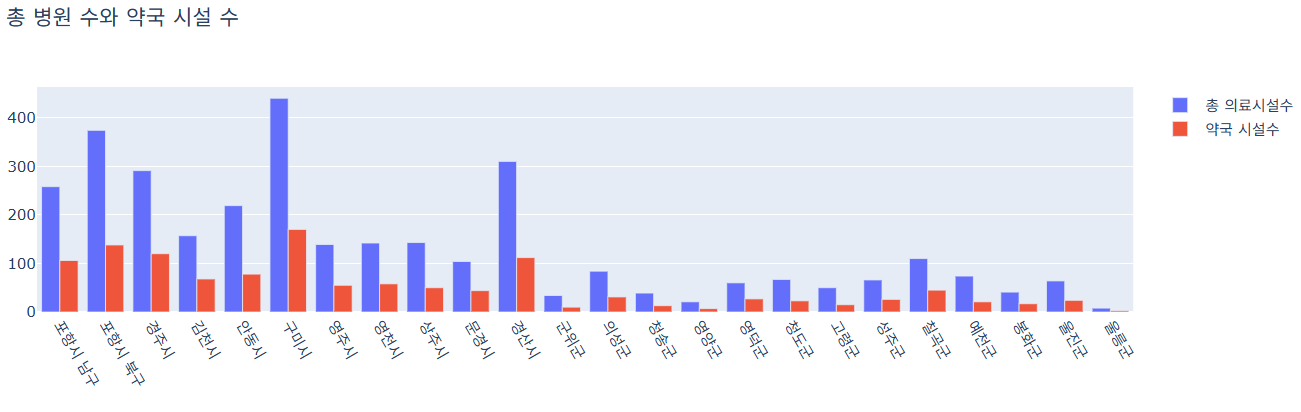
새로운 데이터 열 만들기
총 병원 = [
    '종합병원 시설수',
    '일반병원 시설수',
    '요양병원 시설수',
    '치과병의원 시설수',
    '한방병의원 시설수',
    '일반의원 시설수',
    '보건소 시설수'
]
#
# 총 의료시설 수 컬럼 #.sum(axis=1)은 각 행마다 더해서 총합을 구합니다.
df['총 의료시설수'] = df[총 병원].sum(axis=1)
print(df[['시군구명', '총 의료시설수']])
>>
      시군구명  총 의료시설수
0   포항시 남구      258
1   포항시 북구      374
2      경주시      291
3      김천시      157
...
23     울릉군        8
지하철 범죄 데이터 조회
df = pd.read_csv('경찰청_범죄 발생 장소별 통계-2.csv', encoding='UTF-8')
df = df[['지하철_전철', '범죄대분류']].sort_values(by='지하철_전철', ascending=False)#sort_values 오름차순 정렬
fig = px.bar(df, x='지하철_전철', y='범죄대분류',orientation='h')
fig.show()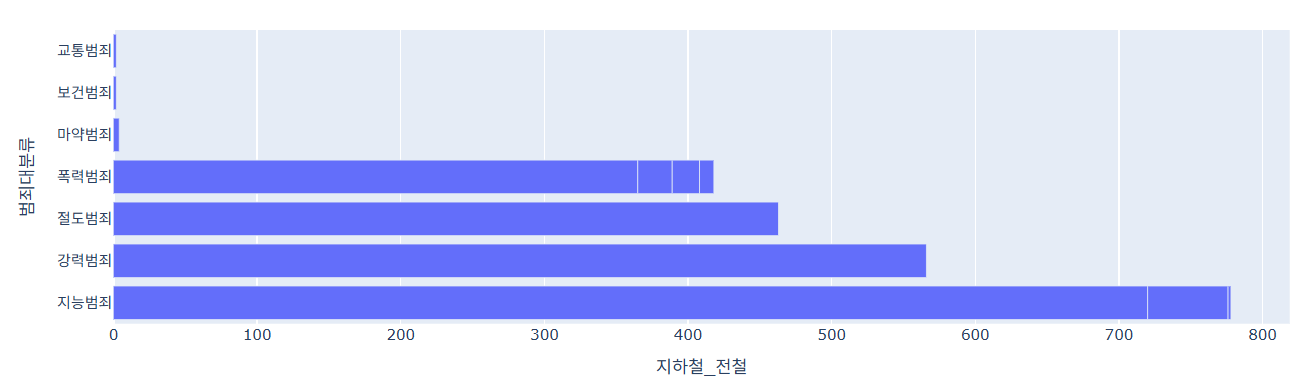
부산광역시영도구동별 빈집현황
fig = px.bar(df, x='행정동명', y='빈집수(호)', text_auto='빈집수(호)')

fig.update_traces(textfont_size=12,textfont_color='white', textangle=0, textposition="inside")
fig.update_layout(title_text='부산광역시_영도구_동별 빈집현황')
fig.show()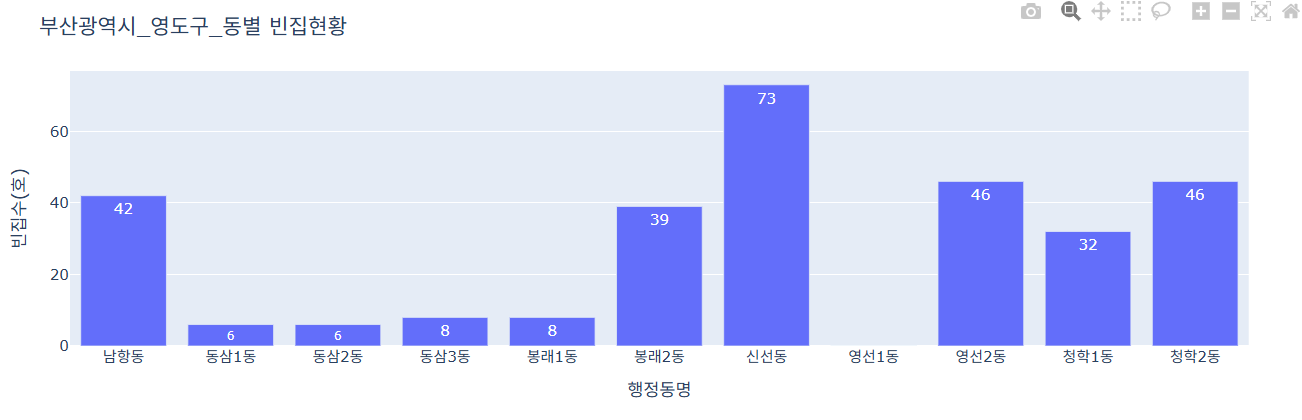
강원랜드_게임기현황
fig = px.bar(df, x="게임명", y="대수",pattern_shape="대수")

fig.show()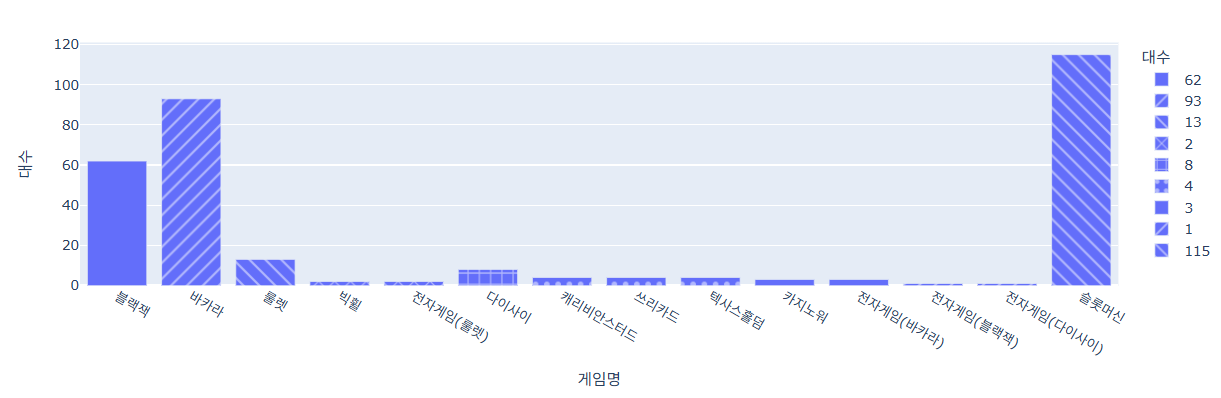

프로그래머 꿈나무