D3.js
Data - Driven Documents. JavaScript
데이터 중심의 문서 (Data - Driven Documents)의 약자로 자바스크립트 기반의 라이브러리 언어이다.
사용자가 입력한 시각화 규칙을 바탕으로 데이터를 반영해 시각화 결과물을 생성한다.
데이터 시각화 프레임워크로 잘 알려져 있고 HTML5의 SVG(Scalable Vector Graphic) 을 통하여 다양한 화면 해상도에서도 깨짐없는 Visualizing이 가능하다.
D3 동작과정
- Loading - 시각적 요소를 그리기 전 보여주고자 하는 데이터를 불러온다.
- Selecting-Binding - 시각적 요소 안에 데이터 수치를 입력한 코드에 맞춰 연동시킨다.
- Transform - 그래프의 유형, 색상, 축 등 다양한 요소 지정
- Transition - 클릭, 드래그 등 인터렉션 효과 지정
SVG
Scalable Vector Graphics
웹용 백터그래픽으로 HTML 문서에 직접 포함시키거나 삽입할 수 있다.
인터넷 익스플로러 8 이하를 제외한 모든 브라우저에서 지원한다
- 코드작업으로 이미지 편집 가능
- 품질손상없이 확대/축소 가능
D3 메서드
대부분의 D3메서드는 결과 값으로 선택물의 참조를 반환하므로, 메서드를 체인으로 연결할 때는 순서가 중요하다. 어떤 메서드의 반환 값 타입은 체인으로 연결된 다음 메서드가 기대하는 입력 값과 맞아야 한다.
메서드 체인이란 구두점(.)과 함께 메서드를 체인처럼 연결함으로써 코드 한 줄에 여러 동작을 실행할 수 있는 기법.
d3.select() - 현재 문서에서 특정 태그 하나를 선택하는 메서드
d3.selectAll() - 특정 태그 전체를 선택
.data() - 참조 연결할 데이터를 가져옴 (선택된 태그에 대한 데이터 매칭)
.enter() - 데이터 개수 만큼 태그가 부족할때, 부족한 갯수만큼 플레이스 홀더를 반환
.append() - 새로운 태그 추가
.exit() - 종료 (더이상 필요없는 태그 반환)
.remove - 현재 문서에서 선택된 태그를 제거
var dataset = [ 5, 10, 15, 20, 25 ];

d3.select("body")          // body 요소 선택
  .selectAll("p")          // p태그를 가진 요소를 선택
  .data(dataset)           // 해당 태그와 dataset을 바인딩
  .enter()                 // 바인딩 되지 못하고 남은 녀석들의 selection 객체 반환
  .append("p")             // 해당 객체에 p라는 태그를 더 붙임
  .text("New p!"); // 이 새로운 요소에 "New p!" 라는 text 추가
D3로 SVG 만들기
D3를 사용해서 사각형, 원형, 선을 그려보자
index.html
<head>
  <meta charset="UTF-8" />
  <meta name="viewport" content="width=device-width, initial-scale=1.0" />
  <meta http-equiv="X-UA-Compatible" content="ie=edge" />
  <link rel="stylesheet" href="./styles/style.css" />
  <title>D3-Tutorial</title>
  <script src="https://d3js.org/d3.v5.min.js"></script> // d3 연결
</head>

<body>
  <div class="canvas">
    <h1 class="title">SVG</h1>
  </div>
  <script src="./lib/svg.js"></script>	// js 파일 연결
</body>
자바스크립트 삽입 위치
브라우저는 HTML의 구조와 CSS 스타일을 렌더링하는 도중 자바스크립트를 만나게 되면 이에 대한 해석과 구현이 완료이 완료될때까지 브라우저 렌더링을 멈추게 된다.
즉, 자바스크립트의 삽입 위치에 따라 스크립트 실행순서와 브라우저 렌더링에 영향을 미친다는 것이다.
head에 삽입되는 경우
- 브라우저 렌더링에 방해가 되어 무거운 스크립트가 실행되는 경우 오랫동안 완성되지 못한 화면을 노출하게 된다.
- 문서를 초기화하거나 설정하는 가벼운 스크립트들이 자주 사용된다.
- 문서의 DOM(Document Object Model) 구조가 필요한 스크립트의 경우 document.onload와 같은 로드 이벤트가 추가되어야 에러없이 작동된다.
body에 삽입되는 경우
- 브라우저가 렌더링이 완료된 상태에서 스크립트가 실행되기에 콘텐츠를 변경하는 스크립트의 경우 화면에 노출된체로 변화된다.
- 앞에 삽입하는 경우가 대부분의 스크립트의 위치로 추천되는 위치이다.
- 문서의 DOM 구조가 완료된 시점에 실행되기에 별다른 추가설정이 필요없다.
HTML 파일 head에 d3 파일을 연결해주고 body 맨아래에 작성할 js 파일을 연결한다.
// HTML DOM 선택
const canvas = d3.select(".canvas");

// append 새로운 태그 추가
// attr 속성 지정
const svg = canvas
  .append("svg")
  .attr("height", 600)
  .attr("width", 600);

// 메소드 체인 방식
svg
  .append("rect") // 사각형
  .attr("width", 200)
  .attr("height", 100)
  .attr("fill", "orange")
  .attr("x", 20)
  .attr("y", 20);

svg
  .append("circle") // 원형
  .attr("r", 50)
  .attr("cx", 300)
  .attr("cy", 70)
  .attr("fill", "purple");

svg
  .append("line") // 선
  .attr("x1", 370)
  .attr("x2", 400)
  .attr("y1", 20)
  .attr("y2", 120)
  .attr("stroke", "white");

svg.append("text") // text
  .attr('x', 20)
  .attr('y', 200)
  .attr('fill', 'white')
  .text('Hello Text')
  .style('font-falmily', 'arial'); // style 적용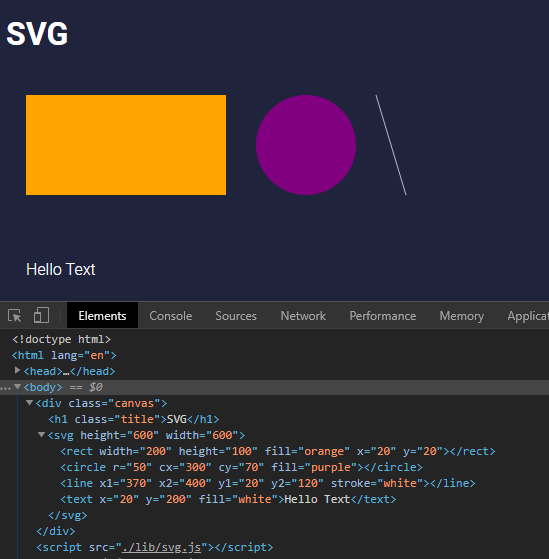
Grouping Elements
만들어둔 3가지 도형을 그룹화할 수 있다.
// 그룹 만들기
const group = svg.append('g')

// 메소드 체인 방식
group
  .append("rect") // 사각형
  .attr("width", 200)
  .attr("height", 100)
  .attr("fill", "orange")
  .attr("x", 20)
  .attr("y", 20);

group
  .append("circle") // 원형
  .attr("r", 50)
  .attr("cx", 300)
  .attr("cy", 70)
  .attr("fill", "purple");

group
  .append("line") // 선
  .attr("x1", 370)
  .attr("x2", 400)
  .attr("y1", 20)
  .attr("y2", 120)
  .attr("stroke", "white");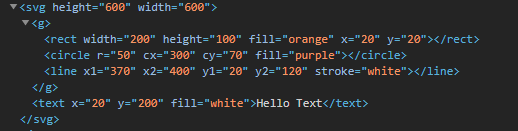
y axis group
x axis group
bar group
Data 연결
index.html
<div class="canvas">
    <h1 class="title">SVG</h1>
    <svg>
      <rect></rect>
    </svg>
  </div>
app.js
const data = [{
    width: 200,
    height: 100,
    fill: 'purple'
}]

const svg = d3.select('svg');

const rect = svg.select('rect')
    .data(data)
    .attr('width', function (d) {
        console.log(d);
        return 400
    })
    .attr('height', 100)
    .attr('fill', "orange")
data를 가져와서 연결할 svg에 data()속성으로 지정해주면 data를 연결할 수 있고
속성값에 함수를 사용해서 반환하면 data를 사용할 수있다.
console
{width: 200, height: 100, fill: "purple"}const rect = svg.select('rect')
.data(data)
.attr('width', function (d) {
return d.width
})
.attr('height', function (d) {
return d.height
})
.attr('fill', function (d) {
return d.fill
})파라미터에 따른 값 알아보기
const rect = svg.select('rect')
    .data(data)
    .attr('width', (d, i, n) => {
        console.log(i); // 0
        console.log(n); // [rect]
        console.log(n[i]) // <rect width="200" height="100" fill="purple"></rect>
        return d.width
    })
d 는 data를 반환하고
i 는 data의 index를 반환한다.
n 은 배열을 반환한다.
n[i] 로 해당하는 값을 가져올 수 있다.
가상 DOM
const data = [{
        width: 200,
        height: 100,
        fill: 'purple'
    },
    {
        width: 100,
        height: 60,
        fill: 'orange'
    },
    {
        width: 50,
        height: 30,
        fill: 'skyblue'
    }
]

const svg = d3.select('svg');

const rects = svg.selectAll('rect')
    .data(data);

// 이미 존재하는 DOM의 속성
rects.attr('width', (d, i, n) => d.width)
    .attr('height', (d) => d.height)
    .attr('fill', (d) => d.fill);

// 바인딩 되지 못하고 남은 데이터에 맞는 가상 DOM 생성
rects.enter()
    .append('rect')
    .attr('width', (d, i, n) => d.width)
    .attr('height', (d) => d.height)
    .attr('fill', (d) => d.fill);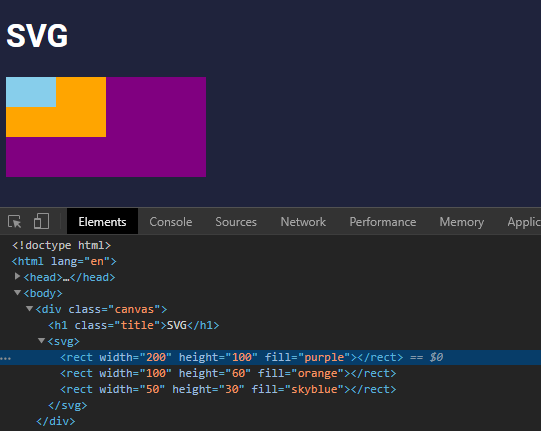
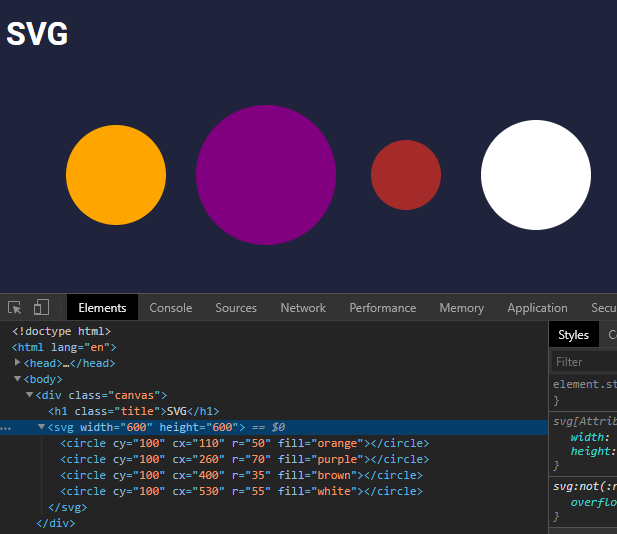
Json Data 연결
planets.jsxon
[{
        "radius": 50,
        "distance": 110,
        "fill": "orange"
    },
    {
        "radius": 70,
        "distance": 260,
        "fill": "purple"
    },
    {
        "radius": 35,
        "distance": 400,
        "fill": "brown"
    },
    {
        "radius": 55,
        "distance": 530,
        "fill": "white"
    }
]
index.html
<div class="canvas">
    <h1 class="title">SVG</h1>
    <svg width="600" height="600">
    </svg>
  </div>
app.js
const svg = d3.select('svg');

d3.json('../planets.json').then(data => {

    const circs = svg.selectAll('circle')
        .data(data);

    circs.attr('cy', 200)
        .attr('cx', d => d.distance)
        .attr('r', d => d.radius)
        .attr('fill', d => d.fill)

    circs.enter()
        .append('circle')
        .attr('cy', 100)
        .attr('cx', d => d.distance)
        .attr('r', d => d.radius)
        .attr('fill', d => d.fill)
})
참조
https://github.com/d3/d3/blob/master/API.md#arrays-d3-array
https://observablehq.com/@d3/bar-chart

자세한 설명에 이해가 쏙쏙 됩니다