로컬 파일로부터 노트북 생성
1. 노트북 파일 다운로드
- 다음 링크에서 노트북 파일을 로컬로 다운받습니다.
Test_notebook_for_task.ipynb
2. 새 노트북 생성
- Projects > Workspaces 메뉴로 이동합니다
+ Add new버튼을 클릭하여Upload files메뉴를 선택합니다- 로컬 PC에 저장된 Test_notebook_for_task.ipynb파일을 엽니다
- 상단의
Connect버튼 옆에 아래 화살표⌄를 클릭- 이전 실습에서 사용한 서비스 이름 선택
Run all을 클릭해 전체 노트북 셀을 실행합니다
-
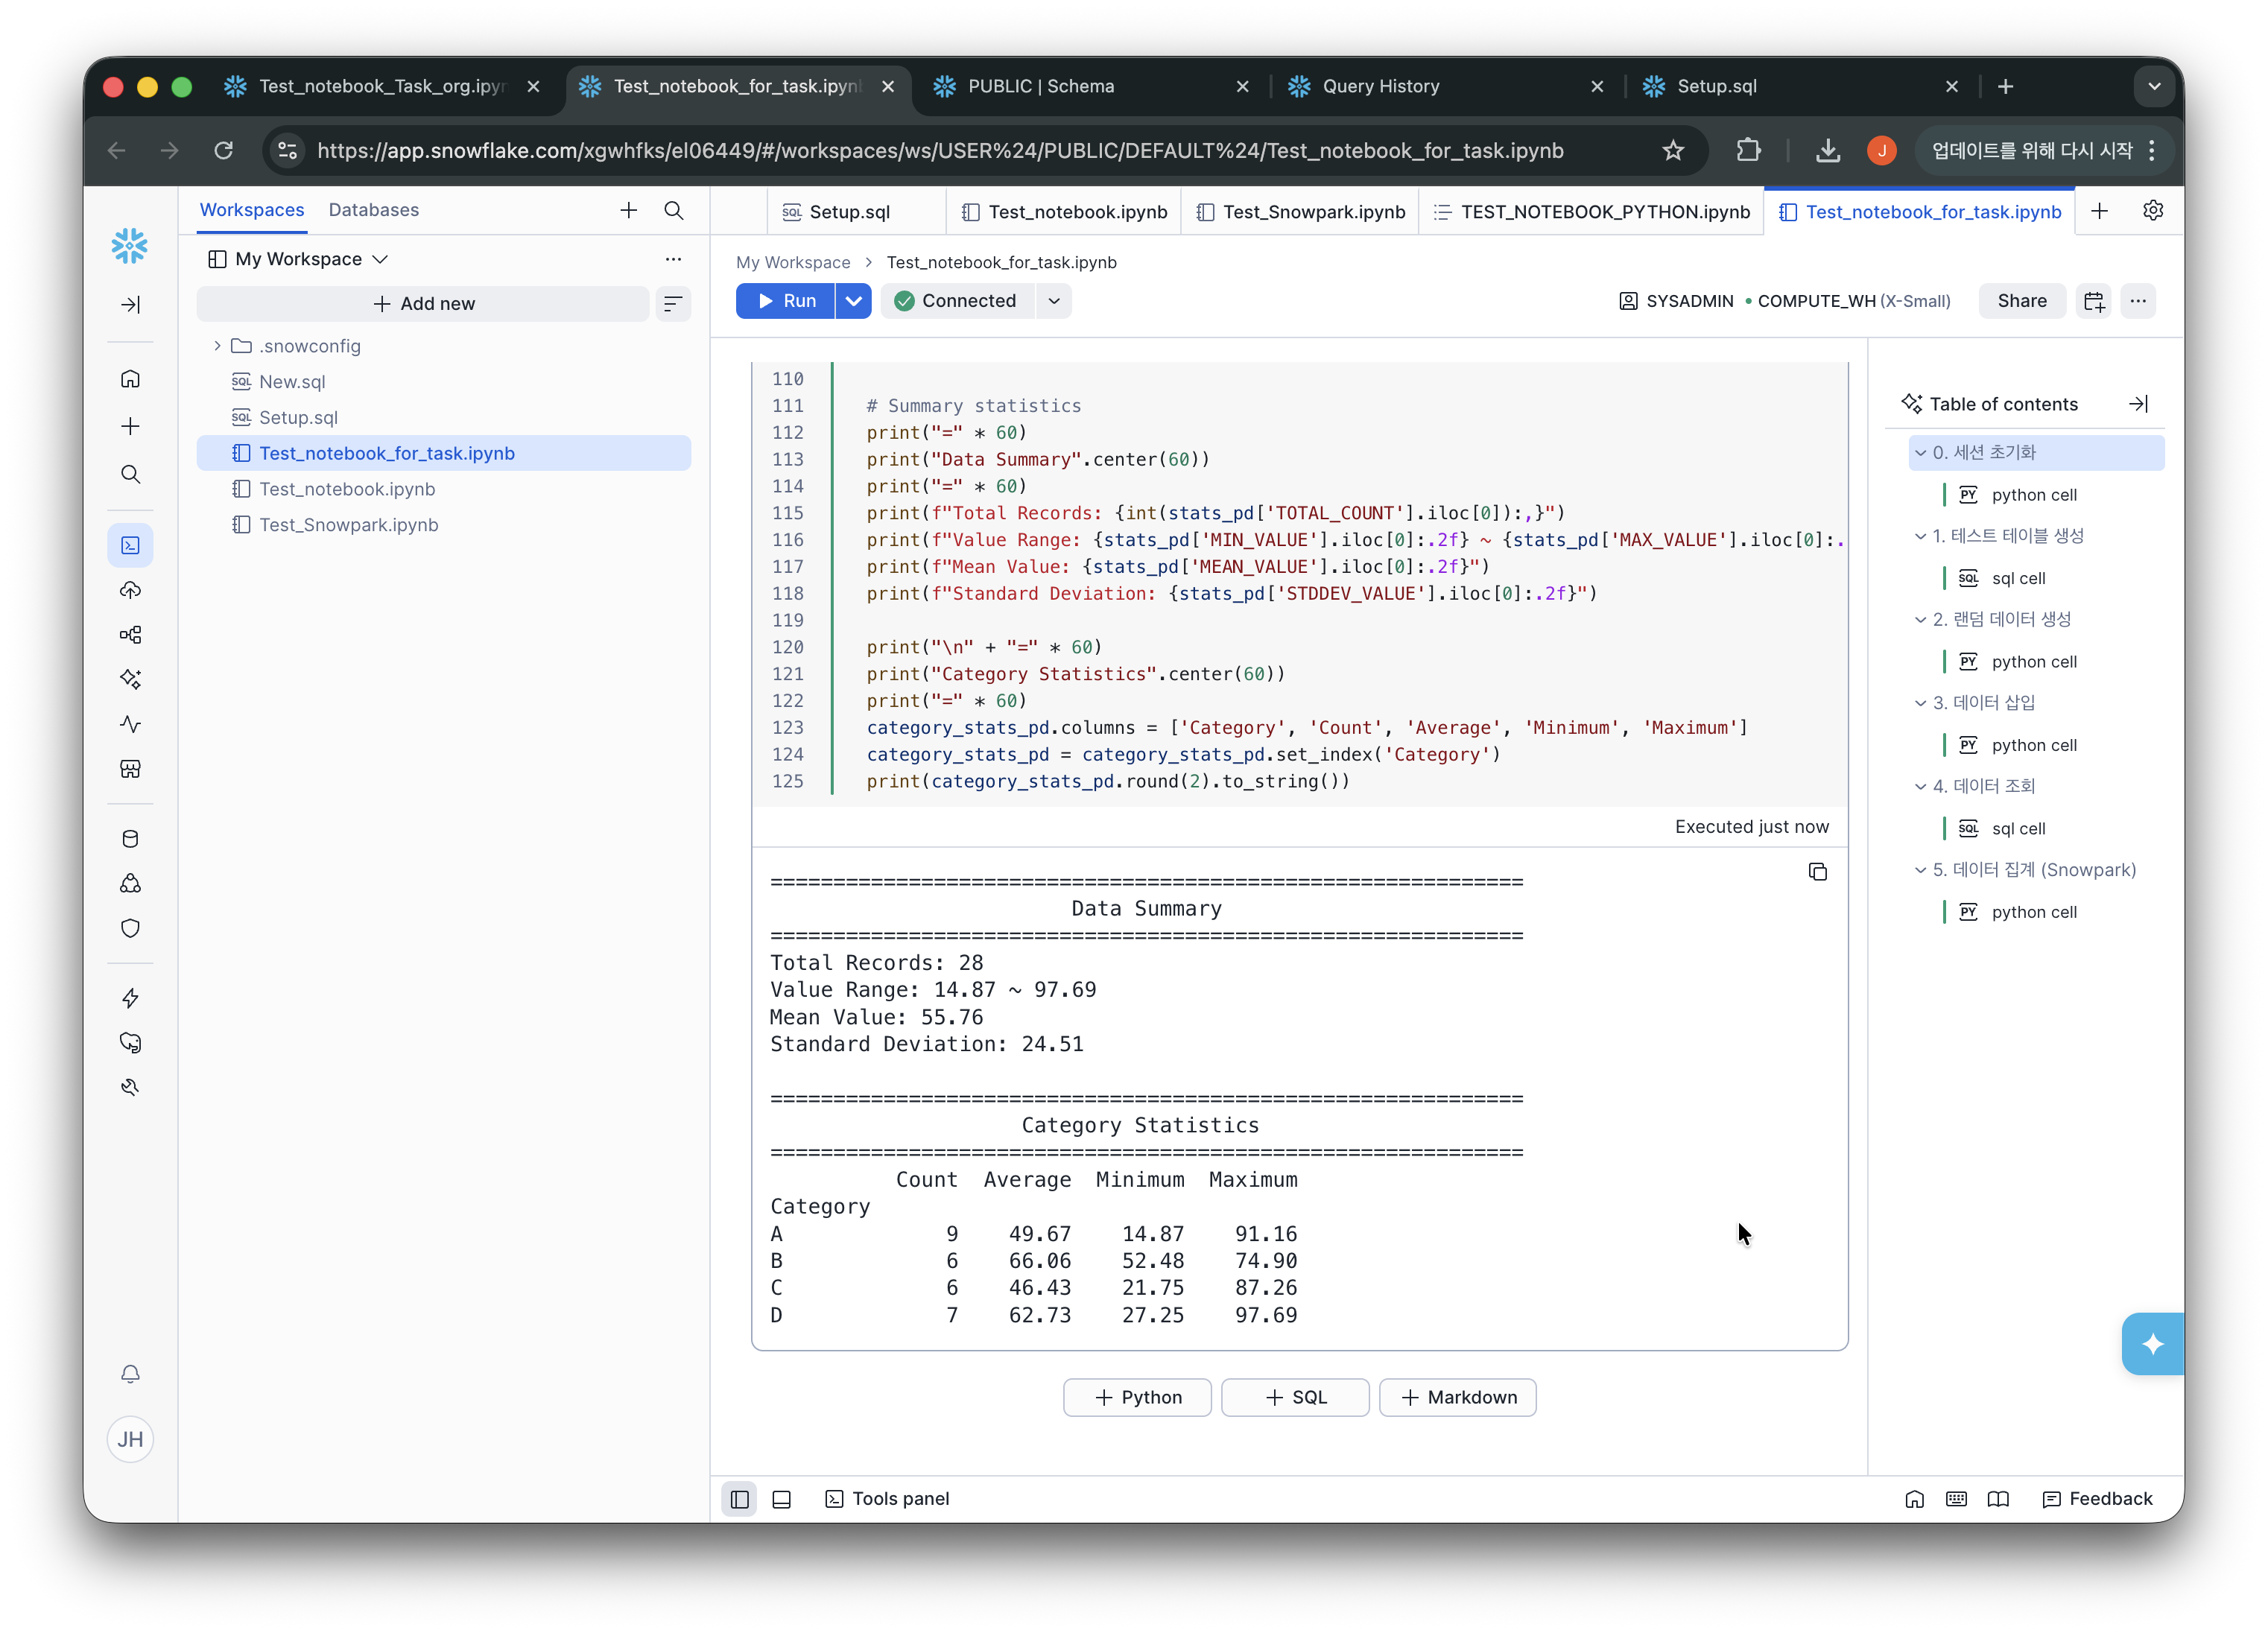
Python셀 P2를 보면 이전에 to_pandas DataFrame을 사용하던 소스를 변경하여 Snowpark DataFrame으로 변경되어 있음을 확인할 수 있습니다.
%matplotlib inline import matplotlib.pyplot as plt import seaborn as sns from snowflake.snowpark.functions import col, count, avg, min as sp_min, max as sp_max, stddev # Snowpark DataFrame df_snowpark = session.table("TESTDB.PUBLIC.test_table").sort(col("TIMESTAMP").desc()) # Category aggregations df_category_counts = df_snowpark.group_by(col("CATEGORY")) \ .agg(count("*").alias("COUNT")) \ .sort(col("CATEGORY")) df_category_avg = df_snowpark.group_by(col("CATEGORY")) \ .agg(avg(col("VALUE")).alias("AVG_VALUE")) \ .sort(col("CATEGORY")) df_category_min = df_snowpark.group_by(col("CATEGORY")) \ .agg(sp_min(col("VALUE")).alias("MIN_VALUE")) \ .sort(col("CATEGORY")) df_category_max = df_snowpark.group_by(col("CATEGORY")) \ .agg(sp_max(col("VALUE")).alias("MAX_VALUE")) \ .sort(col("CATEGORY")) # Overall stats df_stats = df_snowpark.agg( count("*").alias("TOTAL_COUNT"), avg(col("VALUE")).alias("MEAN_VALUE"), sp_min(col("VALUE")).alias("MIN_VALUE"), sp_max(col("VALUE")).alias("MAX_VALUE"), stddev(col("VALUE")).alias("STDDEV_VALUE") ) df_category_stats = df_snowpark.group_by(col("CATEGORY")) \ .agg( count("*").alias("COUNT"), avg(col("VALUE")).alias("AVERAGE"), sp_min(col("VALUE")).alias("MINIMUM"), sp_max(col("VALUE")).alias("MAXIMUM") ) \ .sort(col("CATEGORY")) # Convert aggregated results to pandas category_counts_pd = df_category_counts.to_pandas() category_avg_pd = df_category_avg.to_pandas() category_min_pd = df_category_min.to_pandas() category_max_pd = df_category_max.to_pandas() stats_pd = df_stats.to_pandas() category_stats_pd = df_category_stats.to_pandas() # Visualization fig, axes = plt.subplots(2, 2, figsize=(16, 10)) fig.subplots_adjust(hspace=0.4, wspace=0.3) colors = sns.color_palette('Set2', max(len(category_counts_pd), 1)) if not category_counts_pd.empty: # 1. Count by Category bars1 = axes[0, 0].bar(category_counts_pd['CATEGORY'], category_counts_pd['COUNT'], color=colors, edgecolor='black', linewidth=2, width=0.6) for bar in bars1: height = bar.get_height() axes[0, 0].text(bar.get_x() + bar.get_width()/2., height, f'{int(height)}', ha='center', va='bottom', fontweight='bold', fontsize=11) axes[0, 0].set_xlabel('Category', fontsize=13, fontweight='bold') axes[0, 0].set_ylabel('Count', fontsize=13, fontweight='bold') axes[0, 0].set_title('Count by Category', fontsize=15, fontweight='bold', pad=20) axes[0, 0].grid(True, alpha=0.3, axis='y', linestyle='--') # 2. Average by Category bars2 = axes[0, 1].bar(category_avg_pd['CATEGORY'], category_avg_pd['AVG_VALUE'], color=colors, edgecolor='black', linewidth=2, width=0.6) for bar in bars2: height = bar.get_height() axes[0, 1].text(bar.get_x() + bar.get_width()/2., height, f'{height:.1f}', ha='center', va='bottom', fontweight='bold', fontsize=11) axes[0, 1].set_xlabel('Category', fontsize=13, fontweight='bold') axes[0, 1].set_ylabel('Average Value', fontsize=13, fontweight='bold') axes[0, 1].set_title('Average by Category', fontsize=15, fontweight='bold', pad=20) axes[0, 1].grid(True, alpha=0.3, axis='y', linestyle='--') # 3. Minimum by Category bars3 = axes[1, 0].bar(category_min_pd['CATEGORY'], category_min_pd['MIN_VALUE'], color=colors, edgecolor='black', linewidth=2, width=0.6) for bar in bars3: height = bar.get_height() axes[1, 0].text(bar.get_x() + bar.get_width()/2., height, f'{height:.1f}', ha='center', va='bottom', fontweight='bold', fontsize=11) axes[1, 0].set_xlabel('Category', fontsize=13, fontweight='bold') axes[1, 0].set_ylabel('Min Value', fontsize=13, fontweight='bold') axes[1, 0].set_title('Minimum by Category', fontsize=15, fontweight='bold', pad=20) axes[1, 0].grid(True, alpha=0.3, axis='y', linestyle='--') # 4. Maximum by Category bars4 = axes[1, 1].bar(category_max_pd['CATEGORY'], category_max_pd['MAX_VALUE'], color=colors, edgecolor='black', linewidth=2, width=0.6) for bar in bars4: height = bar.get_height() axes[1, 1].text(bar.get_x() + bar.get_width()/2., height, f'{height:.1f}', ha='center', va='bottom', fontweight='bold', fontsize=11) axes[1, 1].set_xlabel('Category', fontsize=13, fontweight='bold') axes[1, 1].set_ylabel('Max Value', fontsize=13, fontweight='bold') axes[1, 1].set_title('Maximum by Category', fontsize=15, fontweight='bold', pad=20) axes[1, 1].grid(True, alpha=0.3, axis='y', linestyle='--') display(fig) plt.close(fig) # Summary statistics print("=" * 60) print("Data Summary".center(60)) print("=" * 60) print(f"Total Records: {int(stats_pd['TOTAL_COUNT'].iloc[0]):,}") print(f"Value Range: {stats_pd['MIN_VALUE'].iloc[0]:.2f} ~ {stats_pd['MAX_VALUE'].iloc[0]:.2f}") print(f"Mean Value: {stats_pd['MEAN_VALUE'].iloc[0]:.2f}") print(f"Standard Deviation: {stats_pd['STDDEV_VALUE'].iloc[0]:.2f}") print("\n" + "=" * 60) print("Category Statistics".center(60)) print("=" * 60) category_stats_pd.columns = ['Category', 'Count', 'Average', 'Minimum', 'Maximum'] category_stats_pd = category_stats_pd.set_index('Category') print(category_stats_pd.round(2).to_string()) -
주요 변경 사항
- Snowpark 집계 함수 import
이전 셀에서 정의된 session 객체를 재사용하며, Snowpark 집계 연산에 필요한 함수를 import합니다. - 집계 연산을 Snowpark DataFrame으로 수행
- 기존: df.groupby('CATEGORY').size() (pandas — 데이터를 로컬로 가져온 후 처리)
- 변경: df_snowpark.group_by(col("CATEGORY")).agg(count("*").alias("COUNT")) (Snowpark — Snowflake 서버에서 직접 처리)
- 전체 통계 계산도 Snowpark로 수행
- count(), avg(), min(), max(), stddev() 함수를 Snowpark에서 직접 실행하여 연산을 Snowflake 서버에서 수행합니다.
- 시각화 시점에만 pandas 변환
- 집계된 소량의 결과 데이터만 to_pandas()로 변환하여 matplotlib/seaborn 시각화에 사용합니다. 원본 데이터 전체를 로컬로 가져오지 않습니다.
- Workspace Notebook 호환 시각화 처리
- %matplotlib inline 추가 — Notebook 셀 내 인라인 차트 렌더링 활성화
- plt.show() → display(fig) + plt.close(fig) 로 변경 — Container Runtime 환경에서 차트가 정상 출력되도록 처리
- Snowpark 집계 함수 import
-
장점
- 서버사이드 처리: 대용량 데이터도 Snowflake에서 집계 후 결과만 가져옴
- 메모리 효율: 원본 데이터 전체를 pandas로 변환하지 않음
- 확장성: 데이터 크기가 커져도 동일한 성능 유지
스케줄링 실행
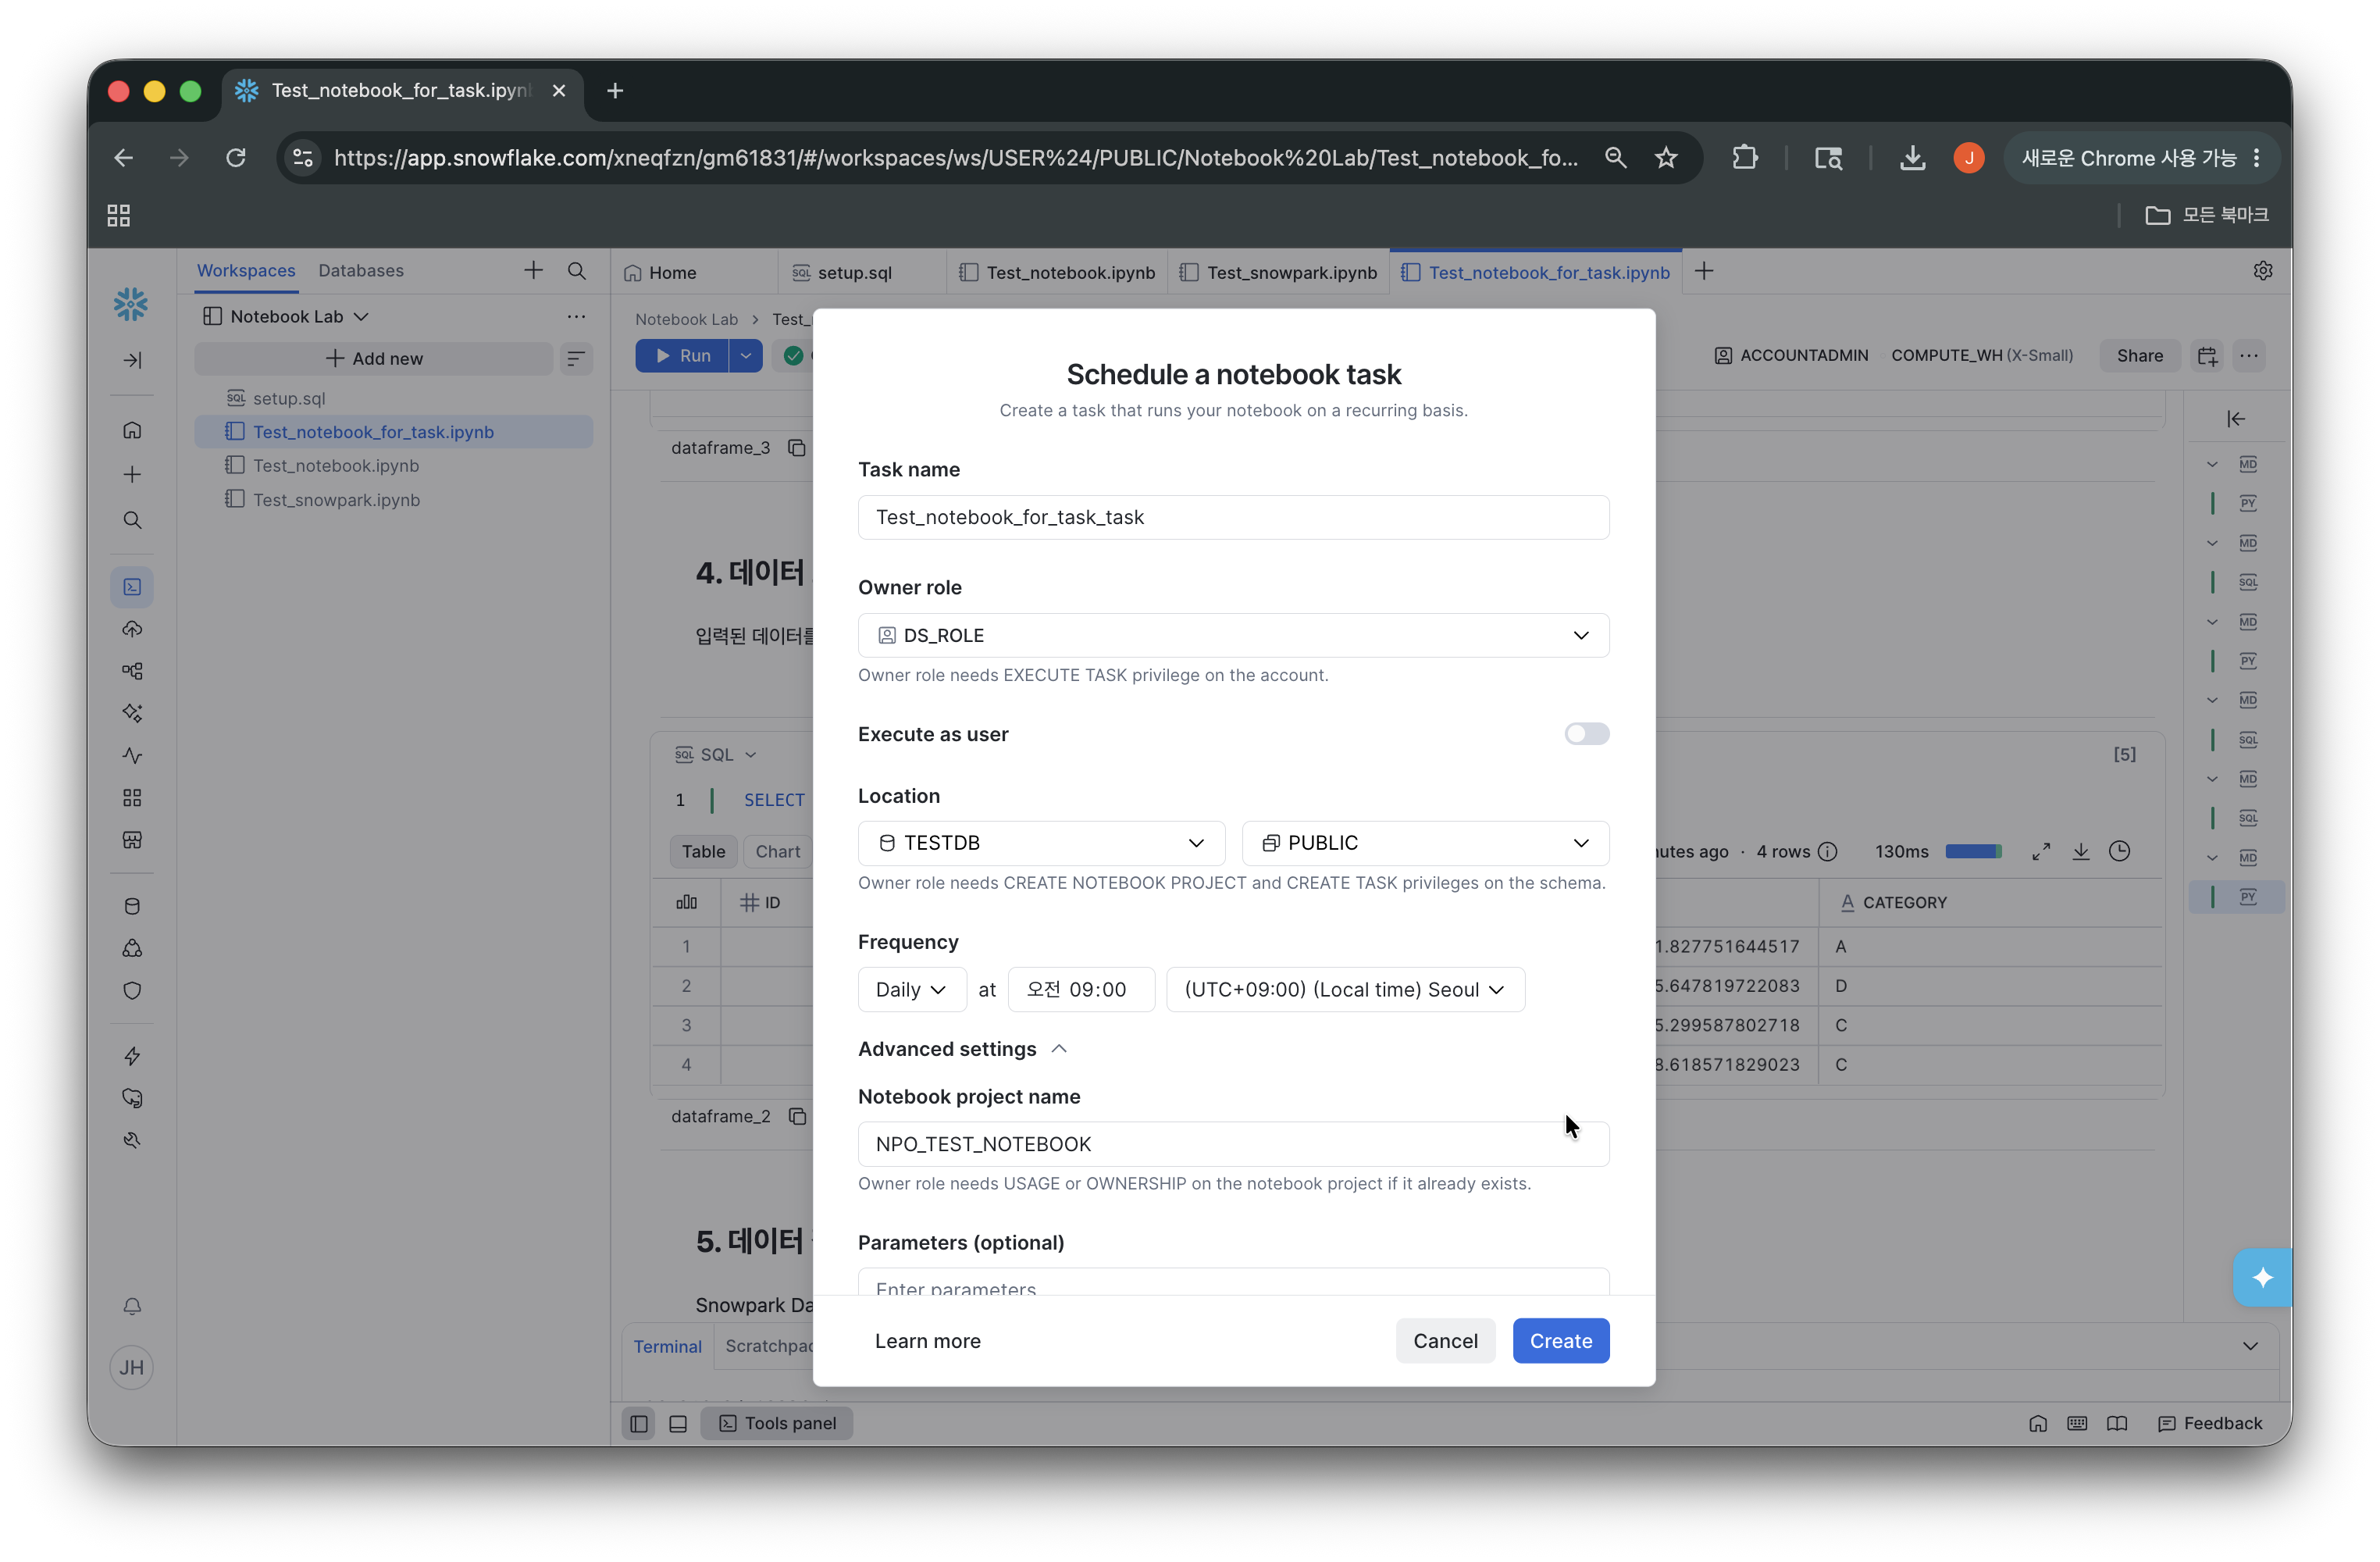
1. 스케줄 생성
- 노트북 오른쪽 상단에서 달력 아이콘을 클릭하여
Scheduled run을 설정합니다- Task Name : 임의의 이름 (예,
Test_notebook_for_task) - Owner Role :
DS_ROLE - Location
- Database :
TESTDB - Schema :
PUBLIC
- Database :
- Frequency :
Daily at 오전 09:00 - Advanced Settings
- Notebook Project Name : 임의의 이름 (예,
NPO_TEST_NOTEBOOK) - Compute Pool :
DS_NOTEBOOK_POOL - Query Warehouse :
COMPUTE_WH - Artifact repositories :
SNOWFLAKE.SNOWPARK.PYPI_SHARED_REPOSITORY
- Notebook Project Name : 임의의 이름 (예,
- Task Name : 임의의 이름 (예,
2. 실행 결과 확인
- 노트북 오른쪽 상단 달력 아이콘에서
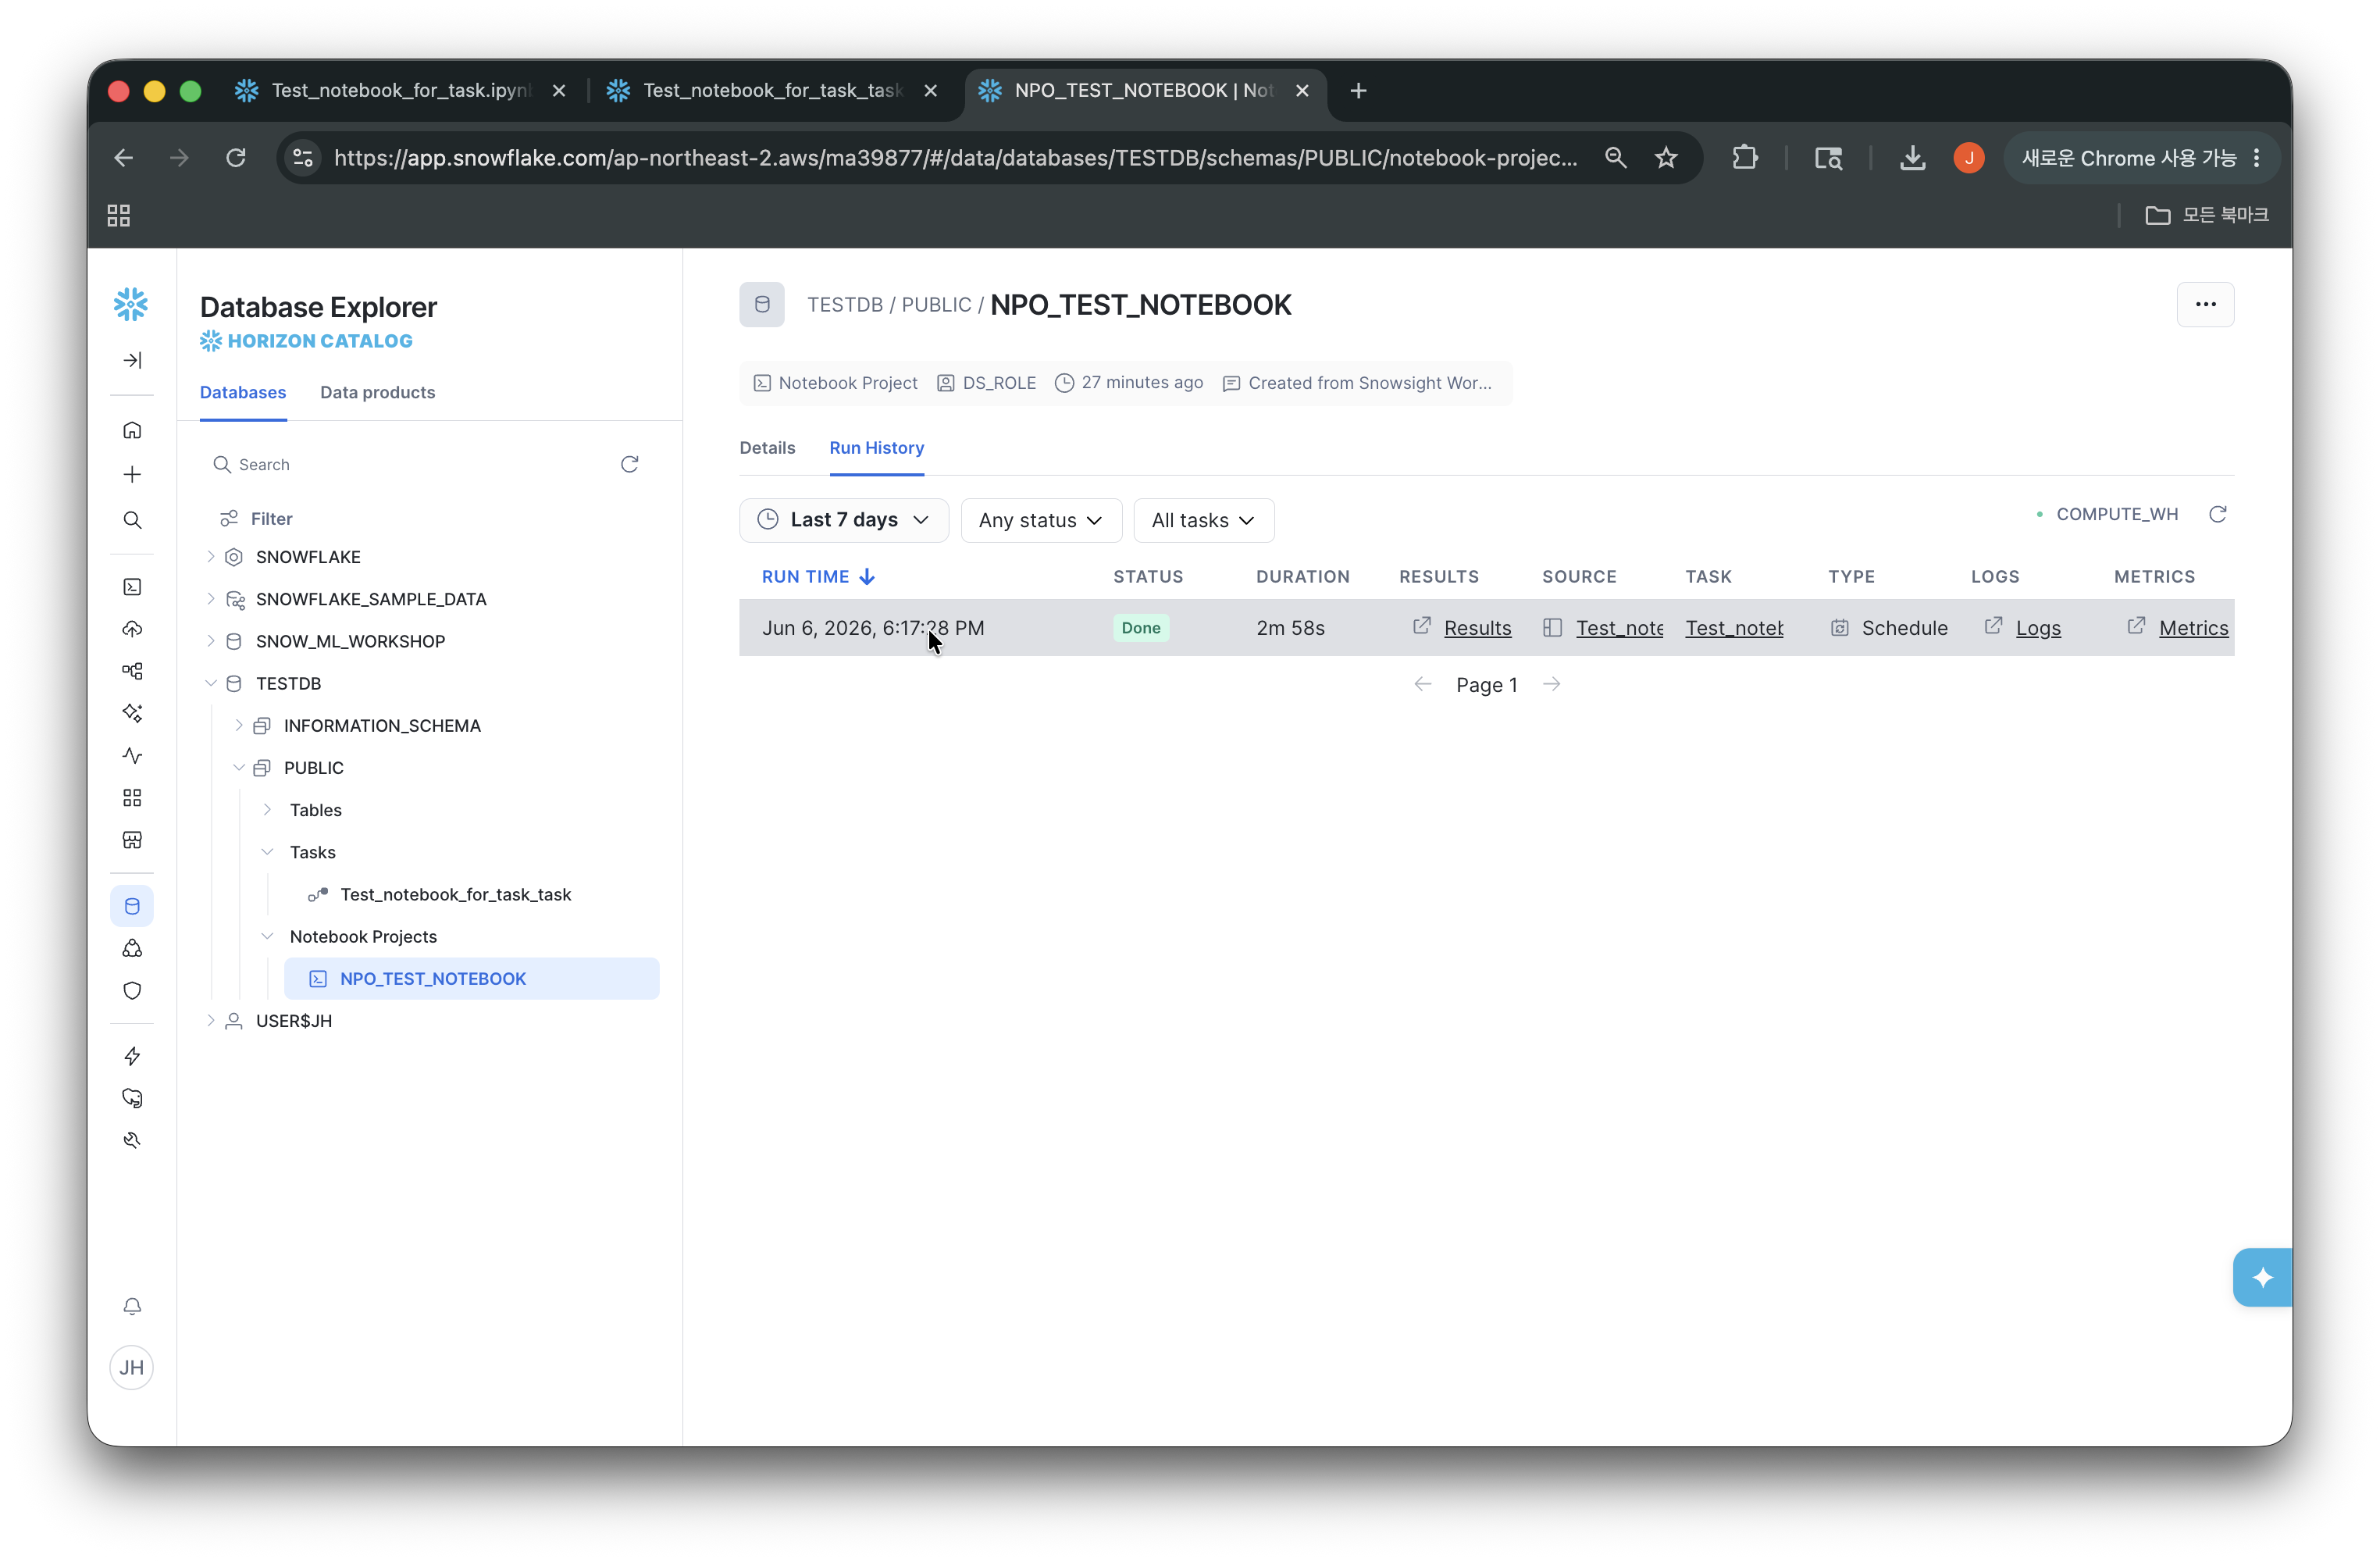
...을 선택해Run now를 클릭하면 스케줄 시간이 되기 전에 즉시에 실행됩니다 - 노트북 오른쪽 상단에서 달력 아이콘을 선택하여
Open run history버튼을 클릭합니다
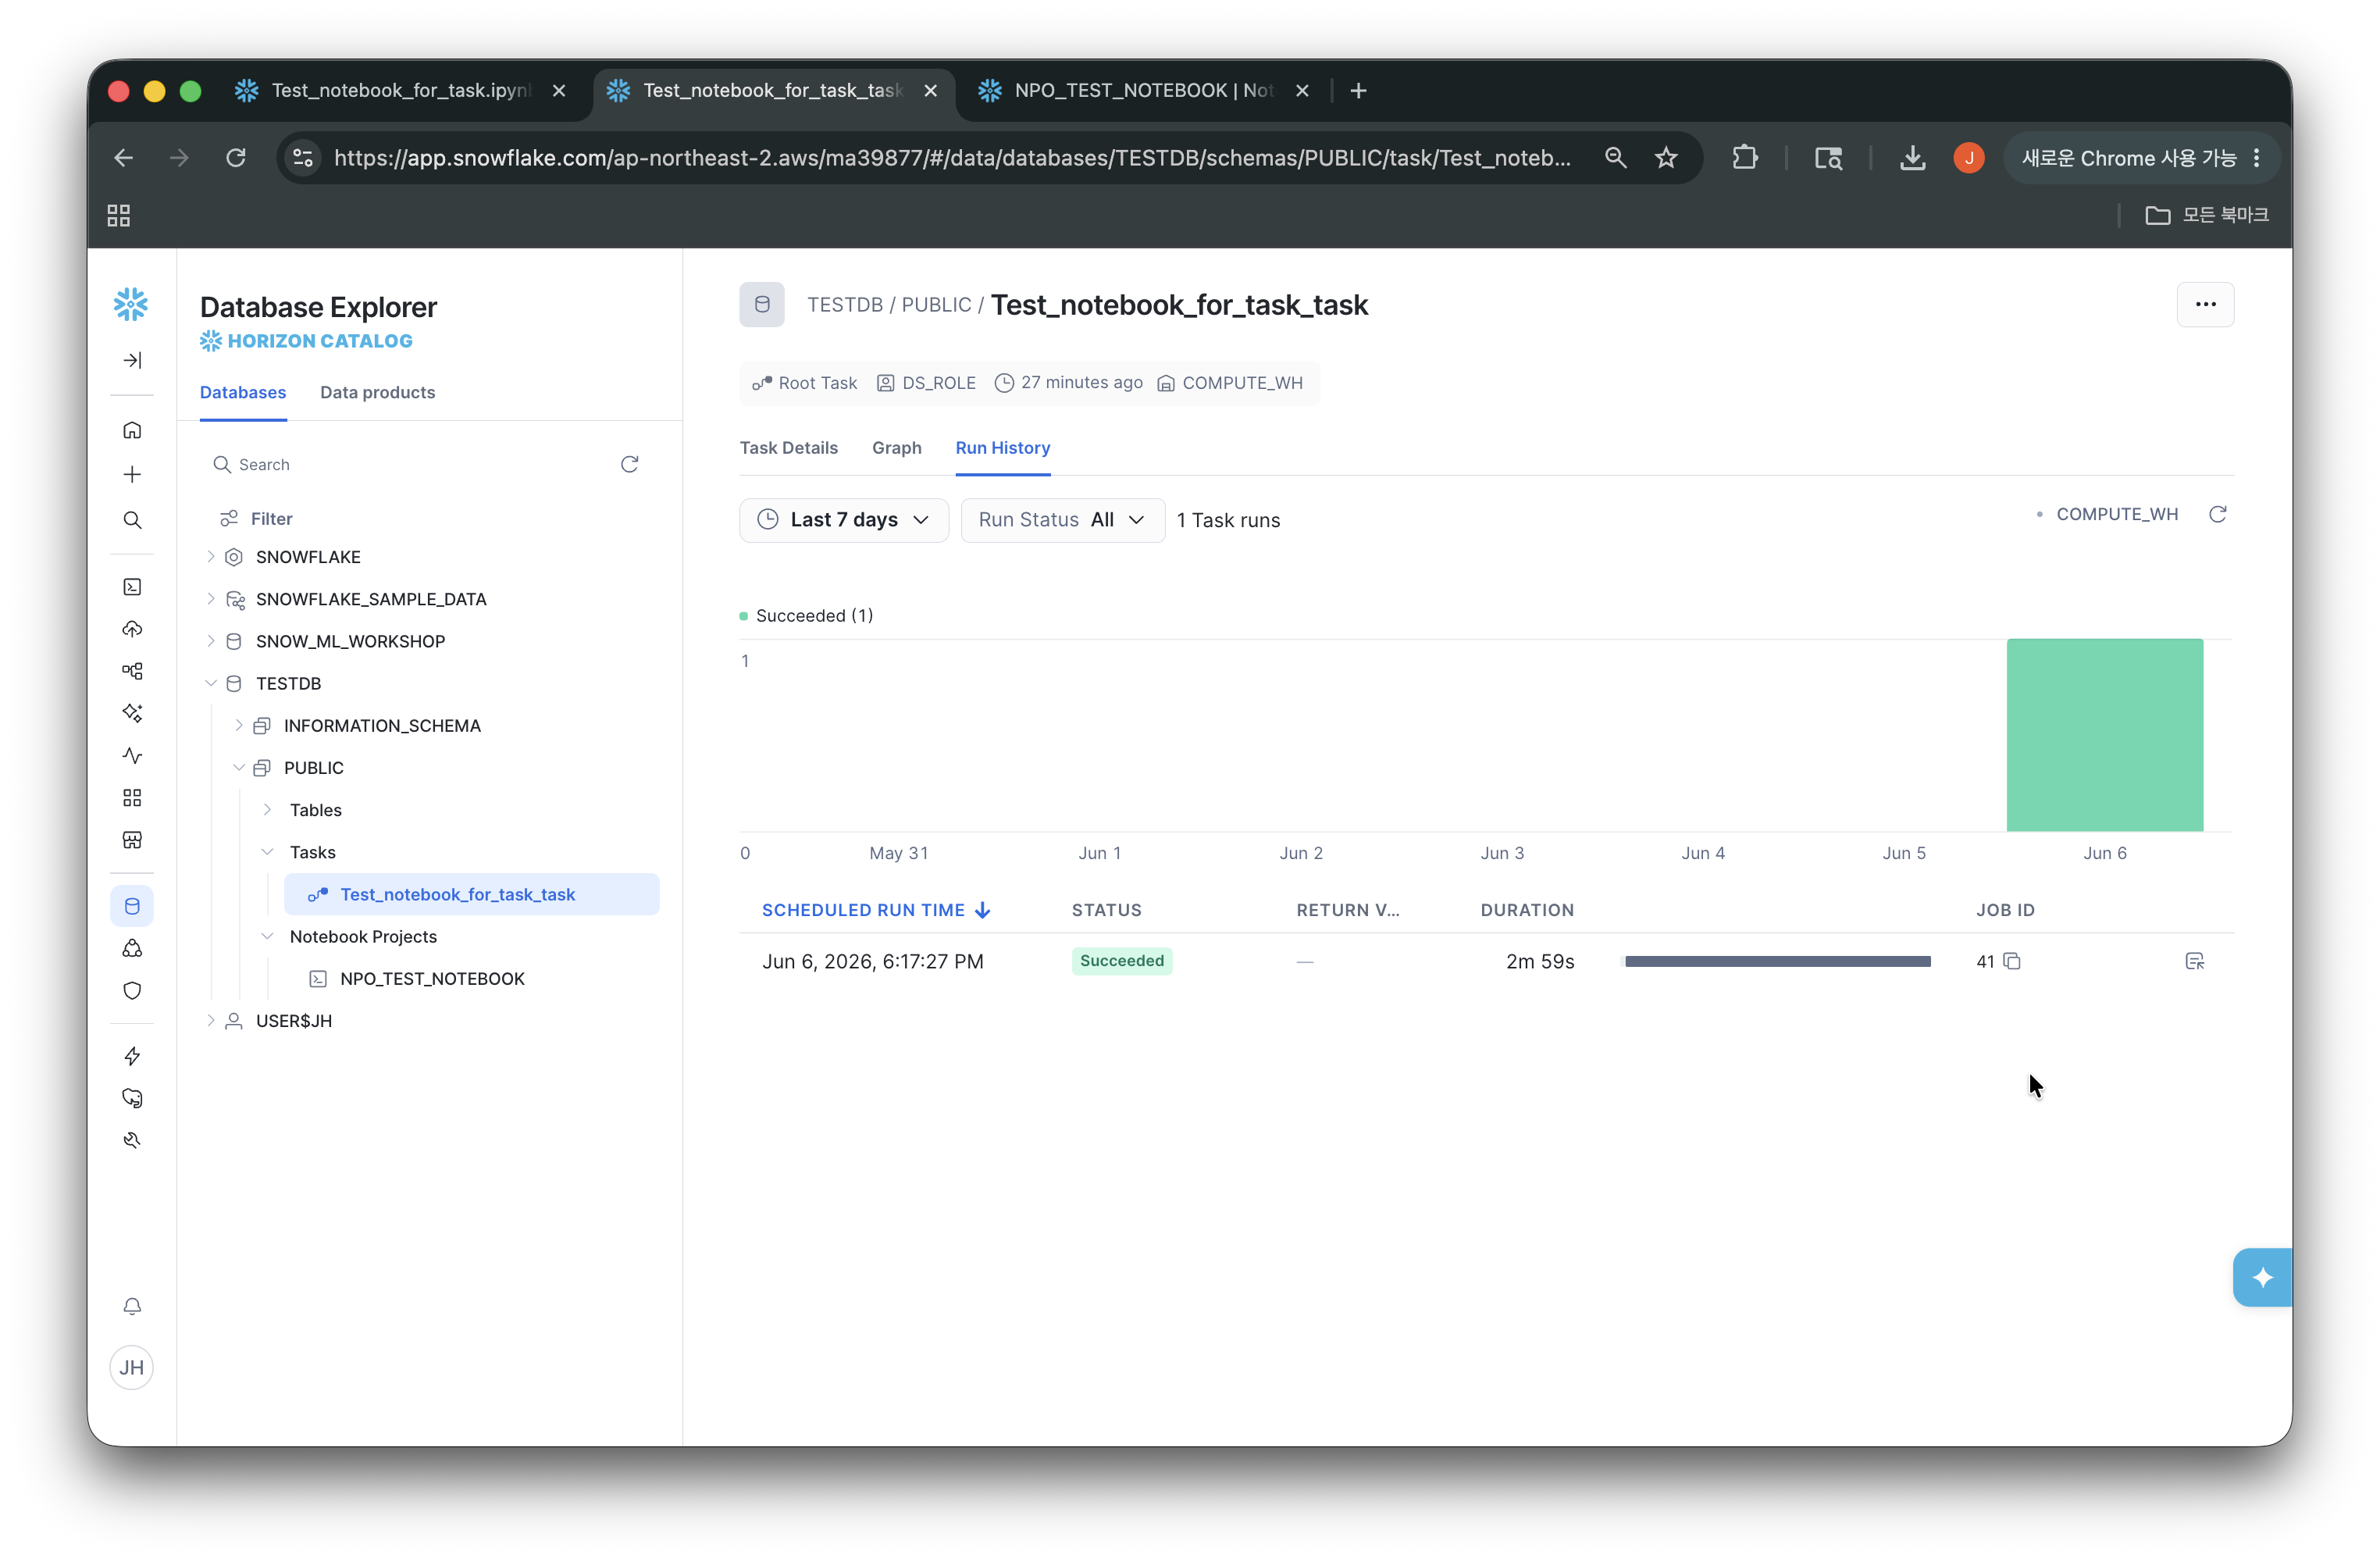
- Task 링크를 클릭하여 Task 의 Run History도 확인할 수 있습니다
Github에서 Notebook 생성
본 실습에서는 인증 과정이 필요없는 Public Repository에 대해서만 진행합니다
1. 사전 준비 사항
- Public GitHub Repository URL (HTTPS 형식)
- 적절한 권한을 가진 Snowflake 역할 (ACCOUNTADMIN 또는 관련 권한)
- Projects > Workspaces 메뉴로 이동합니다
+ Add new를 클릭하고 새 SQL 파일을 생성합니다 (예, git.sql)
2. API Integration 생성
- Public repository용 API Integration을 생성합니다:
-- 데이터베이스와 스키마 사용
USE ROLE ACCOUNTADMIN ;
USE DATABASE testdb;
USE SCHEMA public;

-- API Integration 생성 (Public Repository용)
CREATE OR REPLACE API INTEGRATION my_git_api_integration
  API_PROVIDER = git_https_api
  API_ALLOWED_PREFIXES = ('https://github.com/HongJongHyun')
  ENABLED = TRUE;
3. 권한 부여
- DS_ROLE에게 필요한 권한을 부여합니다:
-- 역할 사용 및 권한 부여
GRANT CREATE GIT REPOSITORY ON SCHEMA testdb.public TO ROLE DS_ROLE;
GRANT USAGE ON INTEGRATION my_git_api_integration TO ROLE DS_ROLE;
4. Git Repository 생성
- Git Repository를 Snowflake에 생성합니다
-- Git Repository 생성
USE ROLE DS_ROLE;
CREATE OR REPLACE GIT REPOSITORY Snowflake_healthcheck_repository
  API_INTEGRATION = my_git_api_integration
  ORIGIN = 'https://github.com/HongJongHyun/snowflake_healthcheck_notebook';
5. Notebook 파일 생성
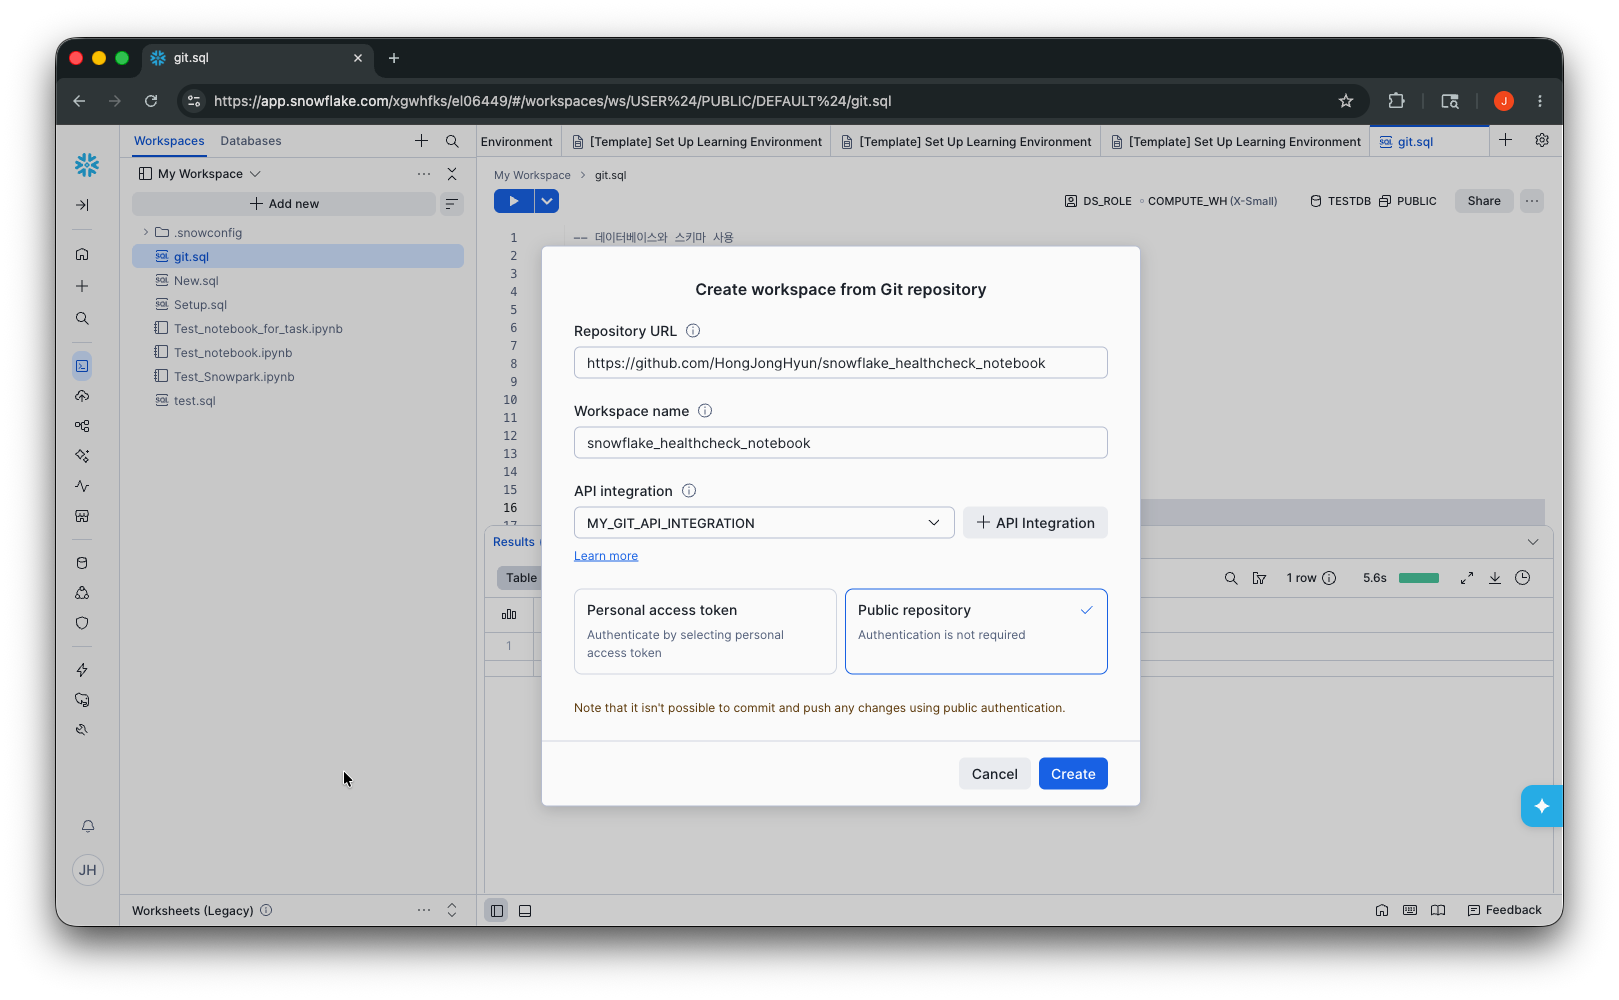
- Projects > Workspaces 메뉴의 상단 Workspaces, Databases 탭 옆에
+버튼을 클릭합니다 - Git workspace를 선택합니다
- Repository URL :
https://github.com/HongJongHyun/snowflake_healthcheck_notebook - Workspace name :
snowflake_healthcheck_notebook - API integration :
MY_GIT_API_INTEGRATION - Public repository 선택
Create클릭
- Repository URL :
- snowflake_healthcheck_notebook Workspace가 생성되고 git repository에 있는 모든 파일이 리스트됩니다
- 노트북 실행 테스트
- healthcheck_workspace_notebook_converted.ipynb를 선택합니다
- 이전 실습에 사용한 노트북 서비스에 Connect합니다
- 상단의
Run버튼을 클릭해 노트북을 실행합니다
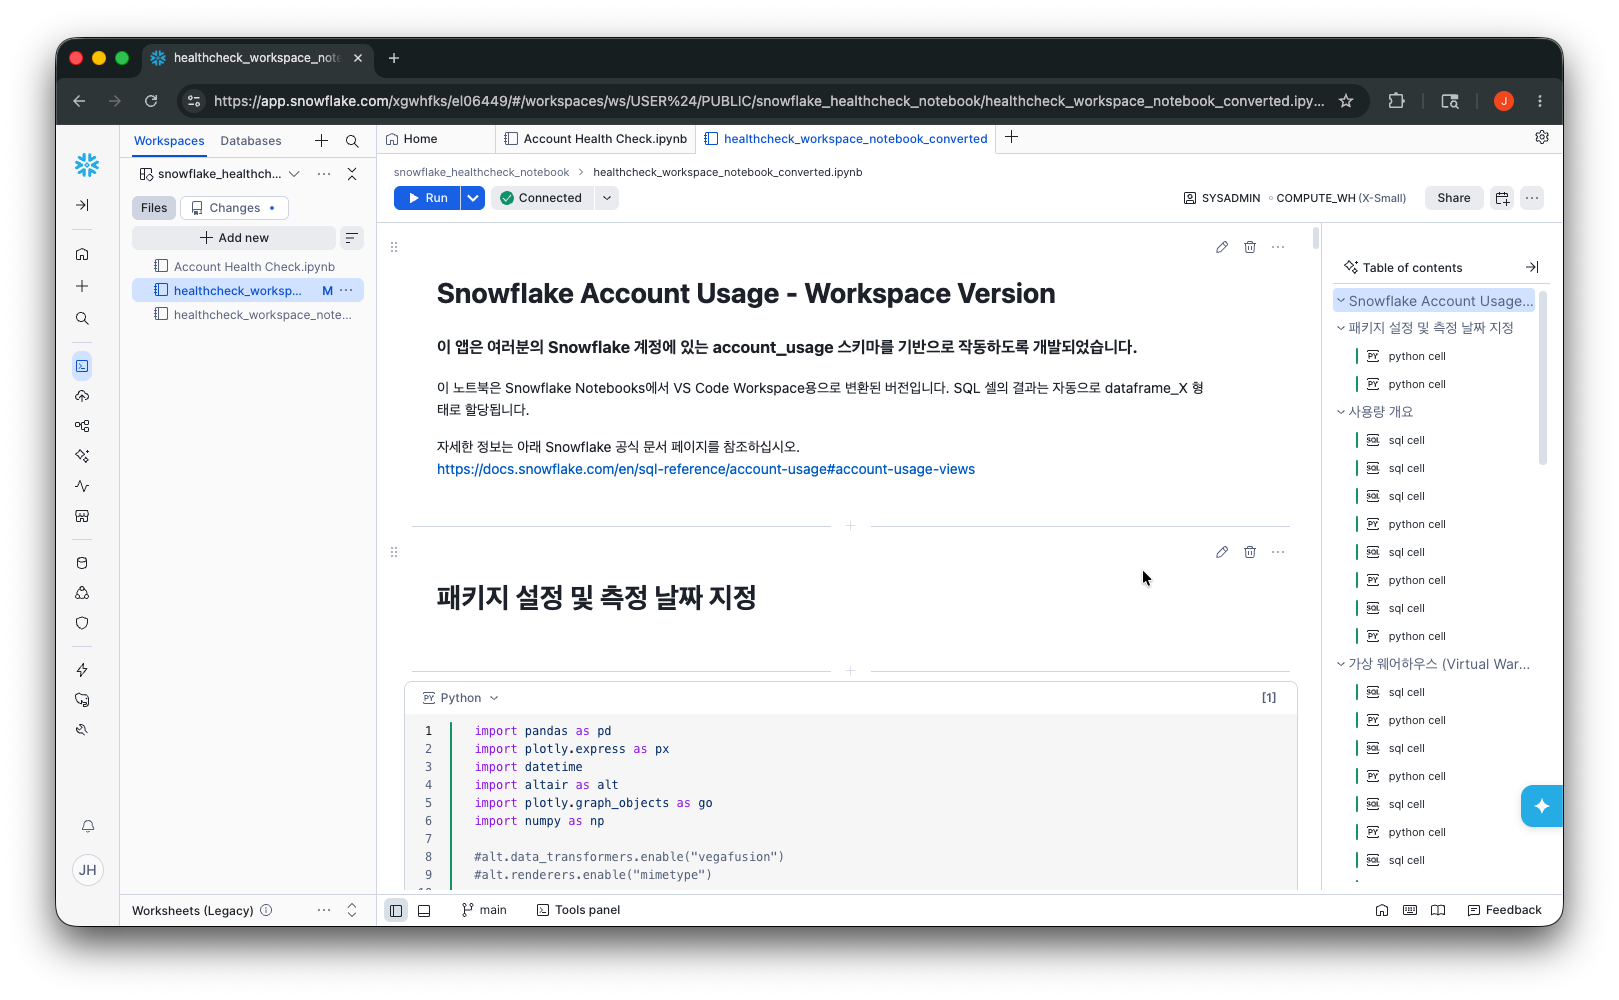
- Workspace 이름 아래
Changes버튼을 클릭하면 Git에서 새로 데이터를 가져오거나(Pull) Snowsight에서 변경한 내용을 반영(Push)할 수 있습니다- 현재 실습에서 사용한 Git 연결은 public repository 인데 이 경우는 Pull 기능한 활성화 됩니다

Snowflake Korea SE