개인공부 후 autoscaling 적용
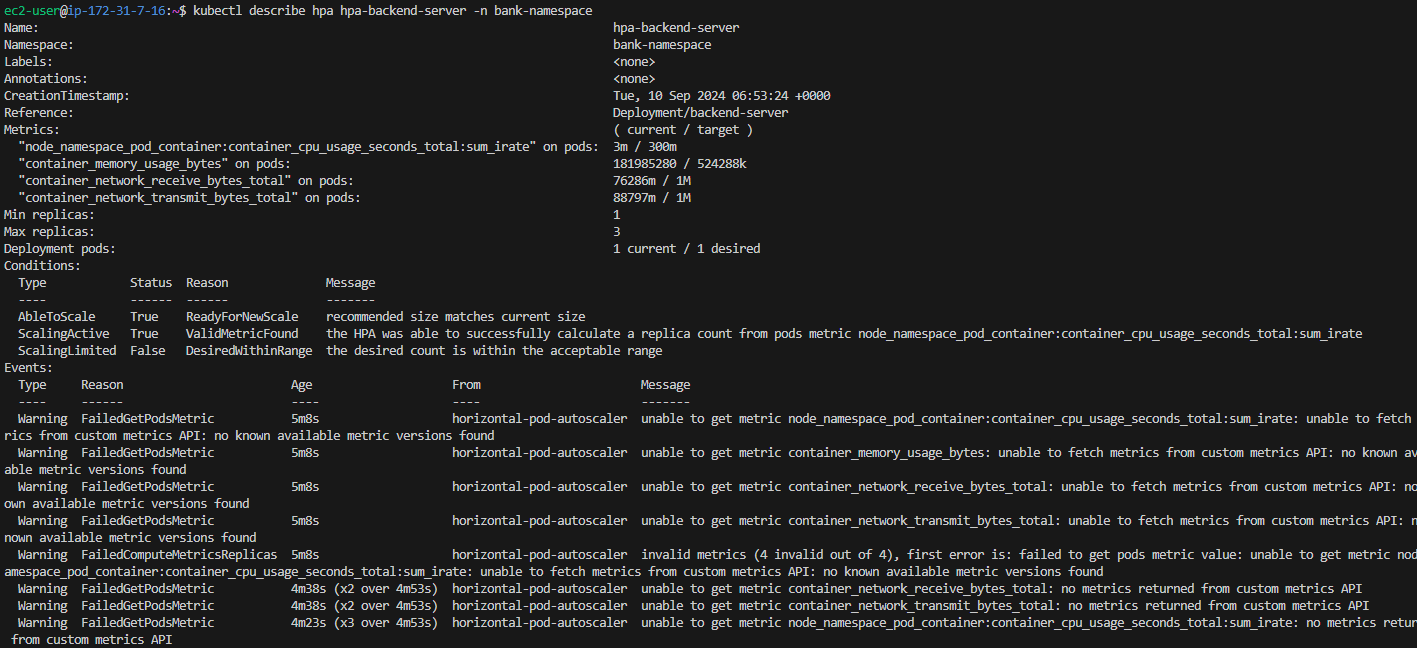
Prometheus가 메트릭을 인식하지 못하고 unknown으로 출력하는 오류
  "container_memory_usage_bytes" on pods:                                              <unknown> / 524288k
  "container_network_receive_bytes_total" on pods:                                     <unknown> / 1M
  "container_network_transmit_bytes_total" on pods:                                    <unknown> / 1M
  "http_requests_total" on pods:                                                       <unknown> / 1k
  "http_request_duration_seconds" on pods:                                             <unknown> / 500m
Warning FailedGetPodsMetric 89s (x3 over 119s) horizontal-pod-autoscaler unable to get metric node_namespace_pod_container:container_cpu_usage_seconds_total:sum_irate: no metrics returned from custom metrics API
Warning FailedGetPodsMetric 89s (x3 over 119s) horizontal-pod-autoscaler unable to get metric http_request_duration_seconds: unable to fetch metrics from custom metrics API: the server could not find the metric http_request_duration_seconds for pods
Warning FailedComputeMetricsReplicas 89s (x3 over 119s) horizontal-pod-autoscaler invalid metrics (6 invalid out of 6), first error is: failed to get pods metric value: unable to get metric node_namespace_pod_container:container_cpu_usage_seconds_total:sum_irate: no metrics returned from custom metrics API
Warning FailedGetPodsMetric 74s (x4 over 119s) horizontal-pod-autoscaler unable to get metric container_memory_usage_bytes: unable to fetch metrics from custom metrics API: the server could not find the metric container_memory_usage_bytes for pods
Warning FailedGetPodsMetric 74s (x4 over 119s) horizontal-pod-autoscaler unable to get metric container_network_receive_bytes_total: unable to fetch metrics from custom metrics API: the server could not find the metric container_network_receive_bytes_total for pods
Warning FailedGetPodsMetric 74s (x4 over 119s) horizontal-pod-autoscaler unable to get metric container_network_transmit_bytes_total: unable to fetch metrics from custom metrics API: the server could not find the metric container_network_transmit_bytes_total for pods
Warning FailedGetPodsMetric 74s (x4 over 119s) horizontal-pod-autoscaler unable to get metric http_requests_total: unable to fetch metrics from custom metrics API: the server could not find the metric http_requests_total for podsPrometheus에서 기본적으로 제공하지 않는 사용자가 임의로 설정한 custom metric(http_request_total, http_request_duration_seconds)을 빼고 Prometheus에서 기본적으로 제공하는 metric(Prometheus UI에서 쿼리 가능)만 HPA yaml 파일에 적용시켜보았지만 같은 오류가 떴다
# hpa.yaml

apiVersion: autoscaling/v2
kind: HorizontalPodAutoscaler
metadata:
  name: hpa-frontend-server
  namespace: bank-namespace
spec:
  scaleTargetRef:
    apiVersion: apps/v1
    kind: Deployment
    name: frontend-server
  minReplicas: 1
  maxReplicas: 3
  metrics:
    - type: Pods
      pods:
        metric:
          name: node_namespace_pod_container:container_cpu_usage_seconds_total:sum_irate
        target:
          type: AverageValue
          averageValue: 0.3
    - type: Pods
      pods:
        metric:
          name: container_memory_usage_bytes
        target:
          type: AverageValue
          averageValue: 524288000
    - type: Pods
      pods:
        metric:
          name: container_network_receive_bytes_total
        target:
          type: AverageValue
          averageValue: 1000000
    - type: Pods
      pods:
        metric:
          name: container_network_transmit_bytes_total
        target:
          type: AverageValue
          averageValue: 1000000
원인은 Prometheus에서 기본적으로 제공하는 metric이라 하더라도 HPA에 정의되어있지 않아 HPA가 metric 수집을 하지 못하기 때문
HPA에 정의하기 위해 kubectl edit configmap prometheus-adapter -n <prometheus-adapter namespace>
ConfigMap.yaml에
apiVersion: v1
data:
  config.yaml: |
    rules:
    - seriesQuery: '{__name__=~"^container_.*",container!="POD",namespace!="",pod!=""}'
      seriesFilters: []
      resources:
        overrides:
          namespace:
            resource: namespace
          pod:
            resource: pod
      name:
        matches: ^container_(.*)_seconds_total$
        as: ""
      metricsQuery: sum(rate(<<.Series>>{<<.LabelMatchers>>,container!="POD"}[5m]))
        by (<<.GroupBy>>)
    - seriesQuery: '{__name__=~"^container_.*",container!="POD",namespace!="",pod!=""}'
      seriesFilters:
      - isNot: ^container_.*_seconds_total$
      resources:
        overrides:
          namespace:
            resource: namespace
          pod:
            resource: pod
      name:
        matches: ^container_(.*)_total$
        as: ""
      metricsQuery: sum(rate(<<.Series>>{<<.LabelMatchers>>,container!="POD"}[5m]))
        by (<<.GroupBy>>)
    - seriesQuery: '{__name__=~"^container_.*",container!="POD",namespace!="",pod!=""}'
      seriesFilters:
      - isNot: ^container_.*_total$
      resources:
        overrides:
          namespace:
            resource: namespace
          pod:
            resource: pod
      name:
        matches: ^container_(.*)$
        as: ""
      metricsQuery: sum(<<.Series>>{<<.LabelMatchers>>,container!="POD"}) by (<<.GroupBy>>)
    - seriesQuery: '{namespace!="",__name__!~"^container_.*"}'
      seriesFilters:
      - isNot: .*_total$
      resources:
        template: <<.Resource>>
      name:
        matches: ""
        as: ""
      metricsQuery: sum(<<.Series>>{<<.LabelMatchers>>}) by (<<.GroupBy>>)
    - seriesQuery: '{namespace!="",__name__!~"^container_.*"}'
      seriesFilters:
      - isNot: .*_seconds_total
      resources:
        template: <<.Resource>>
      name:
        matches: ^(.*)_total$
        as: ""
      metricsQuery: sum(rate(<<.Series>>{<<.LabelMatchers>>}[5m])) by (<<.GroupBy>>)
    - seriesQuery: '{namespace!="",__name__!~"^container_.*"}'
      seriesFilters: []
      resources:
        template: <<.Resource>>
      name:
        matches: ^(.*)_seconds_total$
        as: ""
      metricsQuery: sum(rate(<<.Series>>{<<.LabelMatchers>>}[5m])) by (<<.GroupBy>>)

    - seriesQuery: '{__name__="container_memory_usage_bytes",namespace!="",pod!=""}'
      resources:
        overrides:
          namespace:
            resource: namespace
          pod:
            resource: pod
      name:
        matches: ^container_memory_usage_bytes$
        as: ""
      metricsQuery: sum(<<.Series>>{<<.LabelMatchers>>}) by (<<.GroupBy>>)

    - seriesQuery: '{__name__="container_network_transmit_bytes_total",namespace!="",pod!=""}'
      resources:
        overrides:
          namespace:
            resource: namespace
          pod:
            resource: pod
      name:
        matches: ^container_network_transmit_bytes_total$
        as: ""
      metricsQuery: sum(rate(<<.Series>>{<<.LabelMatchers>>}[5m])) by (<<.GroupBy>>)

    - seriesQuery: '{__name__="container_network_receive_bytes_total",namespace!="",pod!=""}'
      resources:
        overrides:
          namespace:
            resource: namespace
          pod:
            resource: pod
      name:
        matches: ^container_network_receive_bytes_total$
        as: ""
      metricsQuery: sum(rate(<<.Series>>{<<.LabelMatchers>>}[5m])) by (<<.GroupBy>>)
kind: ConfigMap
metadata:
  annotations:
    meta.helm.sh/release-name: prometheus-adapter
    meta.helm.sh/release-namespace: my-monitoring
  creationTimestamp: "2024-09-10T01:53:05Z"
  labels:
    app.kubernetes.io/component: metrics
    app.kubernetes.io/instance: prometheus-adapter
    app.kubernetes.io/managed-by: Helm
    app.kubernetes.io/name: prometheus-adapter
    app.kubernetes.io/part-of: prometheus-adapter
    app.kubernetes.io/version: v0.12.0
    helm.sh/chart: prometheus-adapter-4.11.0
  name: prometheus-adapter
  namespace: my-monitoring
  resourceVersion: "306939"
  uid: 45b6bfd9-9a9d-4364-b7f1-701b8cfa1262
metric과 관련된 쿼리 정의 후 pod를 재실행
kubectl delete pod <prometheus-adapter-pod-name> -n <prometheus-adapter namespace>
재실행 후 autoscaling이 잘 적용됐는지 확인
kubectl describe hpa <your-hpa-name>