
✏️ 성능평가
"회귀"보다 평가 항목이 많은 편
- 분류 모델 성능 평가 지표(Accuracy, Precision, Recall, F1 score 등)
- Confusion Matrix(혼동 행렬, 오차 행렬) / Accuracy(정확도) / Precision(정밀도) 등등
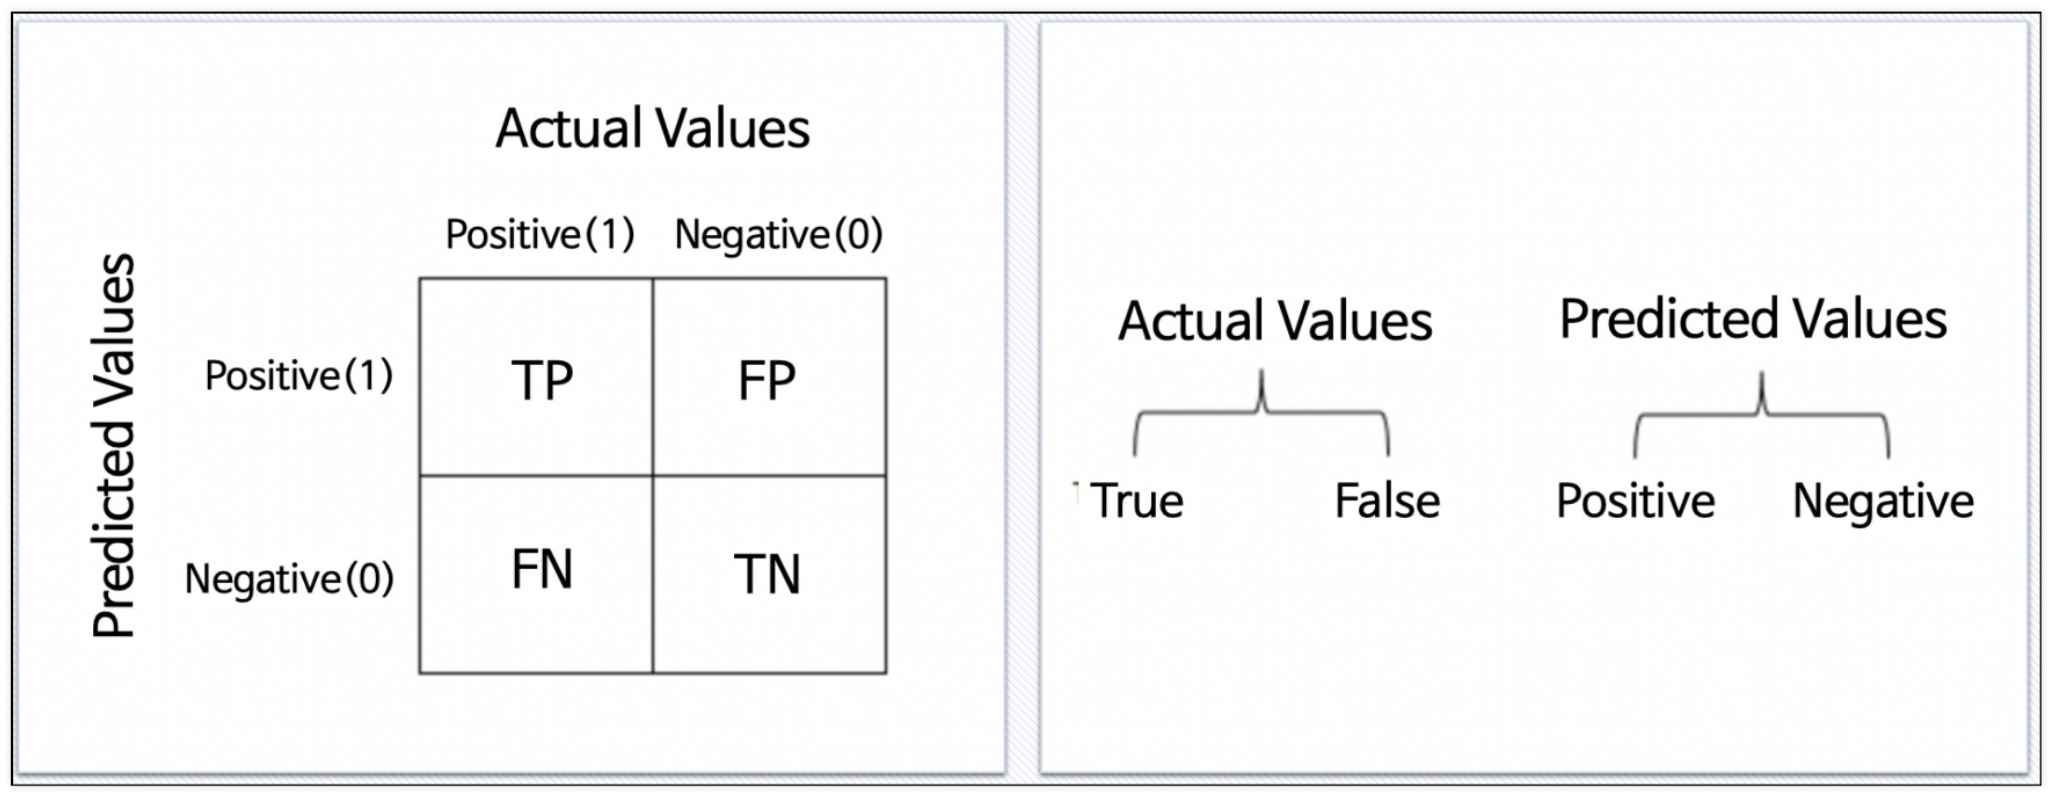
💡 Confusion Matrix(혼동 행렬, 오차 행렬)
-
Predicted Values (예측)
- P(Positive): 모델이 positive라고 예측 (1)
- N(Negative): 모델이 negative라고 예측 (0)
-
Actual values (실제)
- T(True): 예측한 것이 정답 (1)
- F(False): 예측한 것이 오답 (0)
-
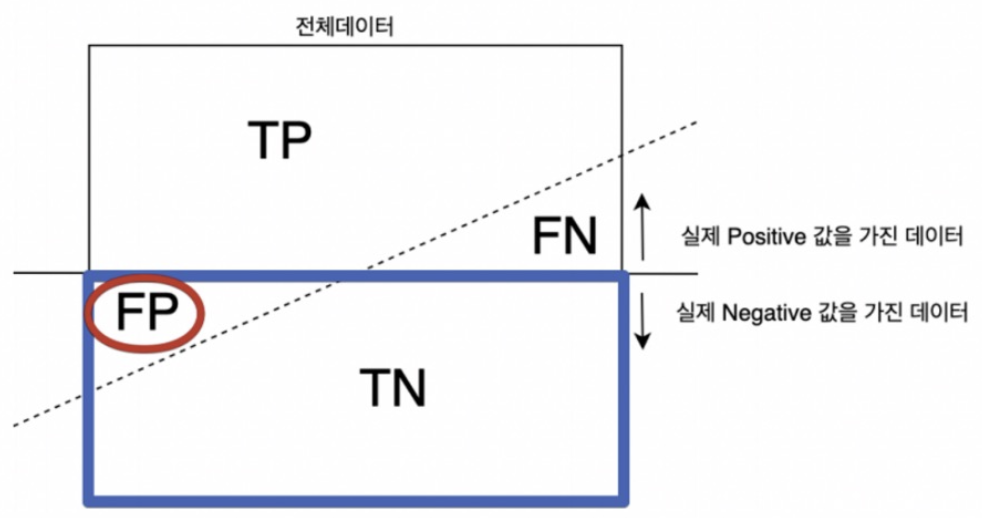
Actual + Predicted
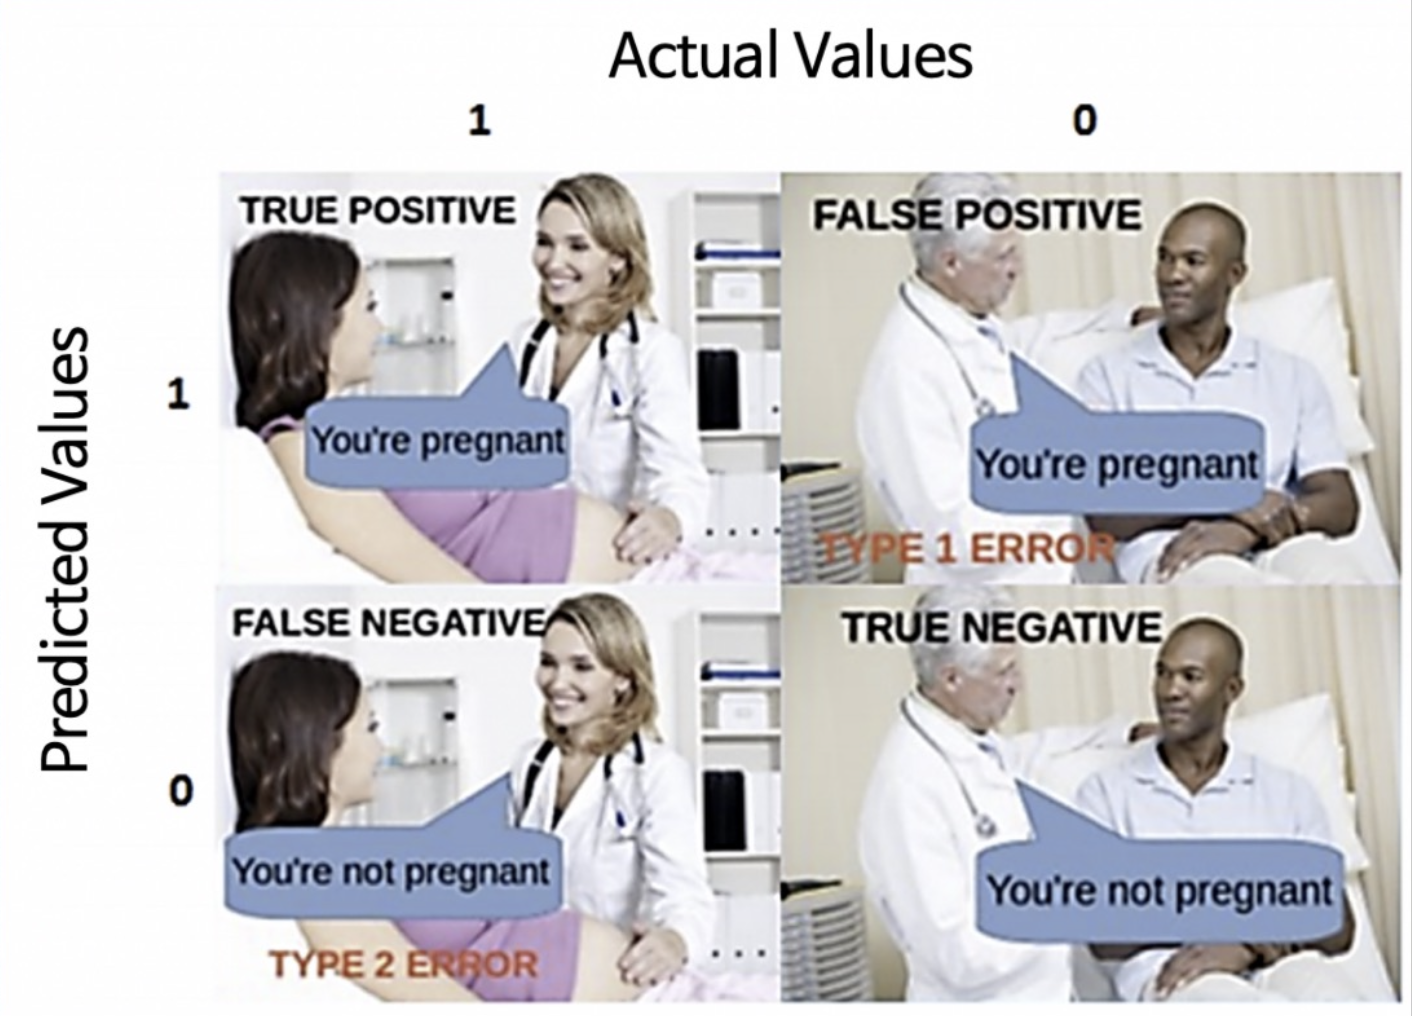
- TP(True Positive): 모델이 positive라고 예측했는데 실제로 정답이 positive (정답)
- TN(True Negative): 모델이 negative라고 예측했는데 실제로 정답이 negative (정답)
- FP(False Positive): 모델이 positive라고 예측했는데 실제로 정답이 negative (오답) => 1종 오류 (Type 1 error)
- FN(False Negative): 모델이 negative라고 예측했는데 실제로 정답이 positive (오답) => 2종 오류 (Type 2 error)
💡 Accuracy(정확도)
.score- 전체 데이터 중 맞게 예측한 것의 비율
- 0 ~ 1 사이의 값을 가지며, 1에 가까울수록 좋다.
- 데이터가 불균형할 때, (ex) positive:negative=9:1)는 Accuracy만으로 제대로 분류했는지는 알 수 없기 때문에 Recall과 Precision을 사용한다.
💡 Precision(정밀도) = PPV(Positive Predictive Value)
- Predict가 Positive(양성)인 것중 실제 양성 비율
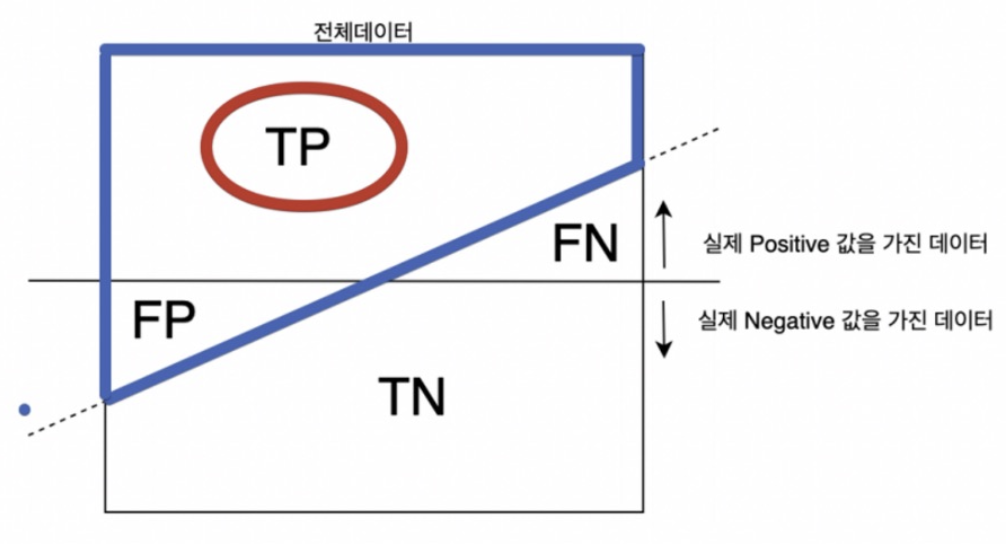
💡 Recall(재현율) = Sensitivity(민감도) = TPR(True Positive Rate)
- Actual이 Positive(양성)인 것 중 양성이라고 예측한 비율
(실제 1 중에서 1이라고 예측)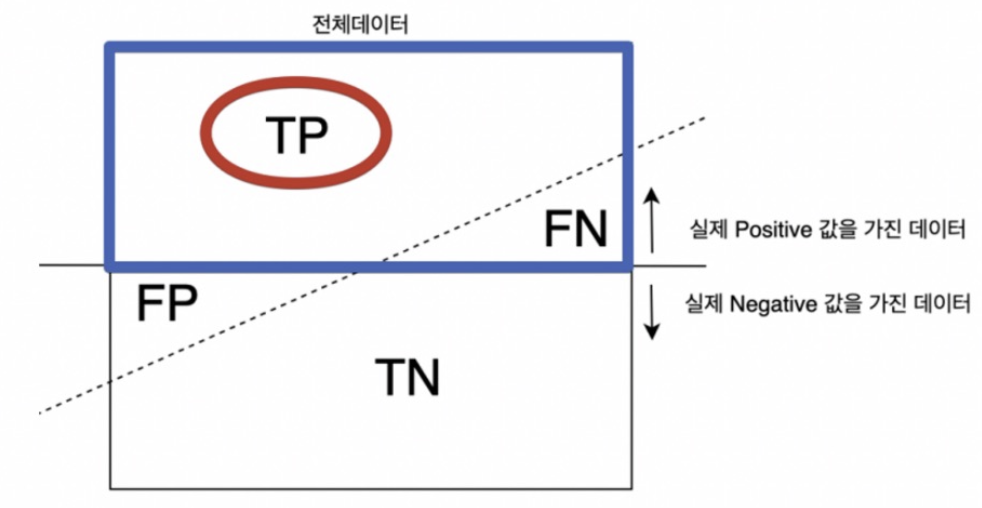
💡 Fall Out(위양성률) = FPR(False Positive Rate)
- 실제 정답이 negative인 것들 중에서 모델이 positive라고 예측한 비율
💡 5. F1 score
- Recall + Precision
- Precision과 Recall이 한쪽으로 치우쳐지지 않고 모두 클 때 큰 값을 가진다.
- 0 ~ 1 사이의 값을 가지며, 1에 가까울수록 좋다.
✏️ 출처
제로베이스 '데이터 취업스쿨' 수강중
교재 '혼자 공부하는 머신러닝 + 딥러닝'
분류 모델 성능 평가 지표(Accuracy, Precision, Recall, F1 score 등)
Rebro의 코딩 일기장:티스토리

데린이인데요 ໒꒰ྀ ˶ • ༝ •˶ ꒱ྀིა (잘못 된 부분은 너그러이 알려주세요.)