FormatStrFormatter; set_major_formatter
ax의 표기 format을 변경한다.
- x축
ax.xaxis.set_major_formatter- y축
ax.yaxis.set_major_formatter
from matplotlib.ticker import FormatStrFormatter
ax.xaxis.set_major_formatter(FormatStrFormatter('%.1f'))
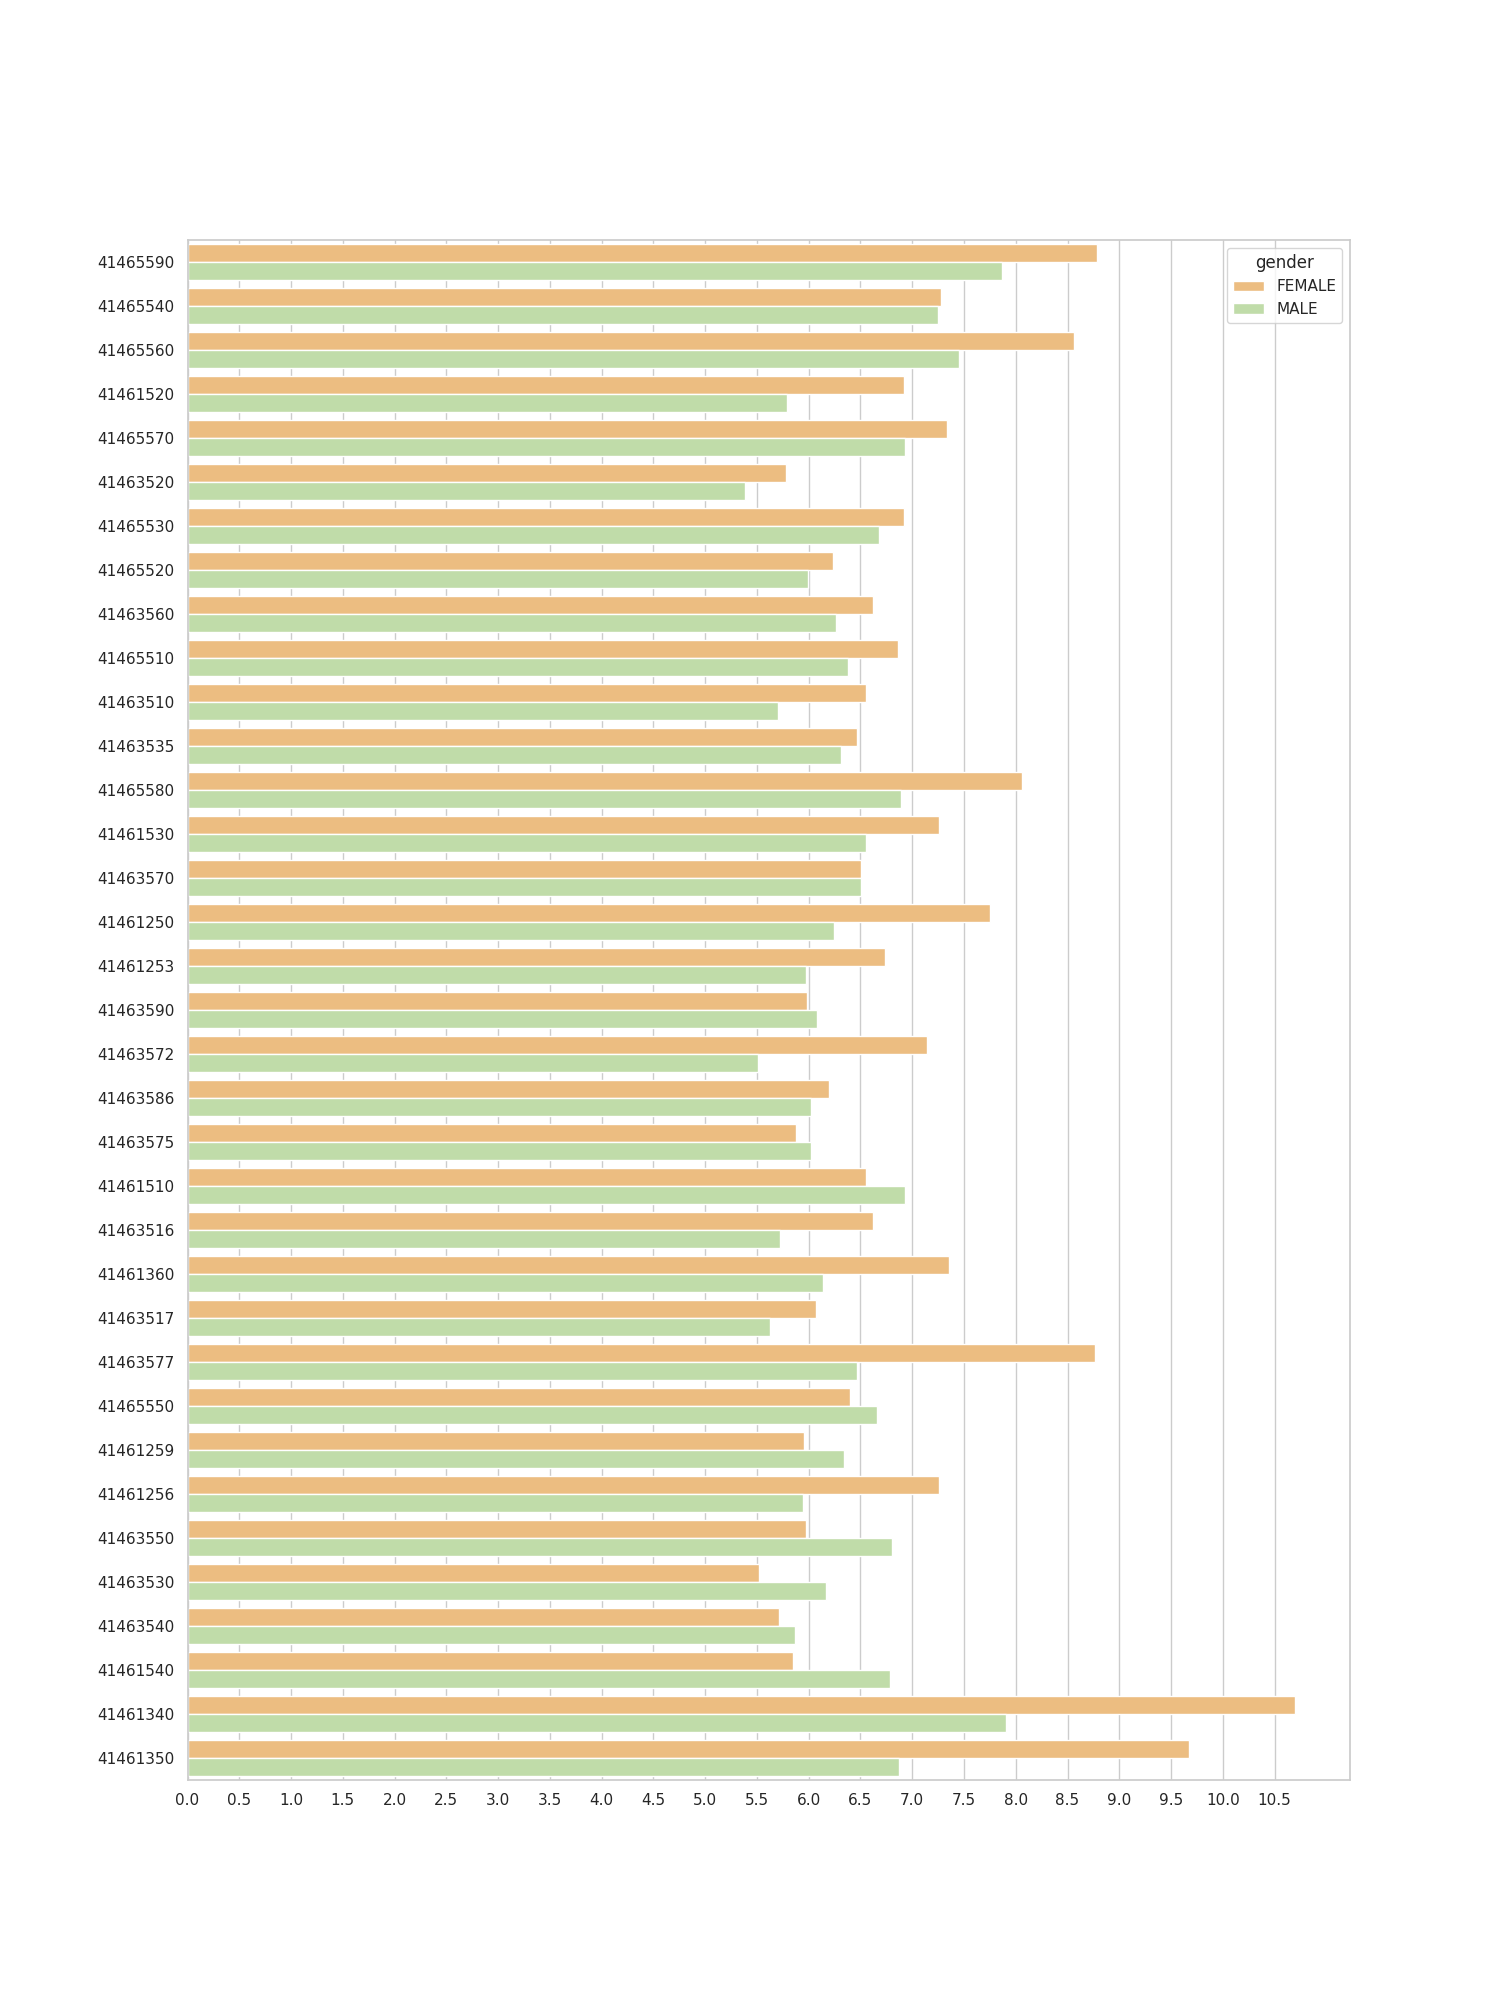
그래프 적용
from matplotlib.ticker import FormatStrFormatter

fig, ax = plt.subplots(figsize=(15,20))
# plt.figure(figsize=(10,20))

# barplot
sns.barplot(data = agcm, y='adng_cd', x='count_cust',hue='gender',
            orient= 'horizontal',
            order= acs.sort_values('count_cust',ascending=False).adng_cd.tolist())

# 소수점 1자리 까지 표기
ax.xaxis.set_major_formatter(FormatStrFormatter('%.1f'))

# 0.5 간격으로 x축 범위 생성
plt.xticks(np.arange(0,11,0.5).tolist())

plt.show()