DevTool Profiler
- React 16.5부터 새로운 DevTools profiler 플러그인의 지원이 추가됨
- 이 플러그인은 React 애플리케이션에서의 성능 병목 현상을 찾기 위해서 렌더링된 각 컴포넌트에 대한 소요 시간 정보를 수집하는 실험적인 profiler API임
Note
react-dom16.5부터 DEV mode에서의 프로파일링을 지원함- production profiling bundle은
react-dom/profiling로 이용 가능함
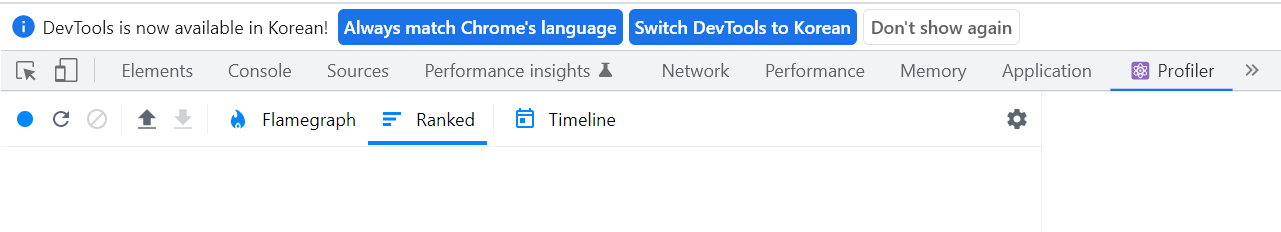
- DevTools에 profiler를 지원하는
Profiler탭이 존재함Profiler패널은 초기에 비어 있음- 녹음 버튼을 클릭하여 프로파일링을 시작함
- 녹음을 시작하면, DevToools은 애플리케이션이 렌더링될 때마다 성능 정보를 자동적으로 수집함
- 프로파일링을 끝낼 때, 중지 버튼을 클릭함
성능 데이터 분석하기
Browsing commits
- React는 개념적으로 2개의 phase로 동작함
- render phase
- render phase는 어떤 변화(예: DOM)가 만들어져야 하는지 결정함
- render phase에서 React는
render를 호출하고, 그 결과와 이전 render 결과를 비교함
- commit phase
- commit phase에서 React는 변화를 적용함(DOM의 경우, React는 DOM 노드를 삽입, 갱신, 제거함)
- commit phase에서 React는 또한
componentDidMount와componentDidUpdate와 같은 생명주기 메서드를 호출함
- render phase
- DevTools profiler는 commit에 의한 성능 정보를 그룹화함
- commit들은 profiler의 상단 막대 그래프에 나타냄
- 막대 그래프의 각 막대는 하나의 commit을 나타냄
- 푸른 막대는 현재 선택된 commit을 의미함
- 막대를 클릭하거나, 좌우 버튼을 클릭하여 다른 commit을 선택할 수 있음
- 각 막대의 색과 높이는 commit이 렌더링되는데 걸린 시간을 나타냄
- 막대가 길고 노란색에 가까울 수록 시간이 더 많이 걸렸다는 것을 의미함
Filtering commits
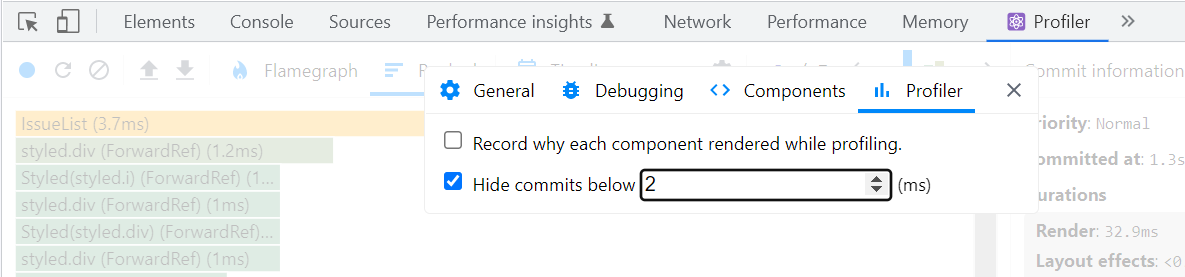
- profile이 길수록, 애플리케이션을 렌더링하는 시간이 오래 걸림
- 때때로 process에서 너무 많은 commit들이 있을 수 있음
- profiler는 문턱값(threshold)을 설정하여 문턱값보다 빠른 commit들을 숨길 수 있음
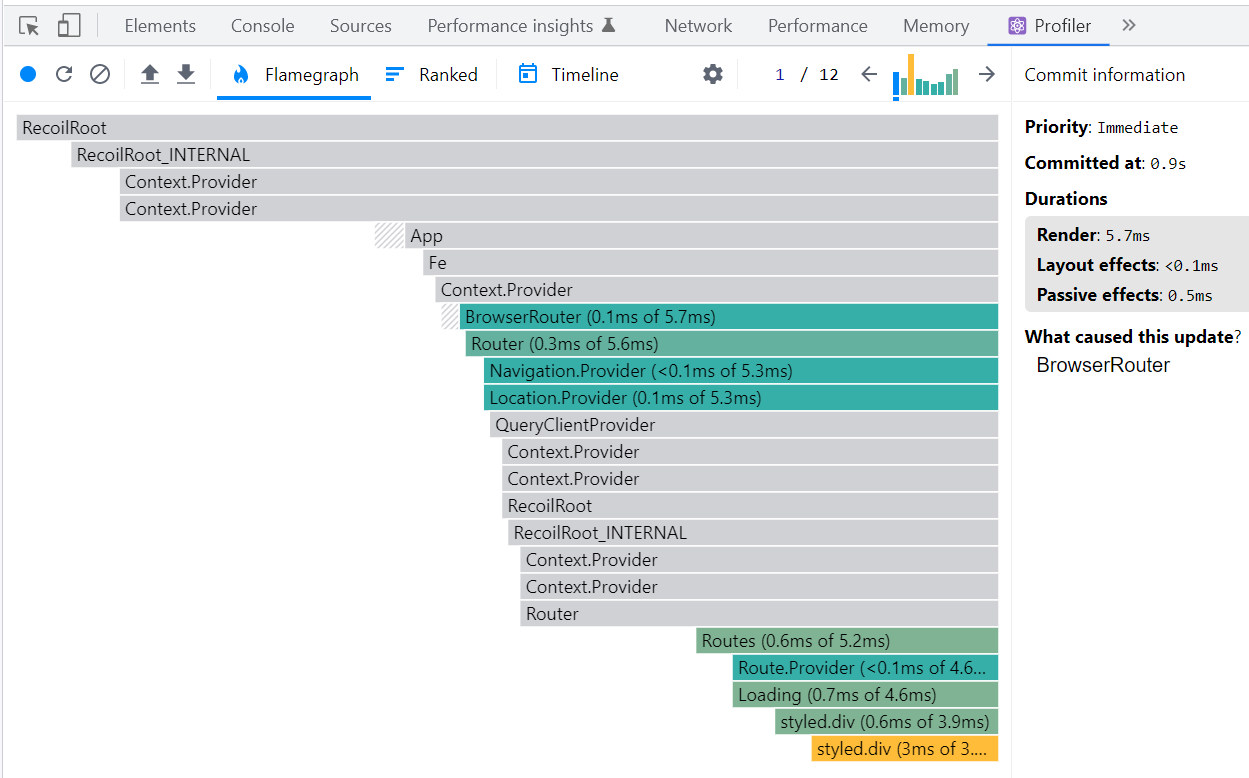
Flame chart
-
flame chart는 특정 commit에 대한 애플리케이션의 상태를 나타냄
- 그래프에서의 각 막대는 React 컴포넌트(예: App, Nav)를 나타냄
- 막대의 넓이는 컴포넌트와 그 자식들이 마지막으로 렌더링했을 때 걸린 시간을 나타냄
- 컴포넌트가 현재 commit에서 리렌더링하지 않았다면, 이전의 렌더링했을 때 걸린 시간을 나타냄
- 막대의 색은 현재 commit에서 컴포넌트와 그 자식들을 렌더링하는데 얼만큼의 시간이 걸렸는지 나타냄
- 노란색 막대 : 더 많은 시간이 걸림
- 파란색 막대 : 더 적은 시간이 걸림
- 회색 막대 : 현재 commit에서 렌더링하지 않음
- 한 컴포넌트 막대를 선택하고 commit들 사이에서 어떠한 모습인지 관찰함으로써 이 컴포넌트가 왜 렌더링했는지 힌트를 얻을 수 있음
-
위의 예시에서의 commit은 렌더링하는데 촏 5.7ms가 걸림
- 렌더링하는데 가장 오래 걸린 컴포넌트는
BrowserRouter(5.7ms)- 렌더링하는데 가장 오래 걸린 이유는 자식 컴포넌트인
Router(0.6ms),Loading(0.7ms),styled.div(0.6ms) 때문임
- 렌더링하는데 가장 오래 걸린 이유는 자식 컴포넌트인
- 렌더링하는데 가장 오래 걸린 컴포넌트는
Ranked chart
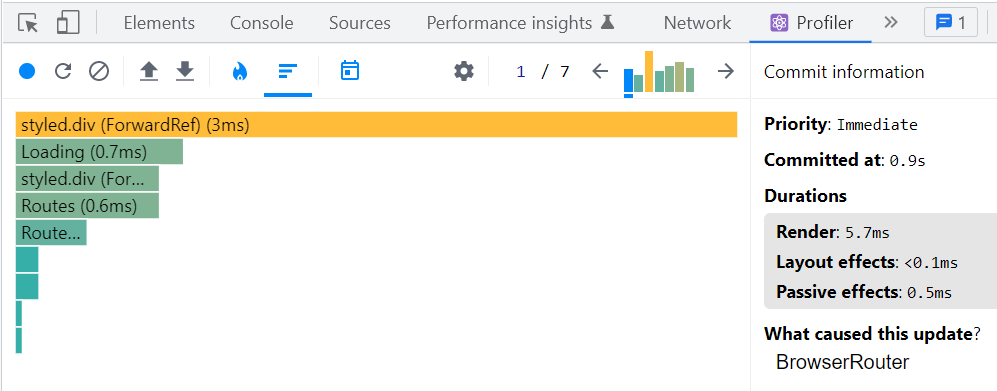
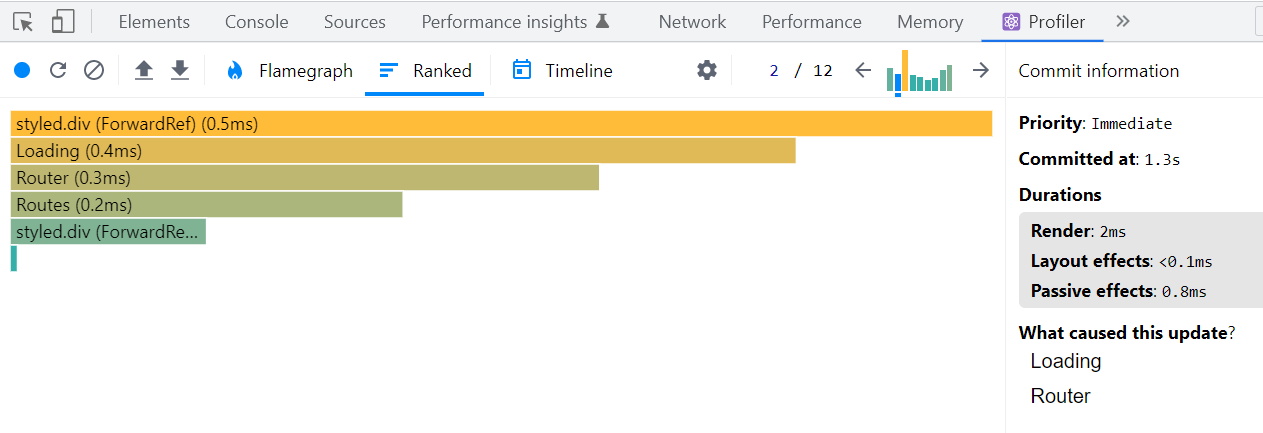
- ranked chart는 단 하나의 commit을 나타냄
- 그래프에서 각 막대는 React 컴포넌트(예: App, Nav)를 나타냄
- 이 그래프는 렌더링하는데 가장 오래 걸린 컴포넌트 막대가 상단에 위치하도록 정렬됨
- 컴포넌트의 렌더링하는 데 걸리는 시간은 컴포넌트의 자식들이 렌더링하는 데 걸린 시간이 포함되어 있음
- 그래서 렌더링하는데 가강 오래 걸린 컴포넌트는 일반적으로 트리의 상단에 있음
- 그래프의 컴포넌트 막대를 클릭하여 확대할 수 있음
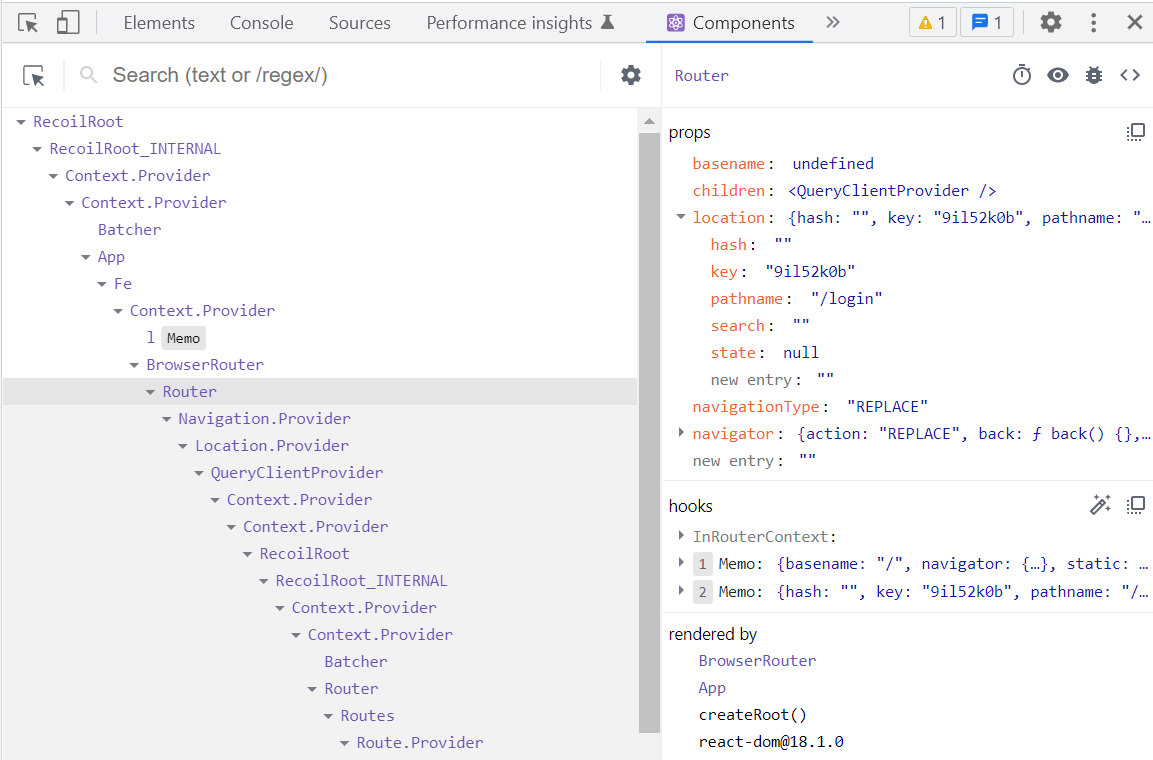
DevTool Component
-
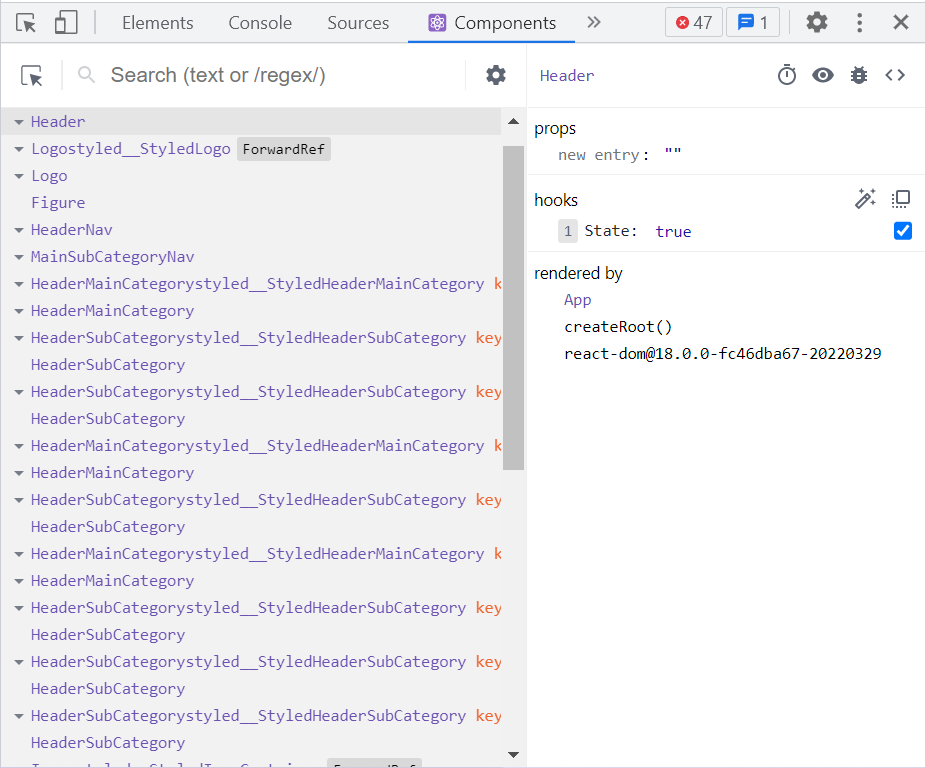
DevTool의 Component plugin은 애플리케이션의 컴포넌트 트리를 보여줌
- 컴포넌트를 클릭했을 때, 좌측 패널에서 클릭한 컴포넌트의 props, hooks, 그리고 이 컴포넌트를 렌더링시키는 부모 컴포넌트들에 대한 정보를 제공함
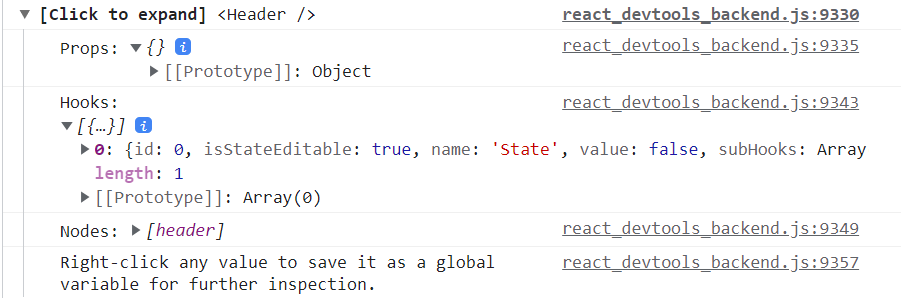
-
좌측 패널의 hooks에서 useState hook을 사용한 state의 변화를 관찰할 수 있음
예) header 컴포넌트의 초기 상태는 false임
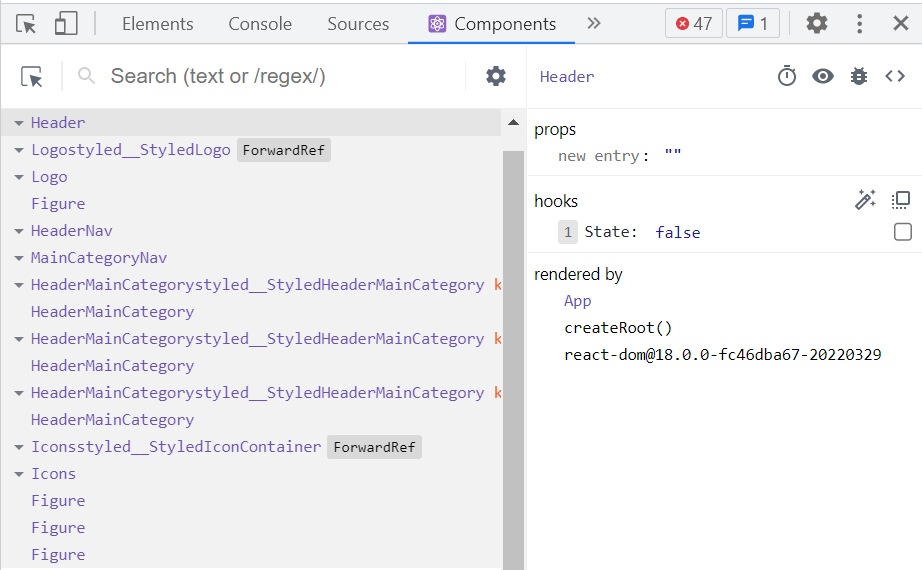
예) header 컴포넌트에 mouse를 hover하면 상태가 true로 바뀜
Suspend the selected Component
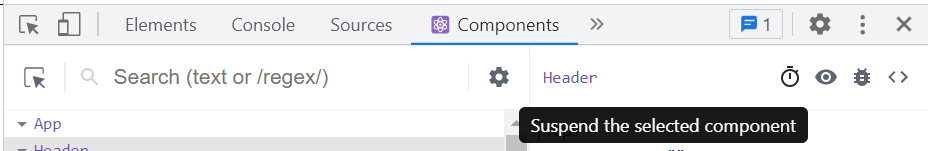
- 좌측 패널의 타이머 버튼을 클릭하면, 선택된 컴포넌트를 임시로 정지시킬 수 있음
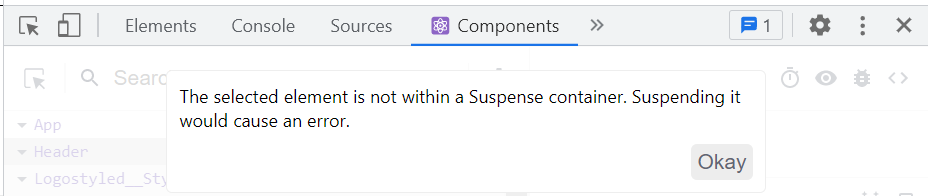
- 단, 선택한 컴포넌트가
Suspend Container안에 있어야 함 - 그렇지 않다면, 에러가 발생함
- 단, 선택한 컴포넌트가
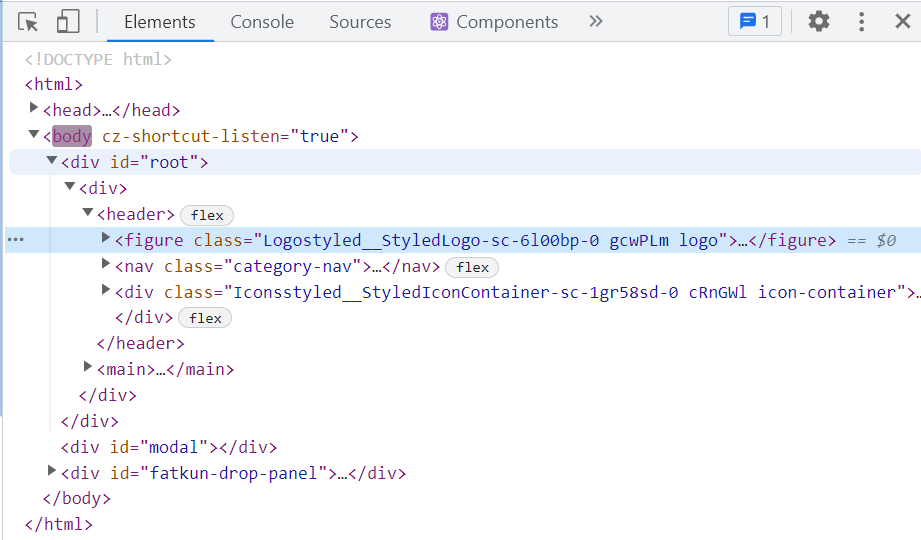
Inspect the matching DOM Element
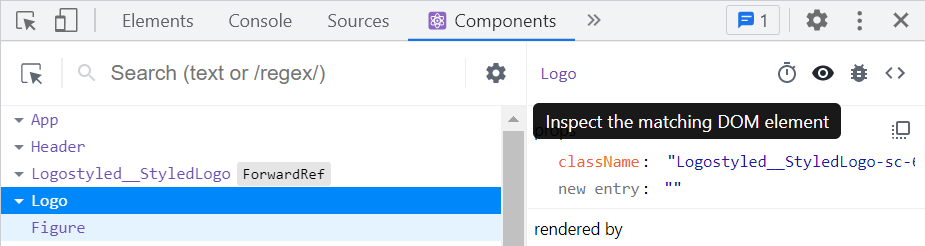
- 좌측 패널의 눈 모양 버튼을 클릭하면, html 파일에서의 선택한 컴포넌트와 일치하는 DOM 엘레먼트를 보여줌
Log the Component data in Console
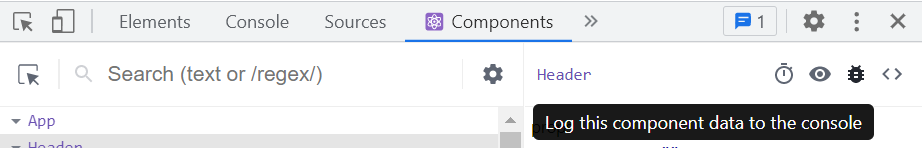
- 좌측 패널의 벌레 모양 버튼을 클릭하면, 선택한 컴포넌트의 데이터를 콘솔창에 출력할 수 있음
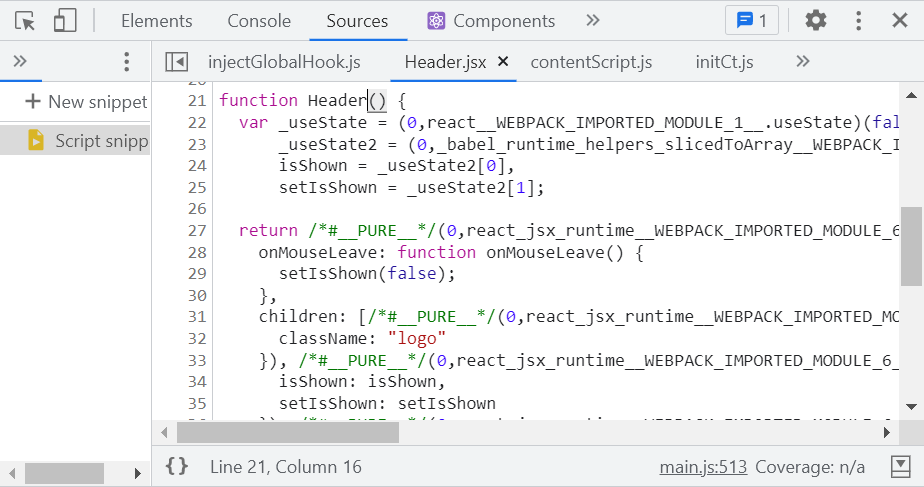
View the Source for the element
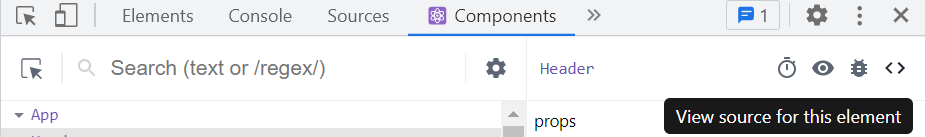
- 좌측 패널의 빈 괄호 버튼을 클릭하여, 선택한 엘리먼트의 JavaScript Source 코드를 확인할 수 있음