정말 간단하게 Amazon Linux 2/3에 Prometheus & Node Exporter 설치하기
오픈소스 모니터링 시스템으로 잘 알려져 있는 prometheus 설치 방법을 공유하고자 작성하였습니다.
개인적으로 실무에서 유용하게 잘 사용중인 서비스들중 하나입니다.
시각화 서비스인 Grafana에 연결하여 Node Exporter로 수집한 메트릭을 시각화한다던가
alertmanager 라는 부가 서비스를 통해 CPU 사용량이 일정량을 넘었을 때 Slack으로 알람을 오게 한다던가
AWS ec2 인스턴스의 CPU / RAM / STORAGE 등을 node exporter 라는 에이전트로 모니터링 할 때도 유용합니다.
'정말 간단하게' 라는 문구를 덧붙였는데, 그 이유는 rpm으로 설치하며 리눅스 데몬까지 등록을 해주어 일일이 prometheus 유저 생성 및 서비스를 만들지 않아서 인데요.
그럼 사용중인 os가 Amazon Linux 2/3인 전제로, 그리고 ec2-user 혹은 sudo 권한이 있는 유저인 전제로 시작하겠습니다.
1. Yum Repository에 등록하기
sudo tee /etc/yum.repos.d/prometheus.repo <<EOF
[prometheus]
name=prometheus
baseurl=https://packagecloud.io/prometheus-rpm/release/el/7/x86_64
repo_gpgcheck=1
enabled=1
gpgkey=https://packagecloud.io/prometheus-rpm/release/gpgkey
https://raw.githubusercontent.com/lest/prometheus-rpm/master/RPM-GPG-KEY-prometheus-rpm
gpgcheck=1
metadata_expire=300
EOF
위 명령어로 하나의 repo를 작성함으로써 yum install 명령어로 prometheus와 node exporter를 설치할 수 있게 됩니다.
sudo yum -y install prometheus2 node_exporter
sudo 명령어로 설치합니다.
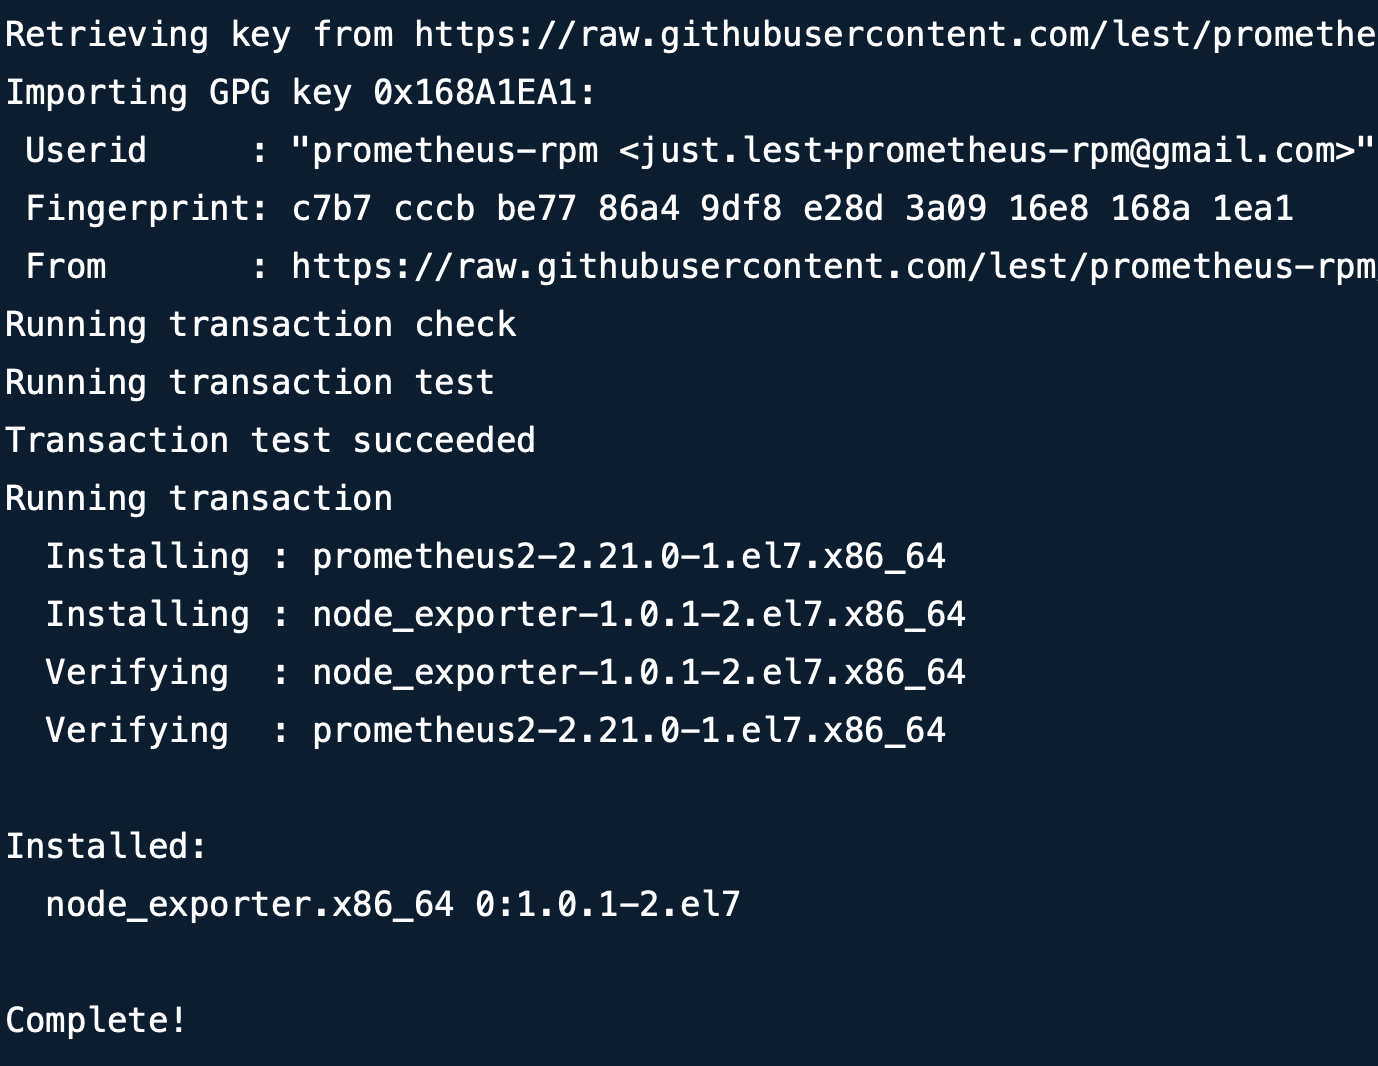
위와 같이 Complete! 이라는 밝고 경쾌한 단어가 나오면 됩니다.
$ rpm -qi prometheus2
또는 위 커맨드로도 설치 유무를 확인할 수 있습니다.
rpm으로 설치함으로써 자동적으로 /etc 디렉토리에 prometheus라는 폴더가 생성되었습니다.
앞으로 이 폴더에 생성된 yaml 파일을 exporter들을 설치하실 때 마다 수정해주시면 됩니다.
$ sudo vi /etc/prometheus/prometheus.yml
vi / nano / vim 중 맘에 드는 에디터를 사용하여 yaml 파일을 수정합니다.
scrape_configs:
######### The job name is added as a labeljob=<job_name>to any timeseries scraped from this config.
- job_name: 'prometheus'
######## metrics_path defaults to '/metrics'
######## scheme defaults to 'http'.
static_configs:
- targets: ['localhost:9090']
######### Pull host metrics with node exporter- job_name: mynode
static_configs:
- targets: ['localhost:9100']
맨 아래로 내려가 "scrape_configs" 아래에 위 문구를 추가해줍니다. (이미 job_name: 'prometheus'가 있다면 job_name: mynode 부분만 입력합니다)
sudo systemctl restart prometheus node_exporter
위 명령어로 두 시스템 데몬을 재실행합니다 (prometheus, node_exporter).
참고로 prometheus.yml 파일이 수정될 때 마다 재실행을 해주셔야 등록이 됩니다.
sudo systemctl enable prometheus node_exporter
sudo systemctl enable prometheus node_exporter
systemctl enable을 해주어 서버가 재기동되도 켜질 수 있도록 symbolic link를 생성합니다.
systemctl status prometheus.service node_exporter.service
활성화가 되었는지, 잘 돌아가는지 확인합니다.
AWS Security Group Inbound 설정에서 포트 9090을 열어주신 뒤 http://본인_EC2_PUBLIC_IP:9090/ 로 접속합니다.
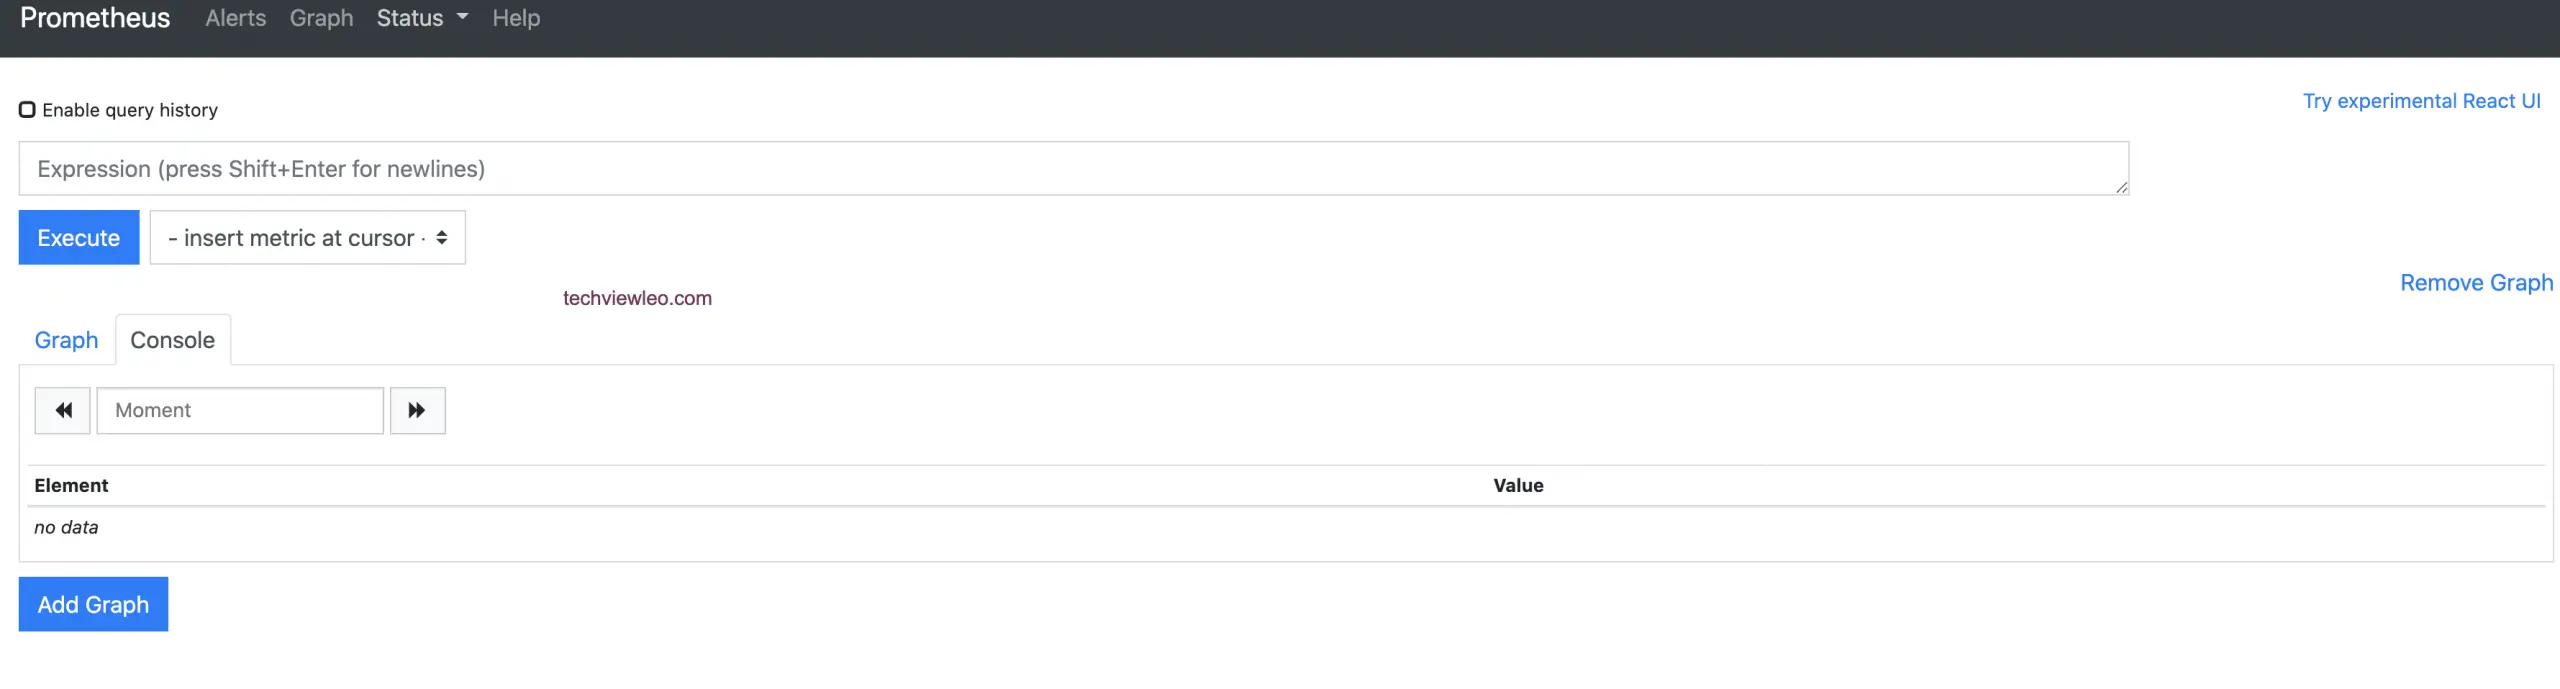
위와 같이 prometheus 웹서버 접속이 되면 됩니다.
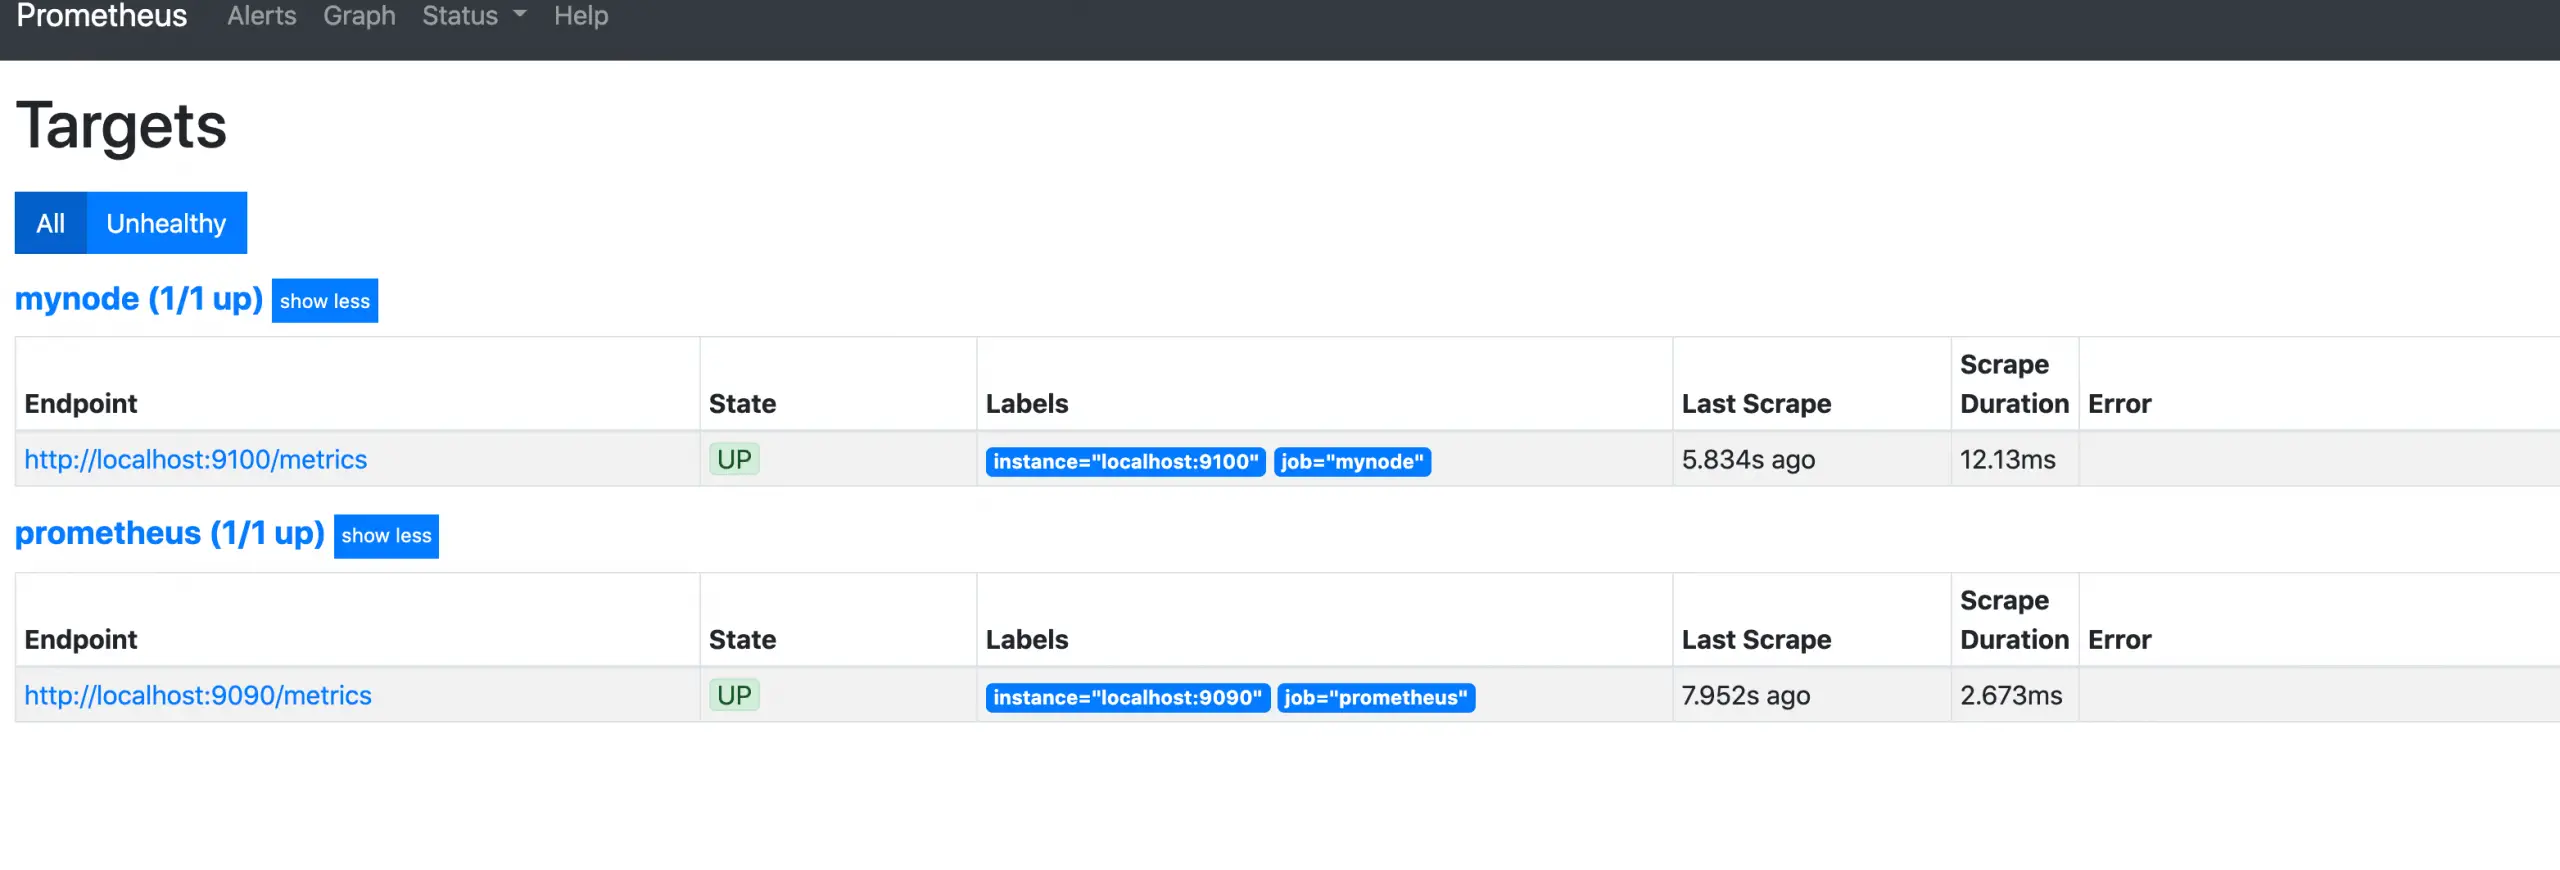
상단에 위치한 Status를 누른 뒤 Targets 버튼을 다시 누르면 위와 같이 좀 전에 yaml 파일에서 등록한 job_name을 확인할 수 있습니다.
다음 시간에는 위에 등록한 node exporter가 수집하는 메트릭으로 Grafana에서 모니터링 대시보드를 같이 만들도록 하겠습니다.
읽어주셔서 감사합니다 :)
References
https://techviewleo.com/how-to-install-prometheus-on-amazon-linux/

공감하며 읽었습니다. 좋은 글 감사드립니다.