torch.meshgrid
grid를 생성해줌 (주로 3차원에 plot 할 때 쓰이는 듯)
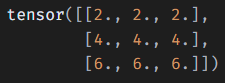
1. torch.linspace(시작, 끝, 분할 수)
import torch

x1 = torch.linspace(2, 6, 3)
x2 = torch.linspace(3, 7, 3)

X1, X2 = torch.meshgrid(x1,x2)
print 해보면
[2, 6]을 3개로 분할-> tensor([2., 4., 6.])
[3, 7]을 3개로 분할-> tensor([3., 5., 7.])

tensor([[2., 2., 2.],
        [4., 4., 4.],
        [6., 6., 6.]])

tensor([[3., 5., 7.],
        [3., 5., 7.],
        [3., 5., 7.]])
2. 2차원에 plot
import matplotlib.pyplot as plt

x, y = X1.numpy(), X2.numpy()

for i in range(len(x)):
   for j in range(len(y)):
       plt.text(x[i, j], y[i, j], f'({int(x1[i])}, {int(x2[j])})',
                fontsize=8, ha='left', va='bottom')

plt.xlim(0, 8)
plt.ylim(0, 8)
plt.plot(x, y,'bo', markersize=3)
plt.grid()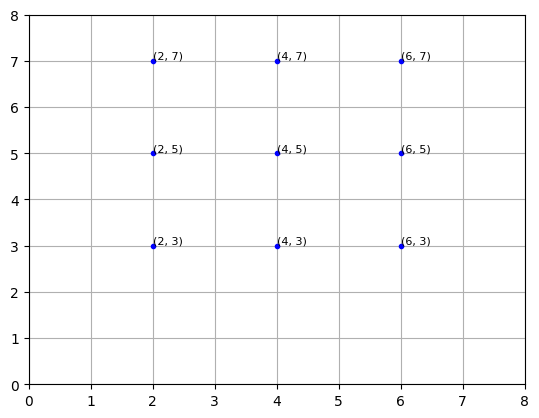
다시 x를 print 했던걸 떠올려보면
plot 된 순서쌍을 왼쪽에서부터 읽은 것임을 알 수 있음
3. 3차원 실제 사용 예시
x1_test=torch.linspace(-2,2,30)	           # [-2, 2]까지 30개의 점으로 분할
x2_test=torch.linspace(-2,2,30)            # [-2, 2]까지 30개의 점으로 분할

X1_test, X2_test=torch.meshgrid(x1_test,x2_test)
X_test = torch.cat([X1_test.unsqueeze(dim=2), X2_test.unsqueeze(dim=2)], dim=2)


model.eval()
with torch.no_grad():
    y_hat = model(X_test)

Y_hat = y_hat.squeeze()


plt.figure(figsize=[10, 9])
ax = plt.axes(projection="3d")
ax.view_init(elev=25,azim=-140)

ax.plot_surface(X1_test, X2_test, Y_hat.numpy(), cmap="viridis", alpha=0.2)

# 아래는 data
plt.plot(class1_data[:,0],class1_data[:,1],class1_label.squeeze(),'bo')
plt.plot(class2_data[:,0],class2_data[:,1],class2_label.squeeze(),'ro')
plt.xlabel("x1")
plt.ylabel("x2")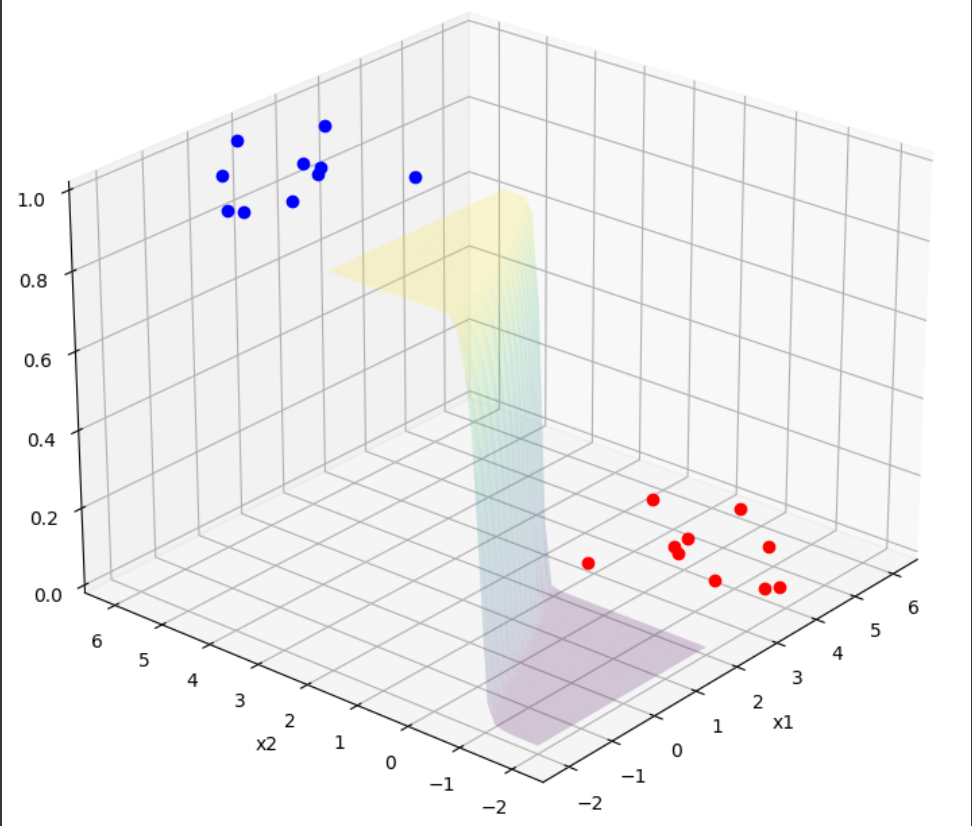

내 뇌의 외장하드