matplotlib.pyplot의plt.style.use() 사용하는 방법
matplotlib이 제공하는 mpl.style.use('seaborn~')이 deprecated되었다.
대신, matplotlib.pyplot의 plt.style.use()를 사용하면 된다.
사용할 수 있는 style 목록:
import matplotlib.pyplot as plt
plt.style.available
...
['Solarize_Light2',
 '_classic_test_patch',
 '_mpl-gallery',
 '_mpl-gallery-nogrid',
 'bmh',
 'classic',
 'dark_background',
 'fast',
 'fivethirtyeight',
 'ggplot',
 'grayscale',
 'seaborn-v0_8',
 'seaborn-v0_8-bright',
 'seaborn-v0_8-colorblind',
 'seaborn-v0_8-dark',
 'seaborn-v0_8-dark-palette',
 'seaborn-v0_8-darkgrid',
 'seaborn-v0_8-deep',
 'seaborn-v0_8-muted',
 'seaborn-v0_8-notebook',
 'seaborn-v0_8-paper',
 'seaborn-v0_8-pastel',
 'seaborn-v0_8-poster',
 'seaborn-v0_8-talk',
 'seaborn-v0_8-ticks',
 'seaborn-v0_8-white',
 'seaborn-v0_8-whitegrid',
 'tableau-colorblind10']
이런 식으로 사용하면 된다.
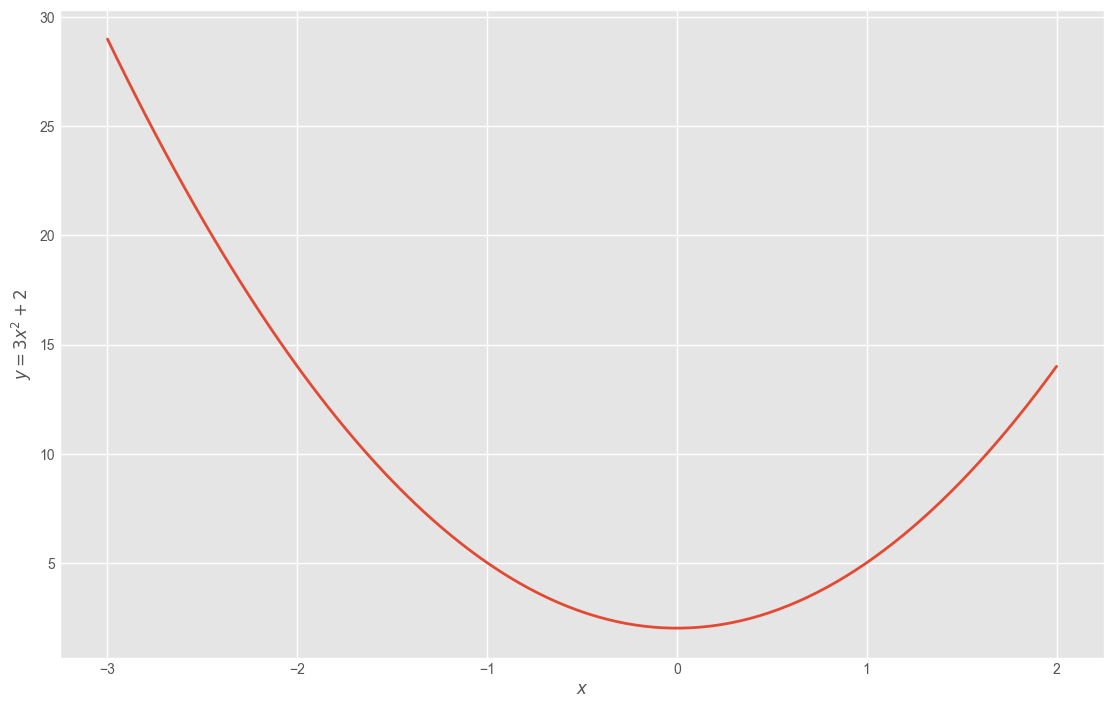
plt.style.use('ggplot')
plt.figure(figsize=(12,8))
plt.xlabel('$x$')
plt.ylabel('$y = 3x^2 +2$')
plt.plot(x, y);