[AI][Data Analysis and Machine Learning]머신러닝_분류문제 풀어보기

분류 문제
- 여러개의 종류(class) 중 하나를 구별해 내는 문제
- 2 개의 클래스 중 하나를 고르는 문제 ⇒ 이진분류 (binary classification)
import numpy as np
import pandas as pd
import matplotlib.pyplot as plt
import os
생선 분류 문제
- 생선 데이터 셋
https://www.kaggle.com/datasets/vipullrathod/fish-market (2024.03 현재)
- 데이터 불러오기
base_path = r'~~'
file_path = os.path.join(base_path,'fish.csv')
fish_df = pd.read_csv(file_path)
| Species | Weight | Length | Diagonal | Height | Width | |
|---|---|---|---|---|---|---|
| 0 | Bream | 242.0 | 25.4 | 30.0 | 11.5200 | 4.0200 |
| 1 | Bream | 290.0 | 26.3 | 31.2 | 12.4800 | 4.3056 |
| 2 | Bream | 340.0 | 26.5 | 31.1 | 12.3778 | 4.6961 |
| 3 | Bream | 363.0 | 29.0 | 33.5 | 12.7300 | 4.4555 |
| 4 | Bream | 430.0 | 29.0 | 34.0 | 12.4440 | 5.1340 |
- info 확인하기
fish_df.info()<class 'pandas.core.frame.DataFrame'>
RangeIndex: 159 entries, 0 to 158
Data columns (total 6 columns):
Column Non-Null Count Dtype
0 Species 159 non-null object
1 Weight 159 non-null float64
2 Length 159 non-null float64
3 Diagonal 159 non-null float64
4 Height 159 non-null float64
5 Width 159 non-null float64
dtypes: float64(5), object(1)
memory usage: 7.6+ KB
- 컬럼 정보
컬럼 정보
 Species  생선의 종류 (분류형)
 Weight   생선의 무게 (수치형)
 Length   생선의 길이 (수치형)
 Diagonal 생선의 대각선 길이 (수치형)
 Height   생선의 크기 (수치형)

+..

- Perch '농어'
- Bream '도미'
- Roach '로치, Common Roach 잉어과 담수어'
- Pike '강꼬치고기, Northern pike'
- Smelt '빙어'
- Parkki '청돔'
- Whitefish '송어'
- 종들 확인
fish_df.Species.unique()array(['Bream', 'Roach', 'Whitefish', 'Parkki', 'Perch', 'Pike', 'Smelt'],
dtype=object)
- 종들 count 확인
fish_df.Species.value_count()| count | |
|---|---|
| Species | |
| Perch | 56 |
| Bream | 35 |
| Roach | 20 |
| Pike | 17 |
| Smelt | 14 |
| Parkki | 11 |
| Whitefish | 6 |
Fish(생선) 분류문제
- 생선의 길이와 무게만으로 생선의 종류를 자동으로 분류 가능할까?
- Bream 과 Smelt 를 분류해보기
Bream과 Smelt 데이터 준비
- Bream 35 마리 데이터 준비
#길이
bream_length=fish_df[fish_df.Species == 'Bream']['Length'].to_list()
bream_length

#무게
bream_weight=fish_df[fish_df.Species == 'Bream']['Weight'].to_list()

>[25.4, 26.3, 26.5, 29.0, 29.0, 29.7, 29.7, 30.0, 30.0, 30.7, 31.0, 31.0, 31.5, 32.0, 32.0, 32.0, 33.0, 33.0, 33.5, 33.5, 34.0, 34.0, 34.5, 35.0, 35.0, 35.0, 35.0, 36.0, 36.0, 37.0, 38.5, 38.5, 39.5, 41.0, 41.0]
[242.0, 290.0, 340.0, 363.0, 430.0, 450.0, 500.0, 390.0, 450.0, 500.0, 475.0, 500.0, 500.0, 340.0, 600.0, 600.0, 700.0, 700.0, 610.0, 650.0, 575.0, 685.0, 620.0, 680.0, 700.0, 725.0, 720.0, 714.0, 850.0, 1000.0, 920.0, 955.0, 925.0, 975.0, 950.0]
- Smelt 14 마리 데이터 준비
# 빙어 14 마리

#길이
smelt_length=fish_df[fish_df.Species == 'Smelt']['Length'].to_list()
smelt_length

#무게
smelt_weight=fish_df[fish_df.Species == 'Smelt']['Weight'].to_list()

>[9.8, 10.5, 10.6, 11.0, 11.2, 11.3, 11.8, 11.8, 12.0, 12.2, 12.4, 13.0, 14.3, 15.0]
[6.7, 7.5, 7.0, 9.7, 9.8, 8.7, 10.0, 9.9, 9.8, 12.2, 13.4, 12.2, 19.7, 19.9]
feature
-
데이터의 특징/특성
-
데이터를 표현하는 성질
-
두 생선의 데이터 분포를 한번에 시각화
plt.scatter(bream_length,bream_weight)
plt.scatter(smelt_length,smelt_weight)
plt.xlabel('length')
plt.ylabel('weight')
plt.show()
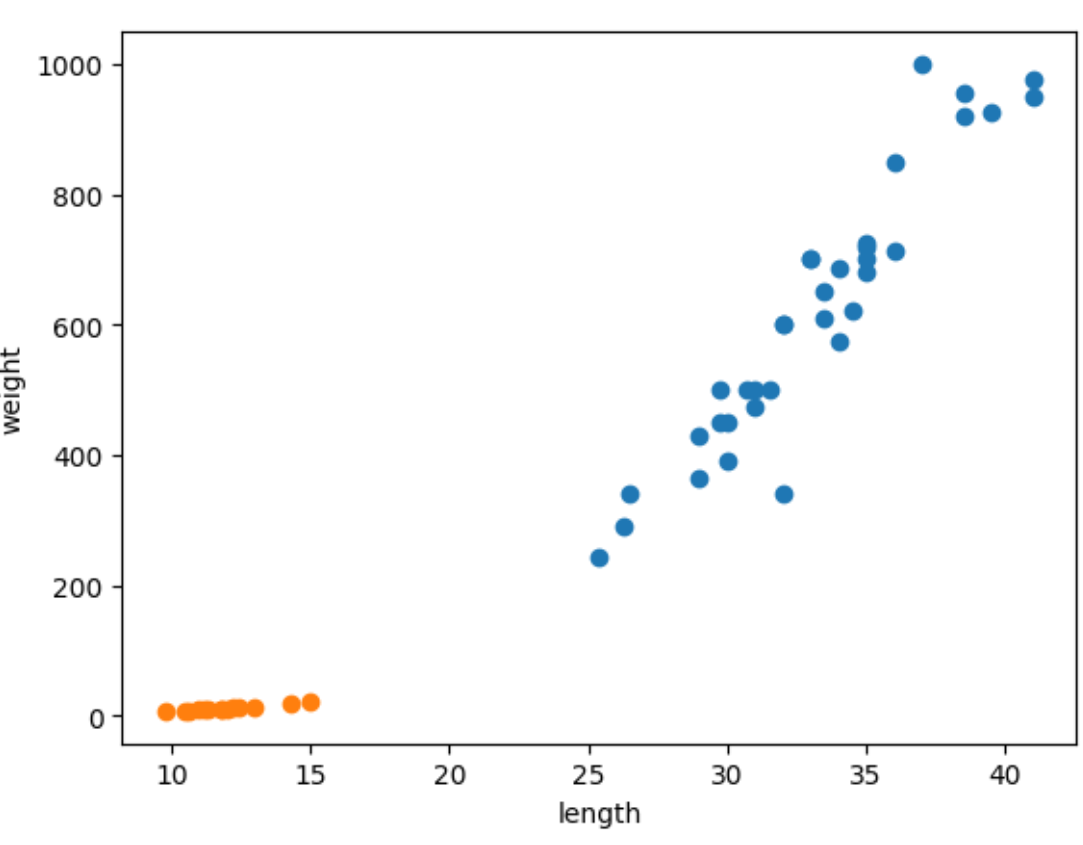
- 좌 하단이 빙어의 산점도 데이터/ 우 상단이 도미의 산점도 데이터
- 빙어, 도미 모두 비슷하게 길이와 무게가 비례하지만, 늘어나는 정도가 다르다. 즉 빙어의 산점도도 선형적이긴 하지만 무게가 길이에 영향을 덜 받는다고 할 수 있다
머신러닝의 입력input 데이터 준비
- feature vector 형태로 준비
K-최근접 이웃 (k-Nearest Neighbors,KNN) 알고리즘을 사용하여 도미와 빙어 데이터 구분
- 도미와 빙어 데이터 합치기
length=bream_length+smelt_length
weight=bream_weight+smelt_weight
scikit-learn 에서는 data를 각 특성들의 배열 형태로 만들어야 한다⇒2차원 배열
   길이   무게
[   ↓     ↓
  [25.4, 242.0],
  [26.3, 290.0],
  [26.5, 340.0],
  ...
  [15.0, 19.9]
]
이를 입력(input)이라고도 하고 feature vector 라고도 한다
fish_data=[[l,w] for l,w in zip(length,weight)]

>[[25.4, 242.0], [26.3, 290.0], [26.5, 340.0], [29.0, 363.0], [29.0, 430.0], [29.7, 450.0], [29.7, 500.0], [30.0, 390.0], [
머신러닝의 답안 준비
- 지도학습에서는 입력데이터에 대한 답안이 필요하다
- 이를 label 혹은 target 이라 한다
- 머신러닝 알고리즘은 이를 계산 가능한 숫자 형태로 알려주어야 한다
도미는 1로, 빙어는 0으로 표현된 답안 준비
fish_target=[1]* 35 +[0]*14
print(fish_target)
>[1, 1, 1, 1, 1, 1, 1, 1, 1, 1, 1, 1, 1, 1, 1, 1, 1, 1, 1, 1, 1, 1, 1, 1, 1, 1, 1, 1, 1, 1, 1, 1, 1, 1, 1, 0, 0..
머신러닝의 모델 준비
- 모델이란 머신러닝 알고리즘을 구현한 프로그램, 혹은 알고리즘을 구체화 하여 표현한 것
- KNN 분류모델
from sklearn.neighbors import KNeighborsClassifier - 모델 객체 생성
kn = KNeighborsClassifier() - KNeighborsClassifier
**KNeighborsClassifier**

https://scikit-learn.org/stable/modules/generated/sklearn.neighbors.KNeighborsClassifier.html

```python
class sklearn.neighbors.KNeighborsClassifier(
  n_neighbors=5,
  *,
  weights='uniform',
  algorithm='auto',
  leaf_size=30,
  p=2,
  metric='minkowski',
  metric_params=None,
  n_jobs=None)
- KNN(k-최근접 이웃,k-Nearest Neighbors 알고리즘)이란? 어떤 데이터에 대한 답을 구할때 주변의 다른데이터를 보고 다수를 차지하는 것을 정답으로 사용함 EX. length:30, weight: 600 ← 이 생선은 도미인가 빙어인가
plt.scatter(bream_length, bream_weight)
plt.scatter(smelt_length, smelt_weight)
plt.scatter(30,600,marker='^')
plt.xlabel('length')
plt.ylabel('weight')
plt.show()
모델 학습하기
- training (훈련) 혹은 fitting(적합) 한다 라고도 함
- 주어진 모델에 주어진 데이터를 통해 규칙을 찾아가는 과정
- 모델 알고리즘을 구성하는 각종 파라미터 값들이 입력된 데이터를 학습하면서 최적의 값으로 변화되어 간다
kn.fit(fish_data,fish_target)학습한 결과 : 정확도
- 얼마나 잘 학습했는지 점수로 확인
- score(data,target)⇒0.0~1.0 사이값
- 1.0은 100% 맞춘다는 뜻
kn.score(fish_data,fish_target)
>1.0
학습된 모델을 통해 예측하기
predict
- 학습한 모델에 새로이 관측된 데이터를 넣어 예측 결과 리턴
- 예측에는 target 값 필요X
- predict()의 입력데이터도 feature 들의 배열로 넣어주어야 한다
- 리턴값은 예측값들의 배열
kn.predict([[30,600]])
>array([1])

kn.predict([
		[30,600],
		[16,30],
	])

>array([1,0])
어리둥절 빙글빙글 돌아가는 코딩세상~