✨Prometheus
Prometheus는 메트릭 수집, 시각화, 알림, 서비스 디스커버리 기능을 모두 가지고 있는 오픈소스 기반의 모니터링 시스템이다. 처음에는 SoundCloud에서 만들어졌으나 2016년에는 쿠버네티스에 이어 두 번째로 CNCF(Cloud Native Computing Foundation) 산하 프로젝트 멤버로 들어가게 됐다.
✨Grafana
Grafana는 애플리케이션에서 수집된 지표, 로그 및 추적을 시각화하기 위한 오픈 소스 관찰 가능성 플랫폼이다. Torkel Ödegaard의 주도로 2014년 처음 릴리스되었으며, Prometheus, InfluxDB, ElasticSearch 및 기존 관계형 데이터베이스 엔진과 같은 다양한 데이터 소스에 연결된다.
✨Node Exporter
Prometheus Node Exporter는 하드웨어의 상태와 커널 관련 메트릭을 수집하는 메트릭 수집기이다. Prometheus는 Node Exporter의 metrics HTTP endpoint에 접근하여 해당 메트릭을 수집할 수 있다. Node Exporter로 부터 수집한 메트릭을 Prometheus내의 TSDB에 저장하여 PromQL로 메트릭을 쿼리해 서버 상태를 모니터링할 수 있다.
Docker에 Prometheus, Grafana 연동하기
1. docker-compose.yml 파일 작성
version: "3"

networks:
  t4y:
    driver: bridge

  prometheus:
    image: prom/prometheus
    container_name: prometheus
    volumes:
      - ./prometheus/config:/etc/prometheus
      - prometheus-data:/prometheus
    ports:
      - 9090:9090
    command:
      - '--storage.tsdb.path=/prometheus'
      - '--config.file=/etc/prometheus/prometheus.yml'
    restart: always
    networks:
      - t4y

  grafana:
    image: grafana/grafana
    container_name: grafana
    ports:
      - 3000:3000
    volumes:
      - grafana-data:/var/lib/grafana
      - ./grafana/provisioning/:/etc/grafana/provisioning/
    restart: always
    depends_on:
      - prometheus
    networks:
      - t4y

  node_exporter:
    image: prom/node-exporter
    volumes:
      - /proc:/host/proc:ro
      - /sys:/host/sys:ro
      - /:/rootfs:ro
    command:
      - '--path.procfs=/host/proc'
      - '--path.rootfs=/rootfs'
      - '--path.sysfs=/host/sys'
      - '--collector.filesystem.mount-points-exclude=^/(sys|proc|dev|host|etc)($$|/)'
    ports:
      - "9100:9100"
    networks:
      - t4y

volumes:
  grafana-data:
  prometheus-data:
2. prometheus.yml 파일 작성
global:
  scrape_interval: 15s
  scrape_timeout: 15s
  evaluation_interval: 2m

  external_labels:
    monitor: 'codelab-monitor'
    query_log_file: query_log_file.log

scrape_configs:
  - job_name: 'monitoring-item'
    scrape_interval: 10s
    scrape_timeout: 10s
    metrics_path: '/metrics'
    scheme: 'http'

    static_configs:
      - targets: ['prometheus:9090', 'node_exporter:9100']
        labels:
          service: 'monitor'
3. 컨테이너 실행
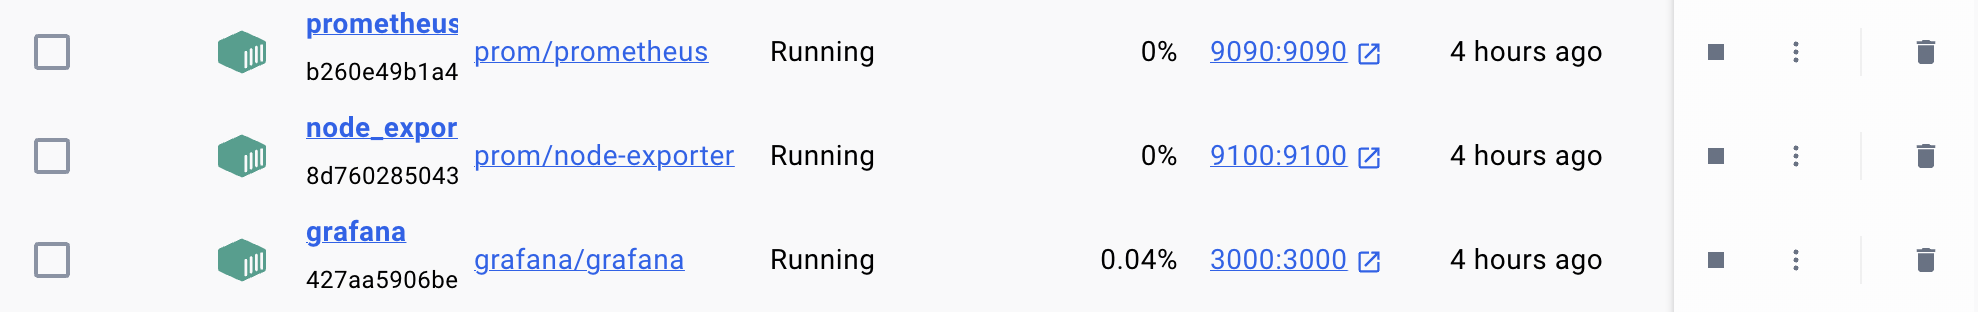
명령어 docker compose up -d 로 도커 컨테이너를 실행한다.
그러면 다음과 같이 prometheus, grafana, node_exporter 컨테이너가 추가된 것을 확인할 수 있다.
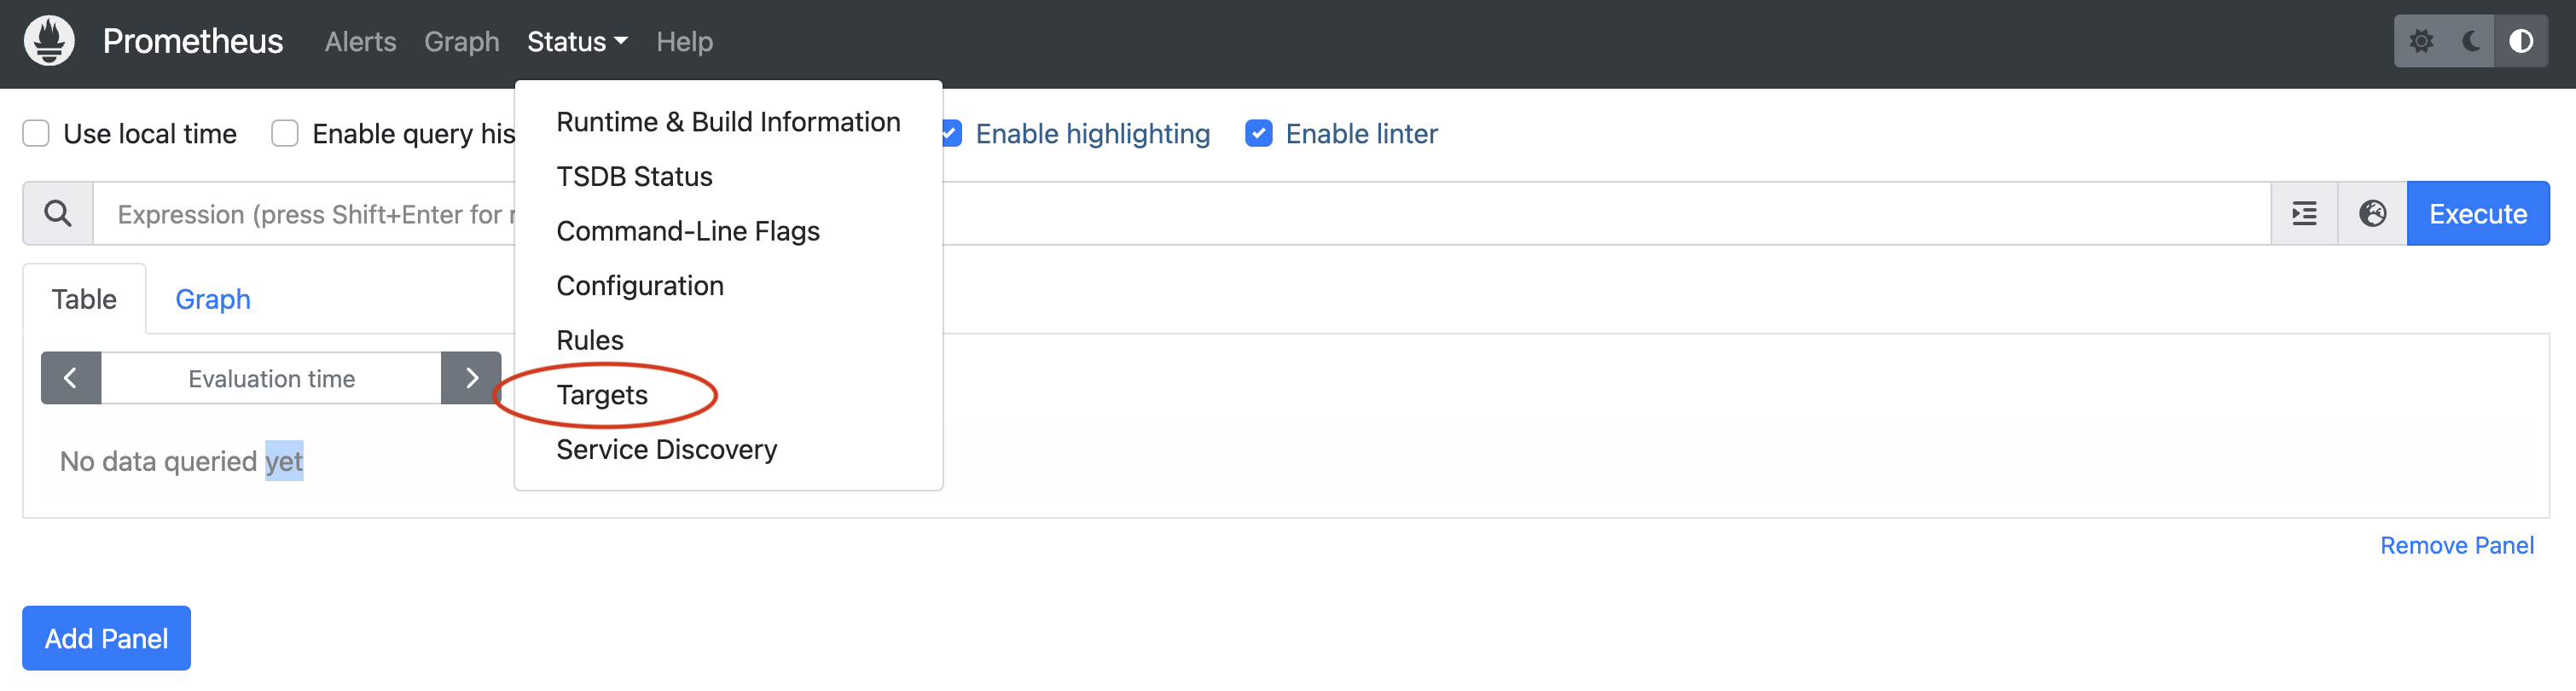
prometheus의 서버로 들어가서 Targets를 클릭하여 잘 연동되었는지 확인해보자.
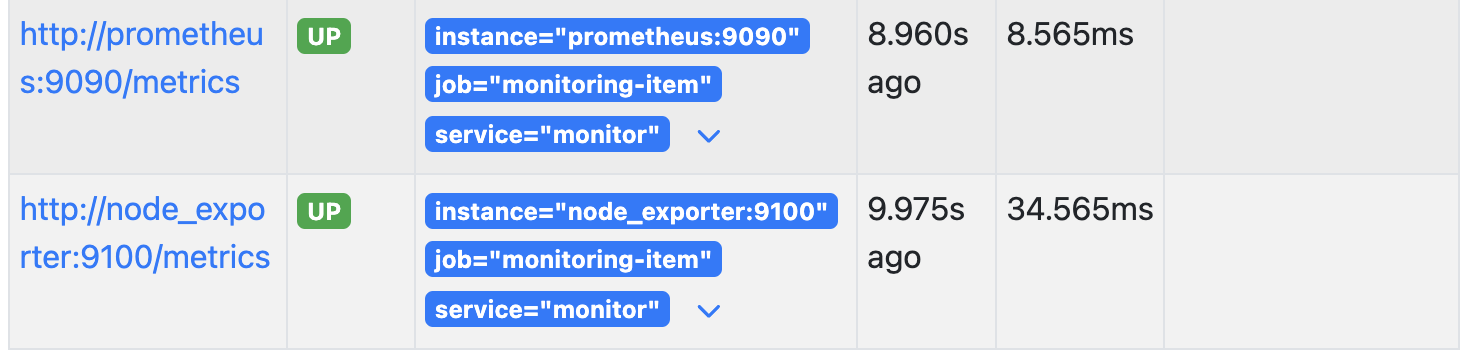
다음과 같이 State가 모두 UP이므로 문제없이 연동되었다.
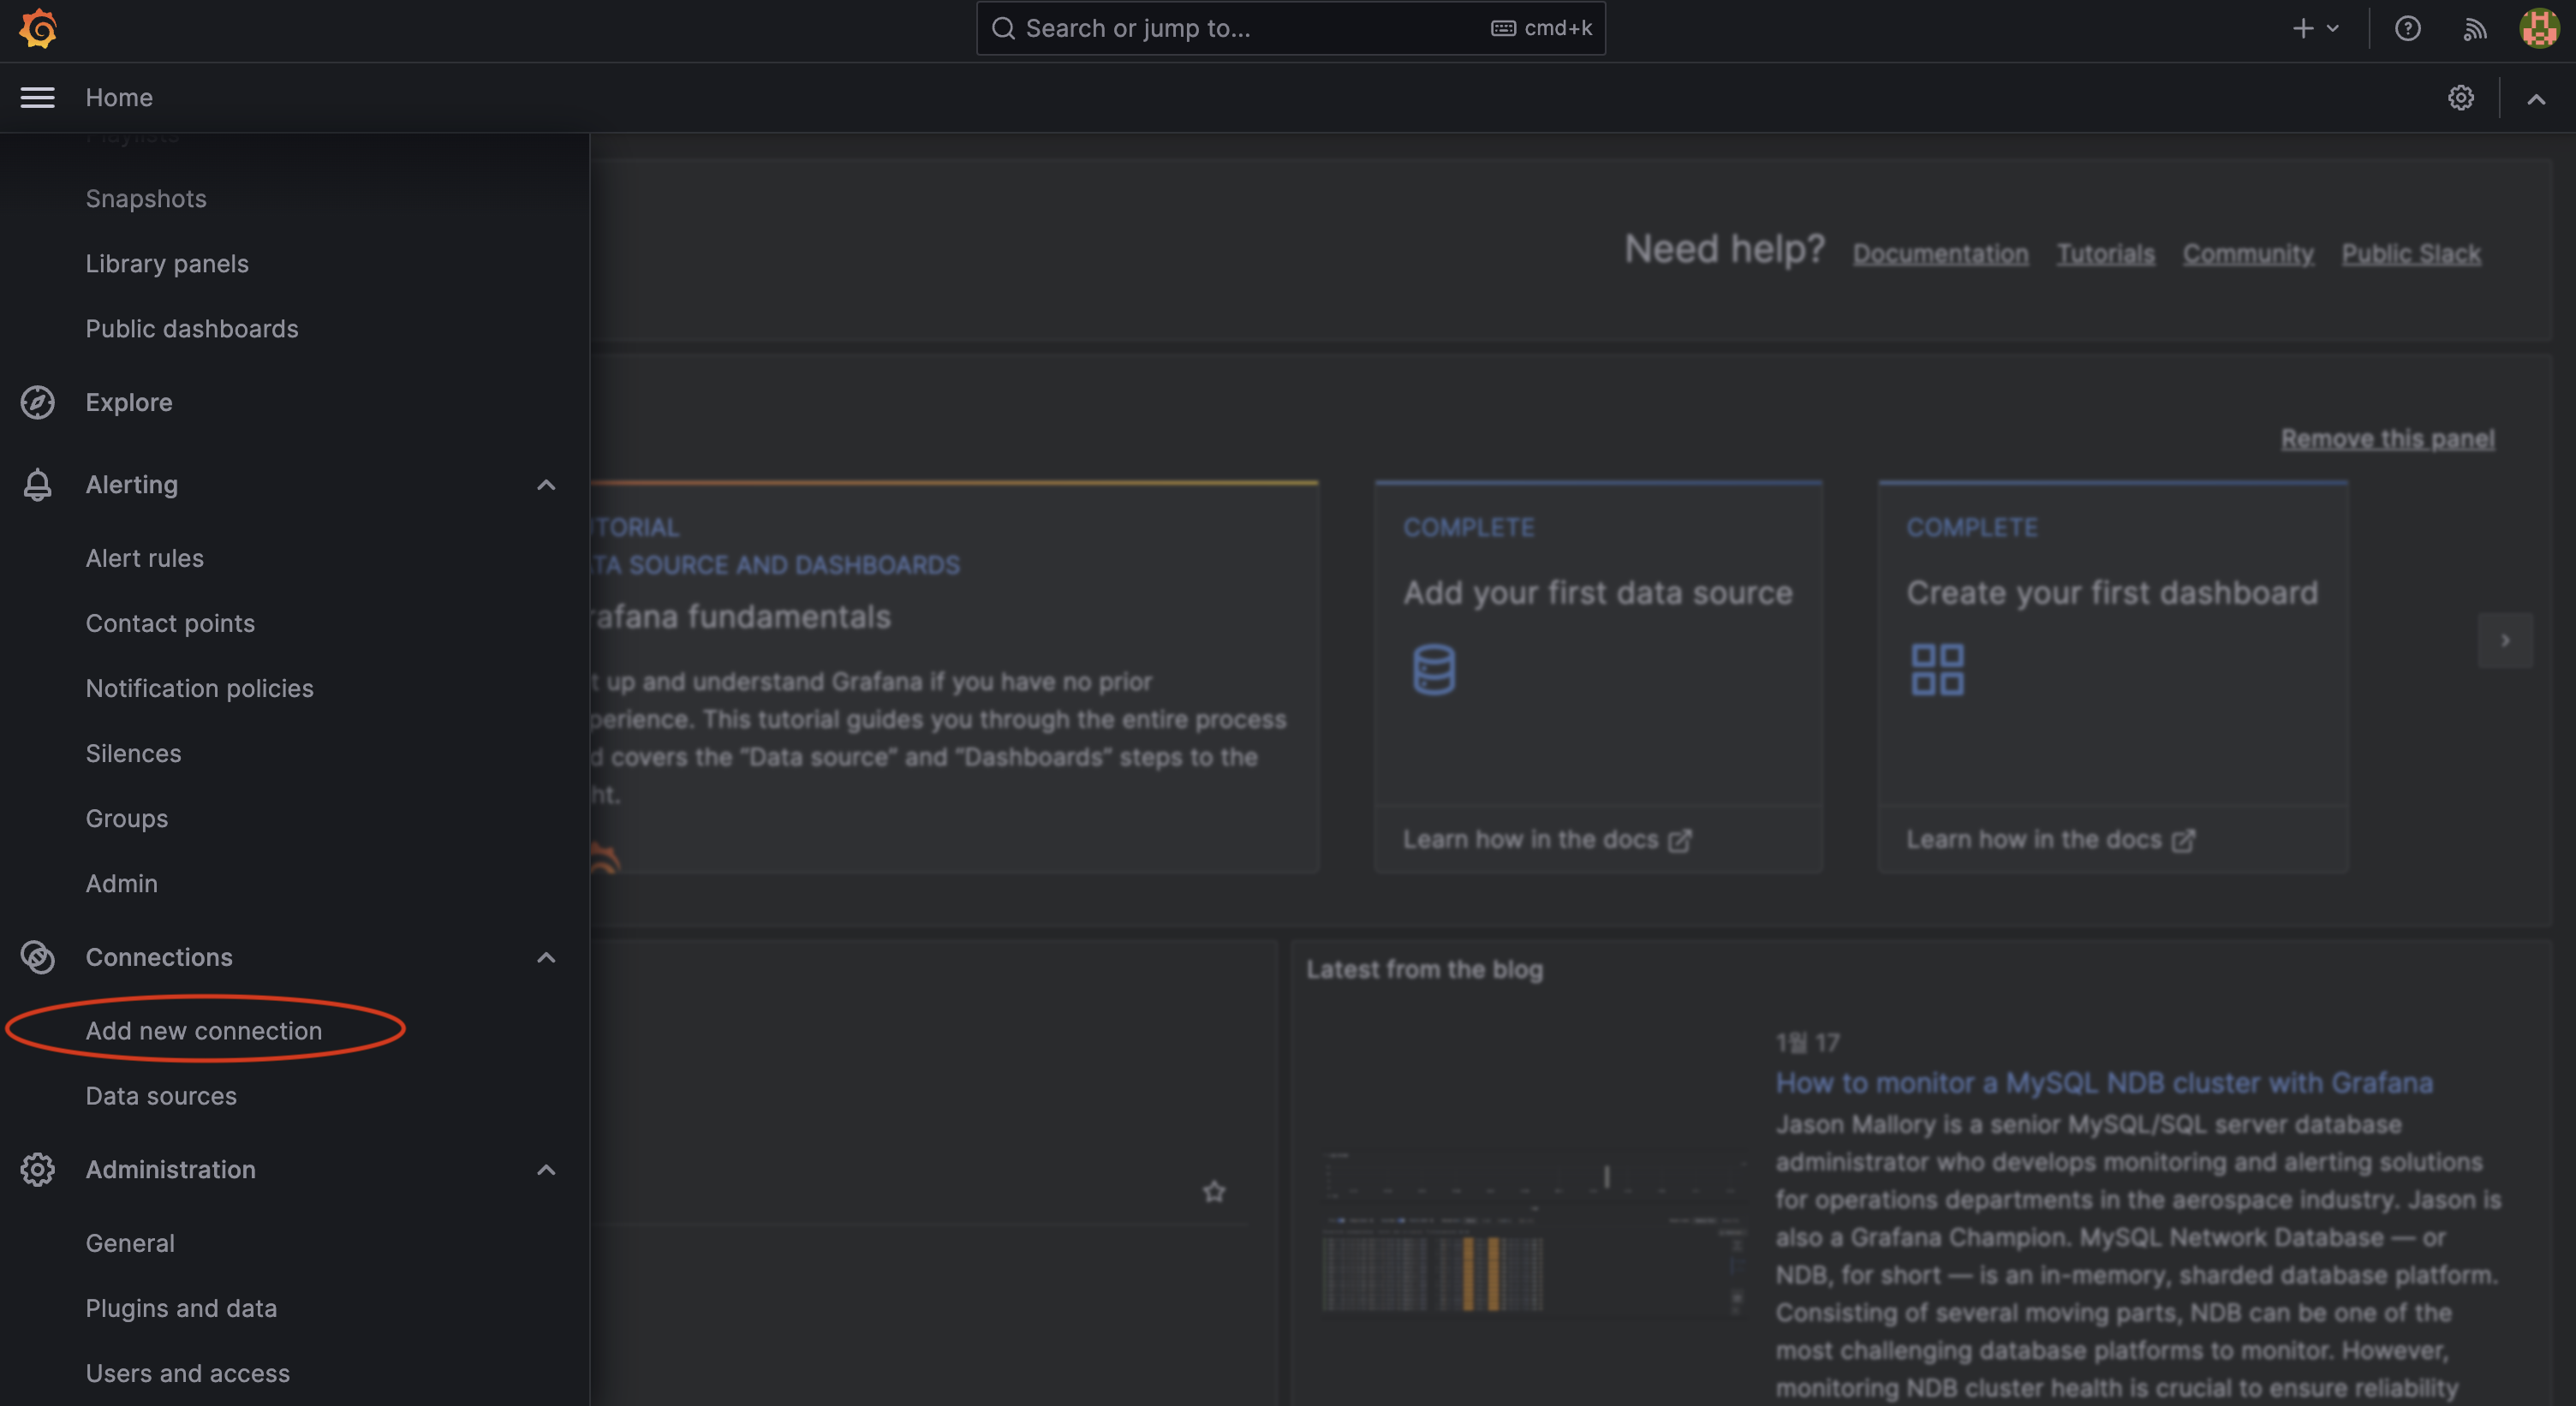
4. 데이터 소스 추가하기
Grafana 서버로 접속하여 Add new connection 클릭
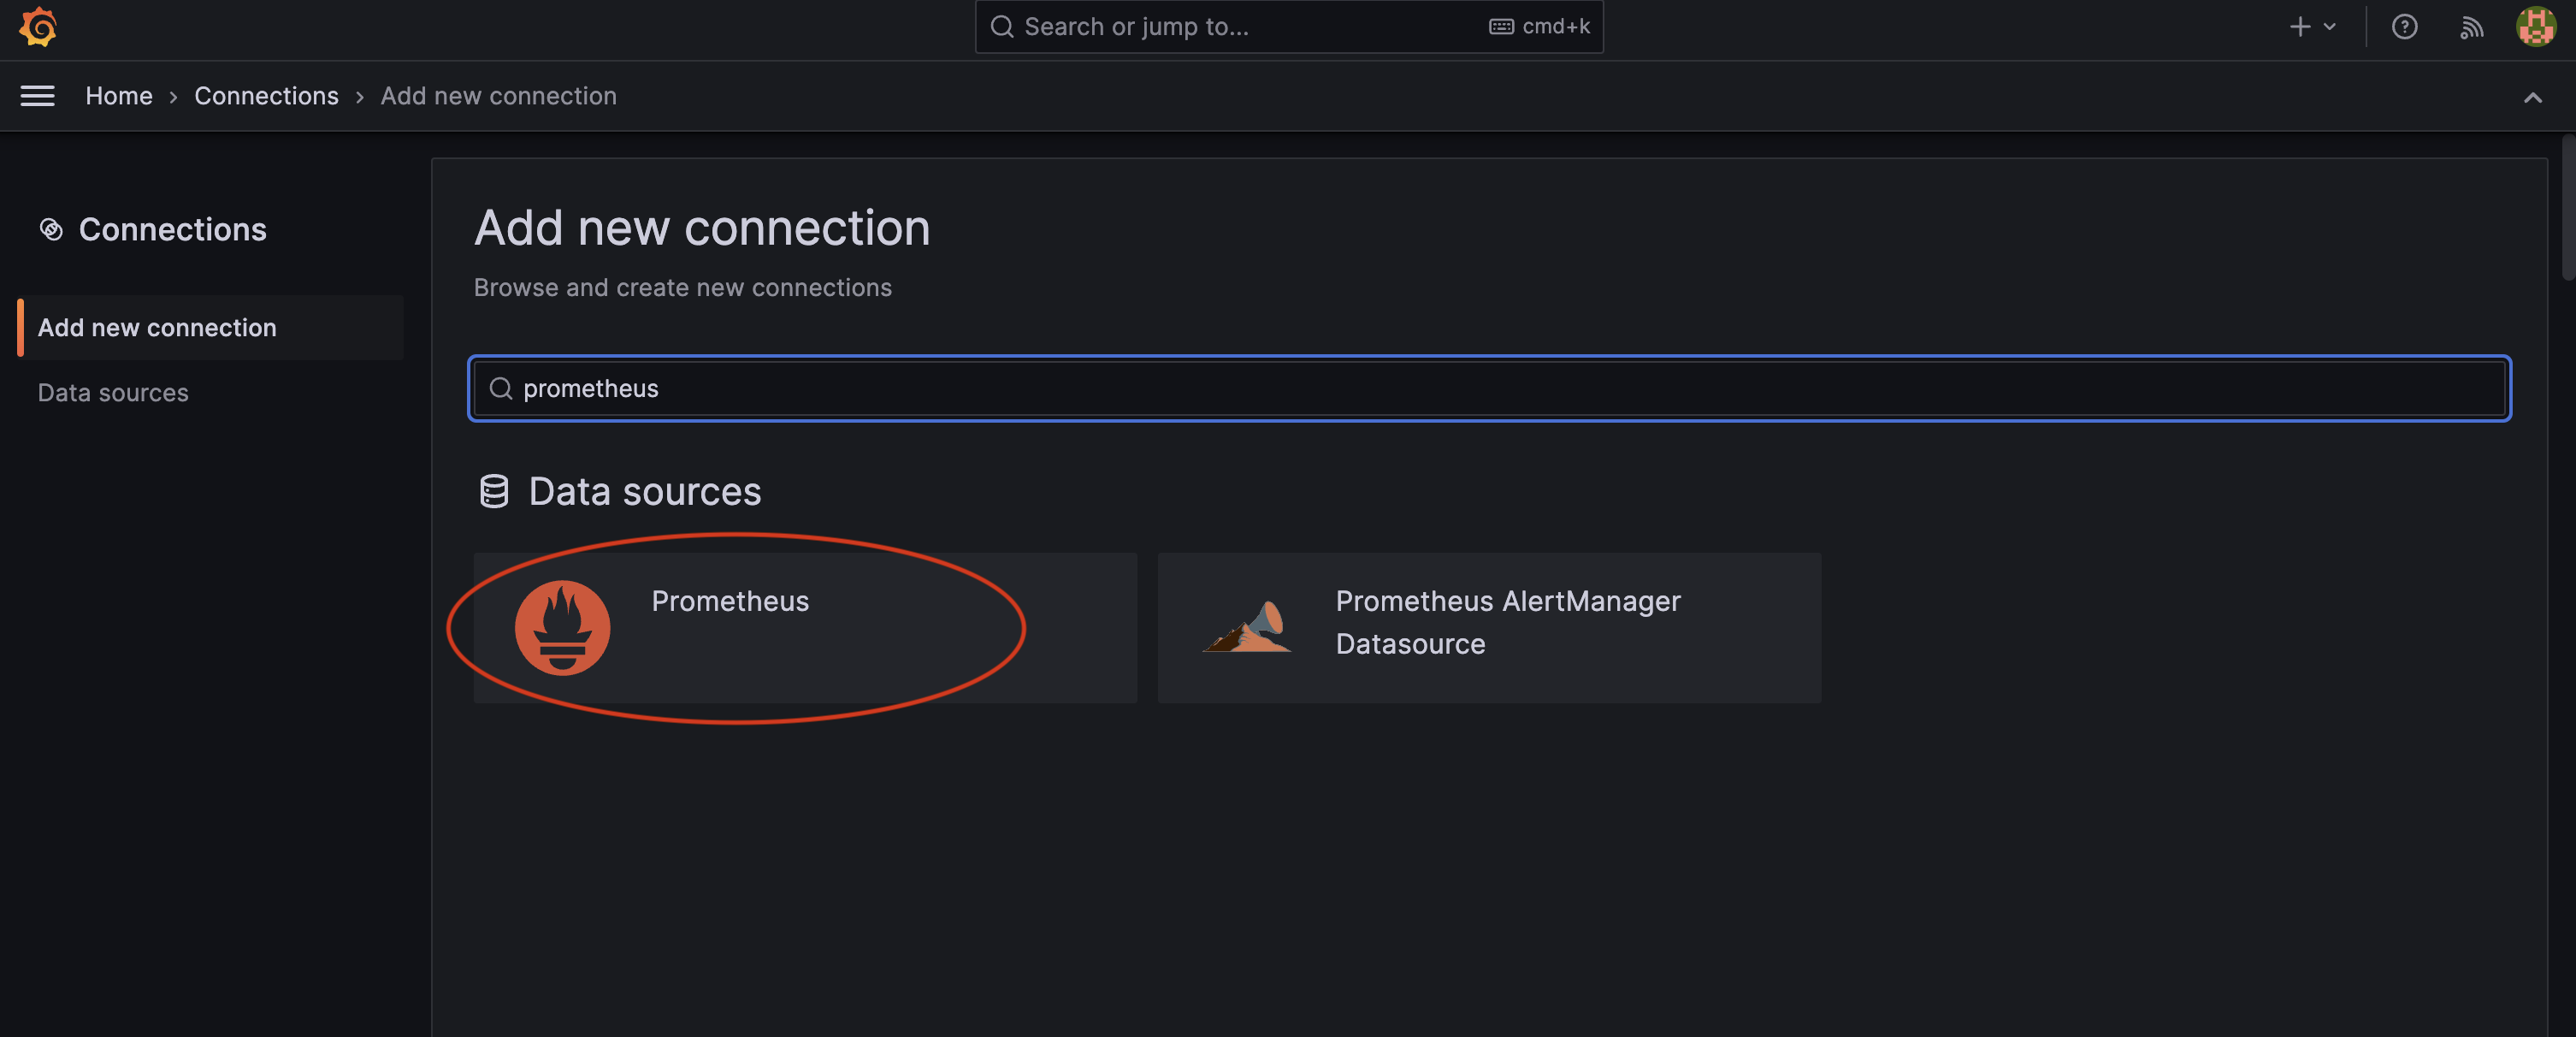
prometheus 검색, 데이터 소스 추가
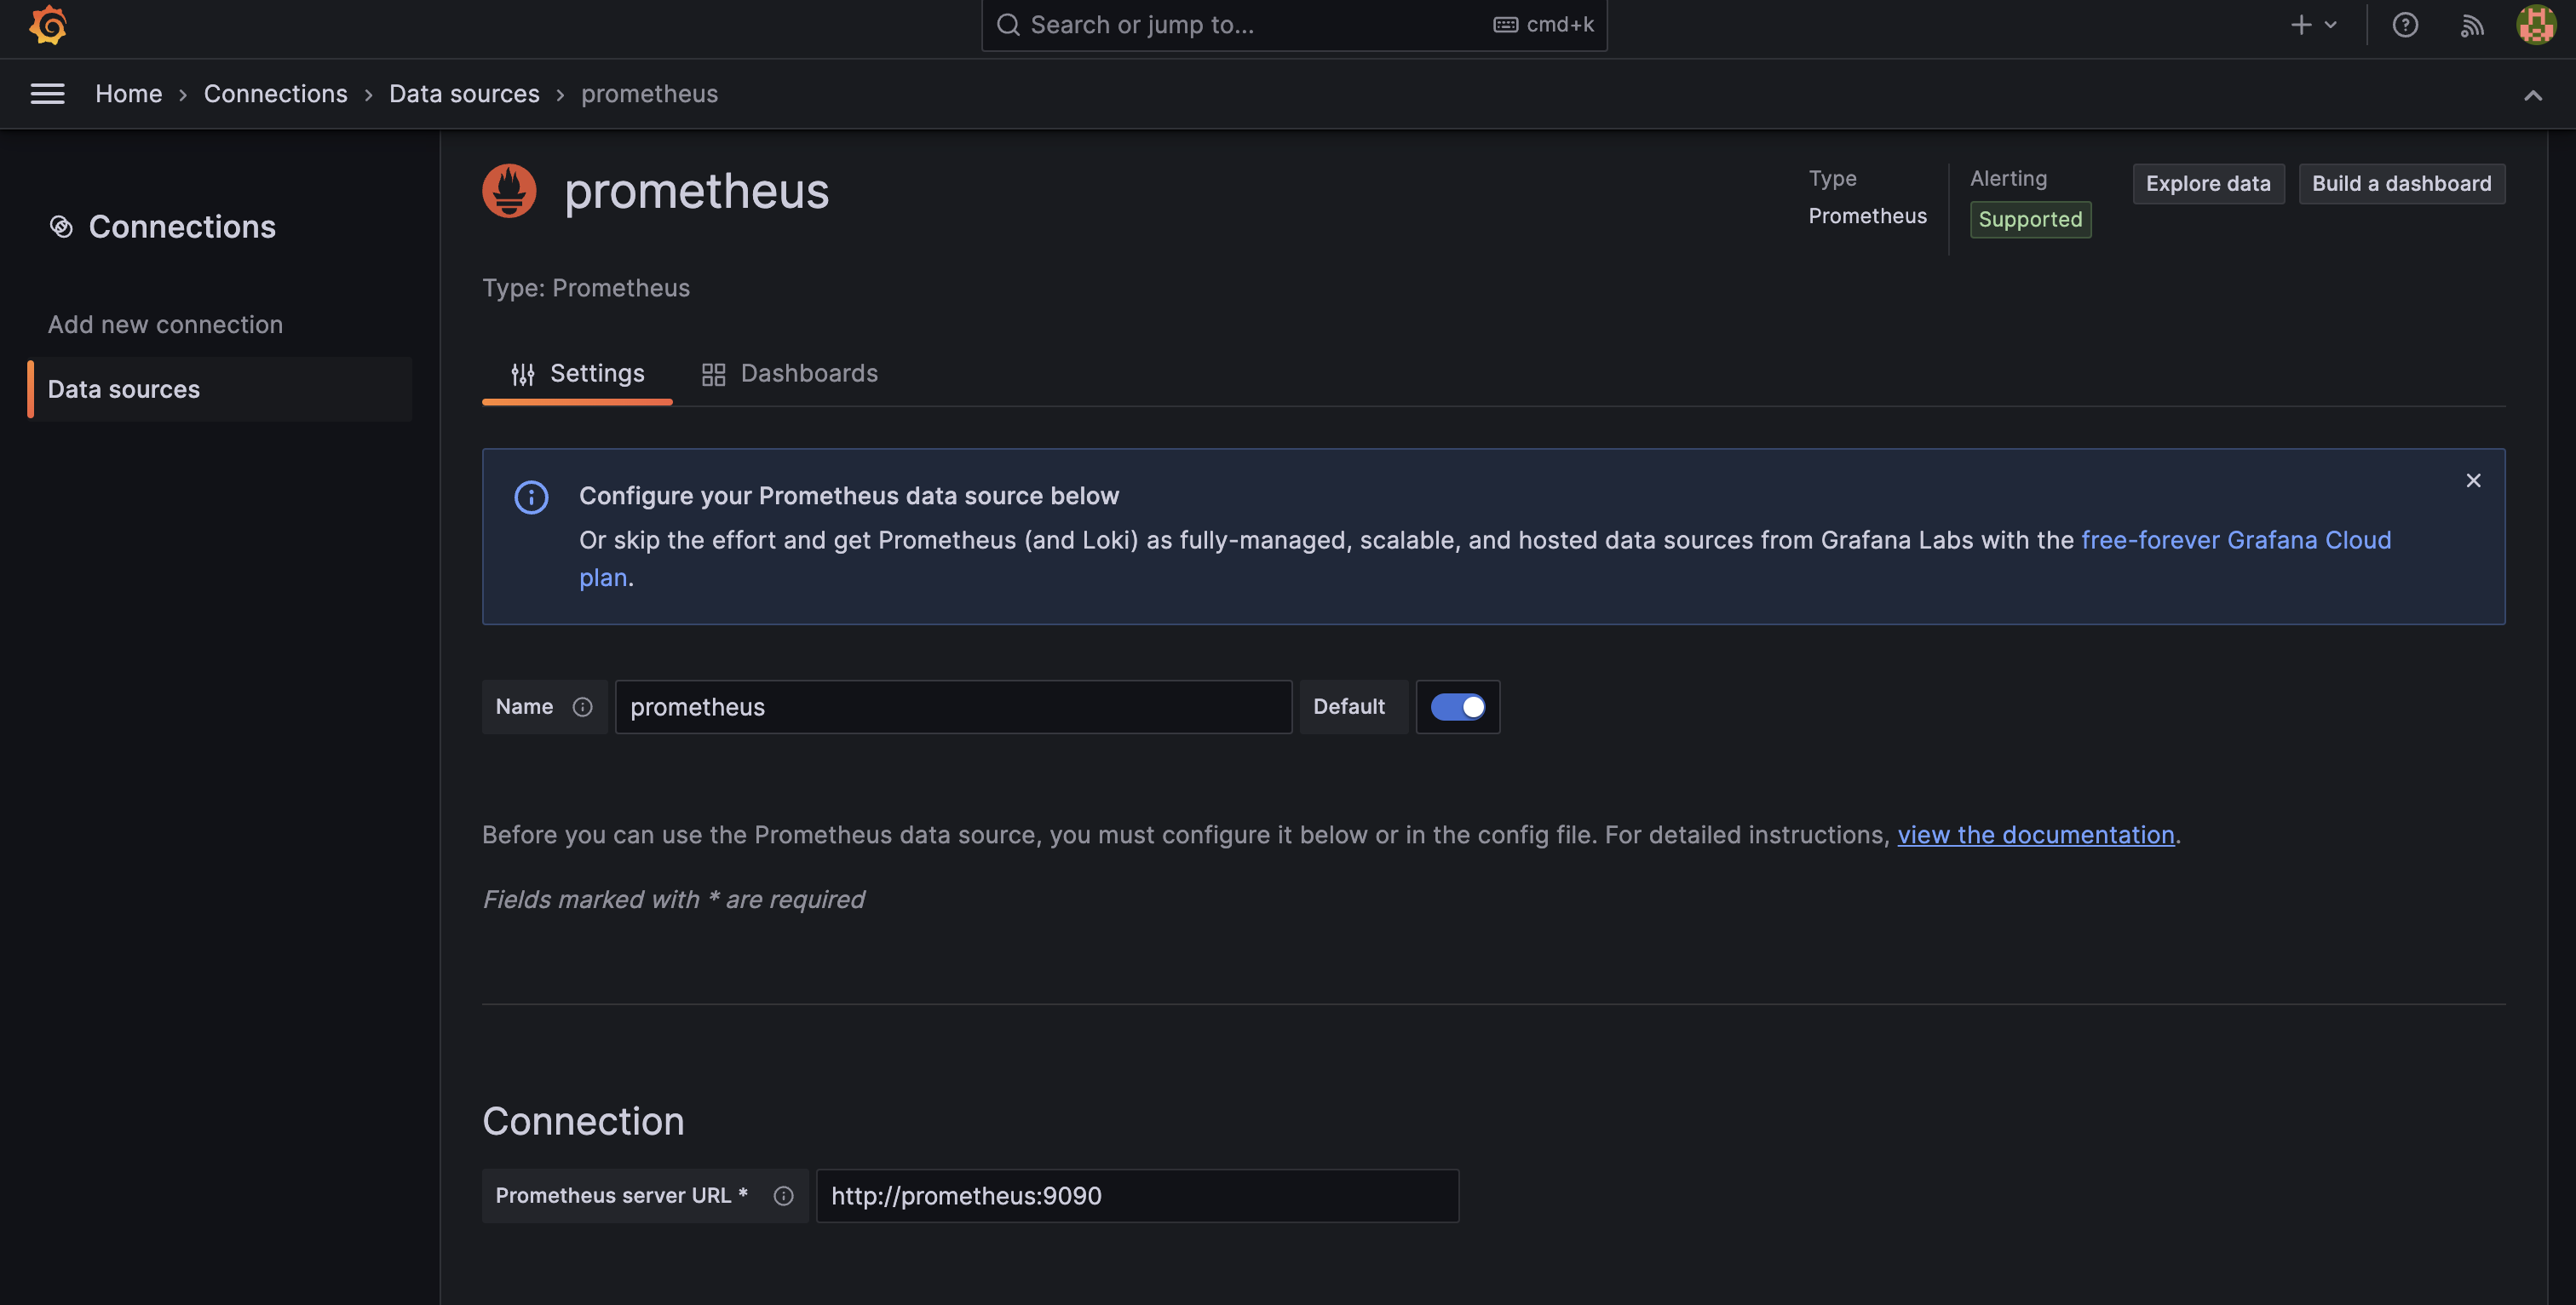
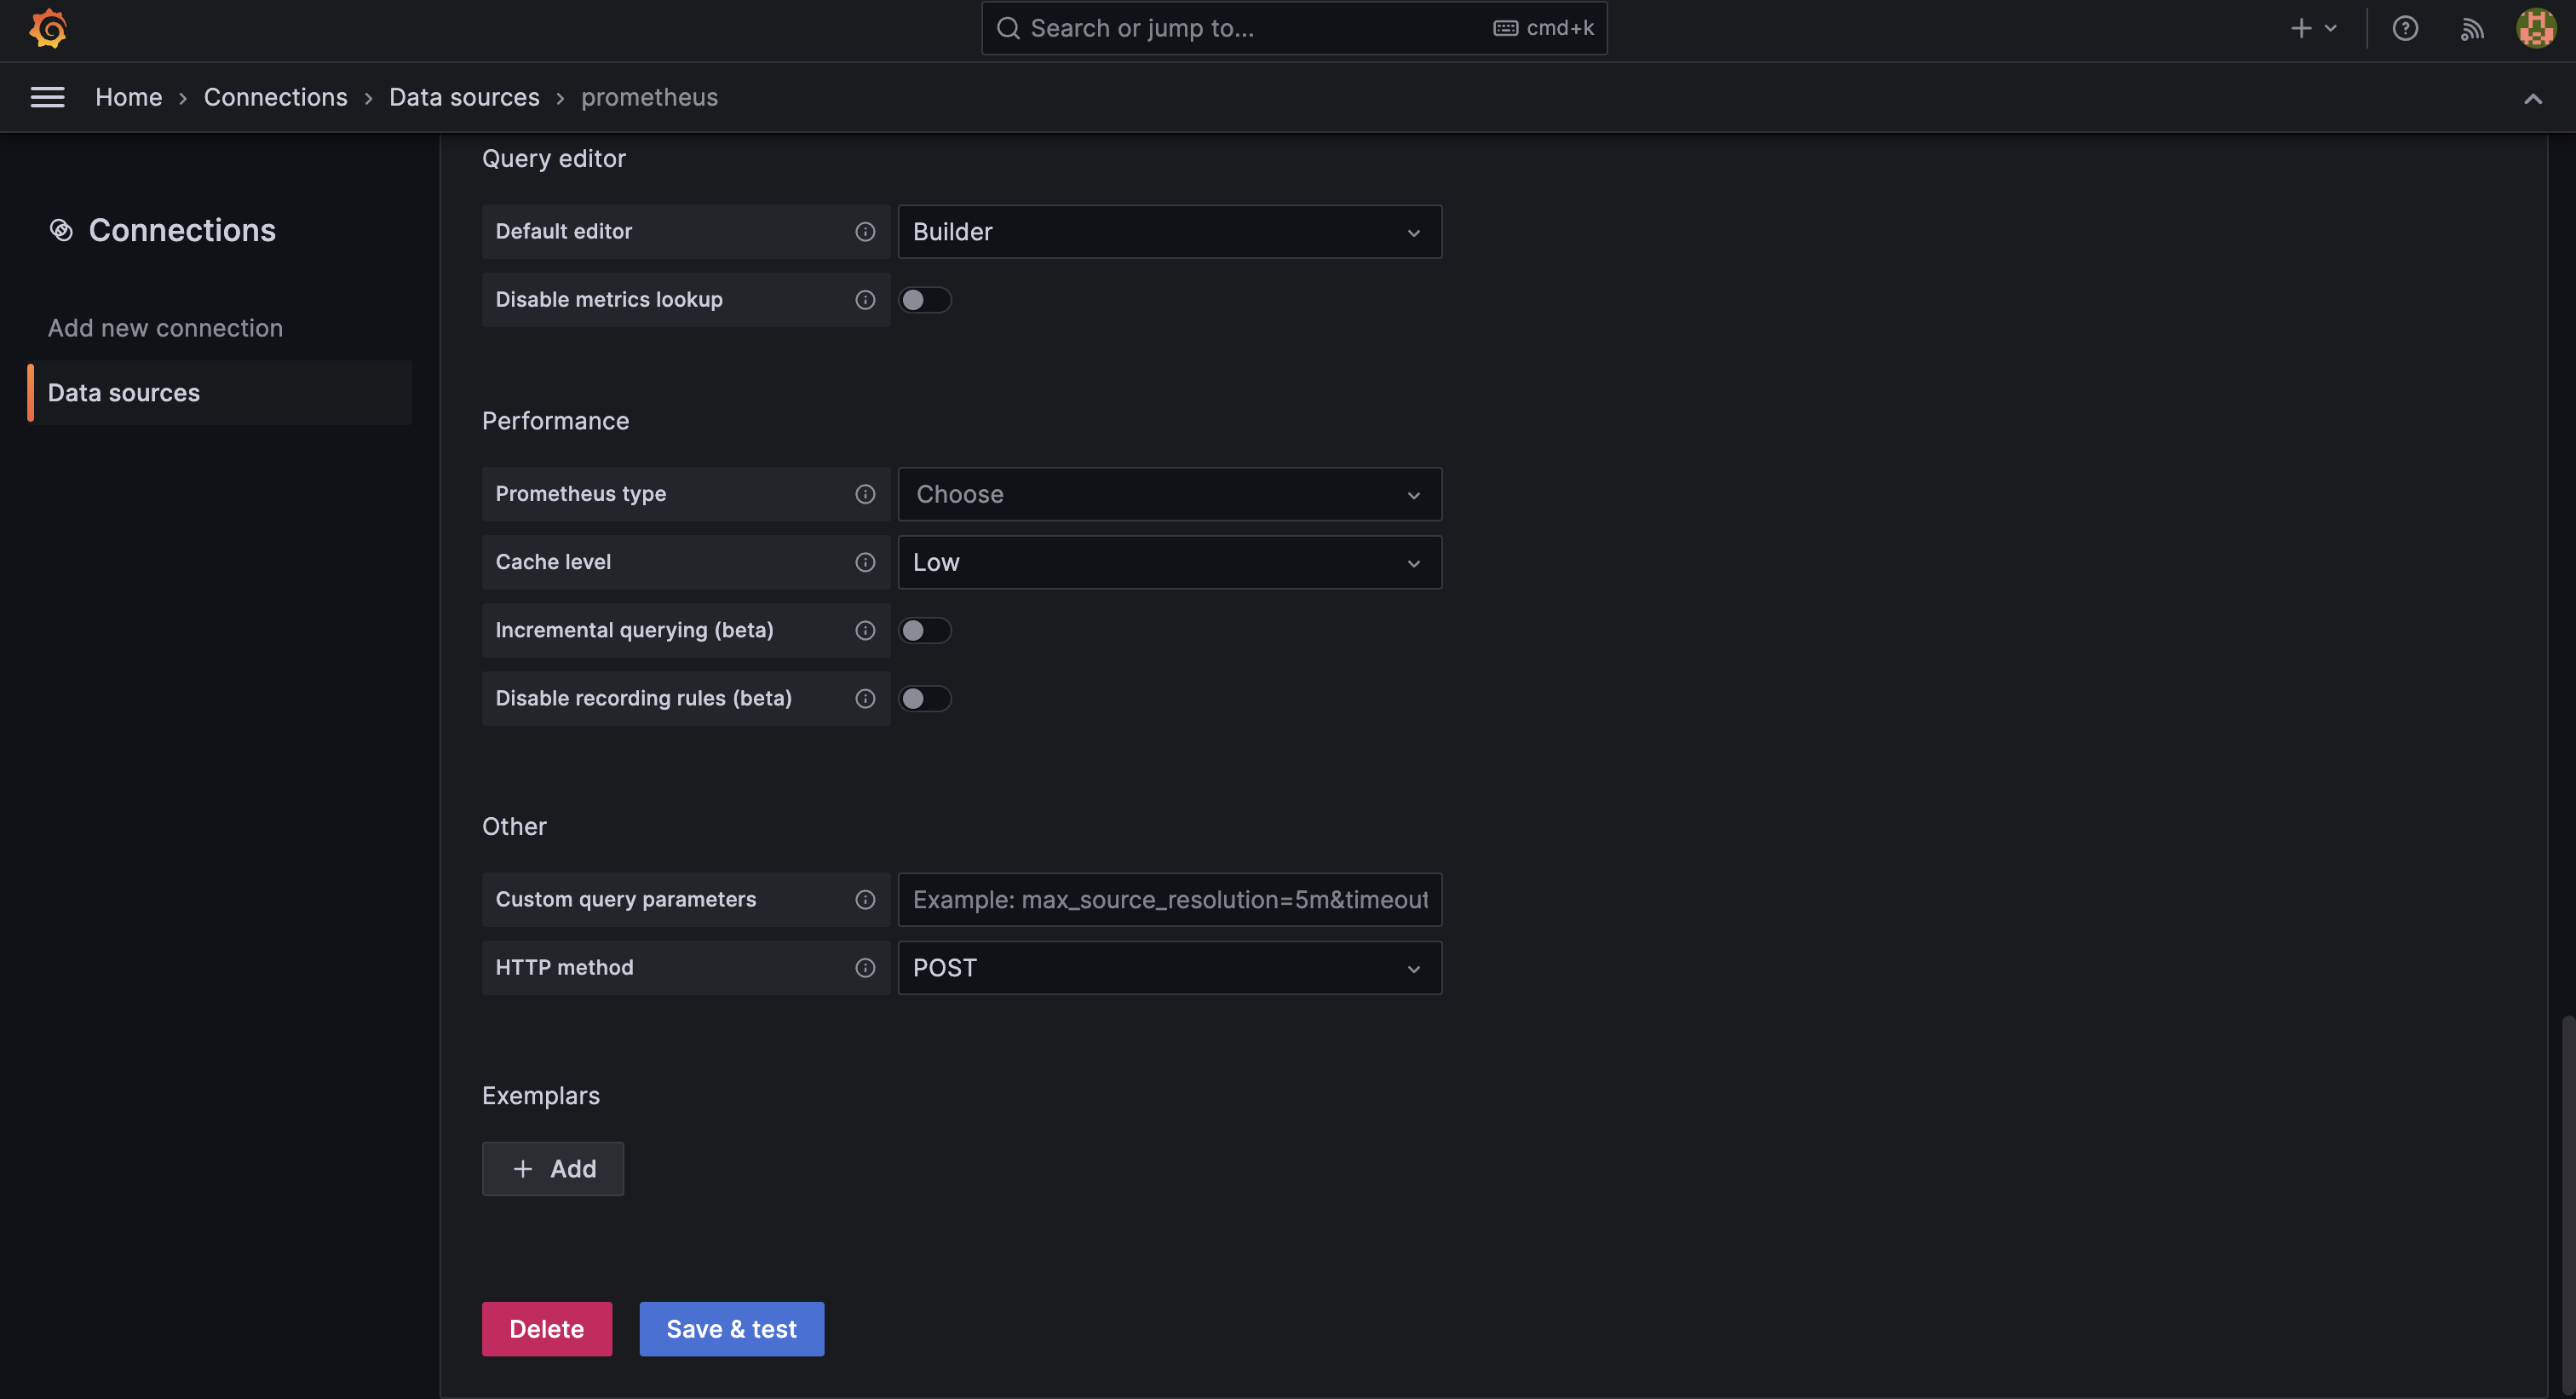
Prometheus server URL에 http://prometheus:9090 입력. Save&test를 눌러 저장
5. 대시보드 생성
대시보드를 아예 새로 만드는 것이 아니라 템플릿을 이용하여 좀 더 간단하게 대시보드를 생성하겠다.
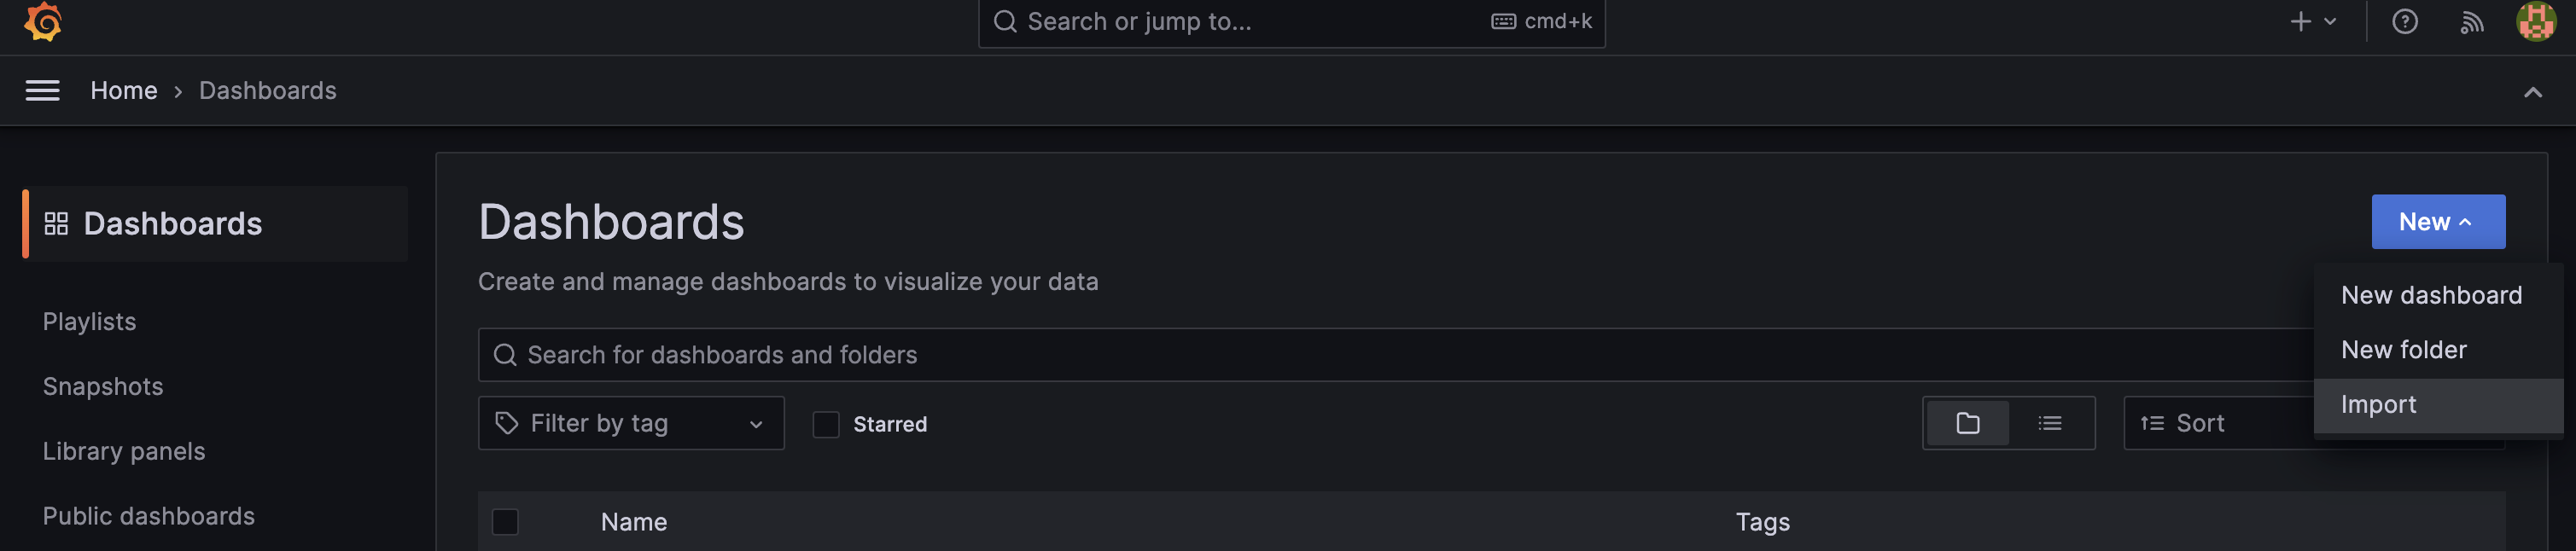
Dashboards에 들어가서 Import클릭
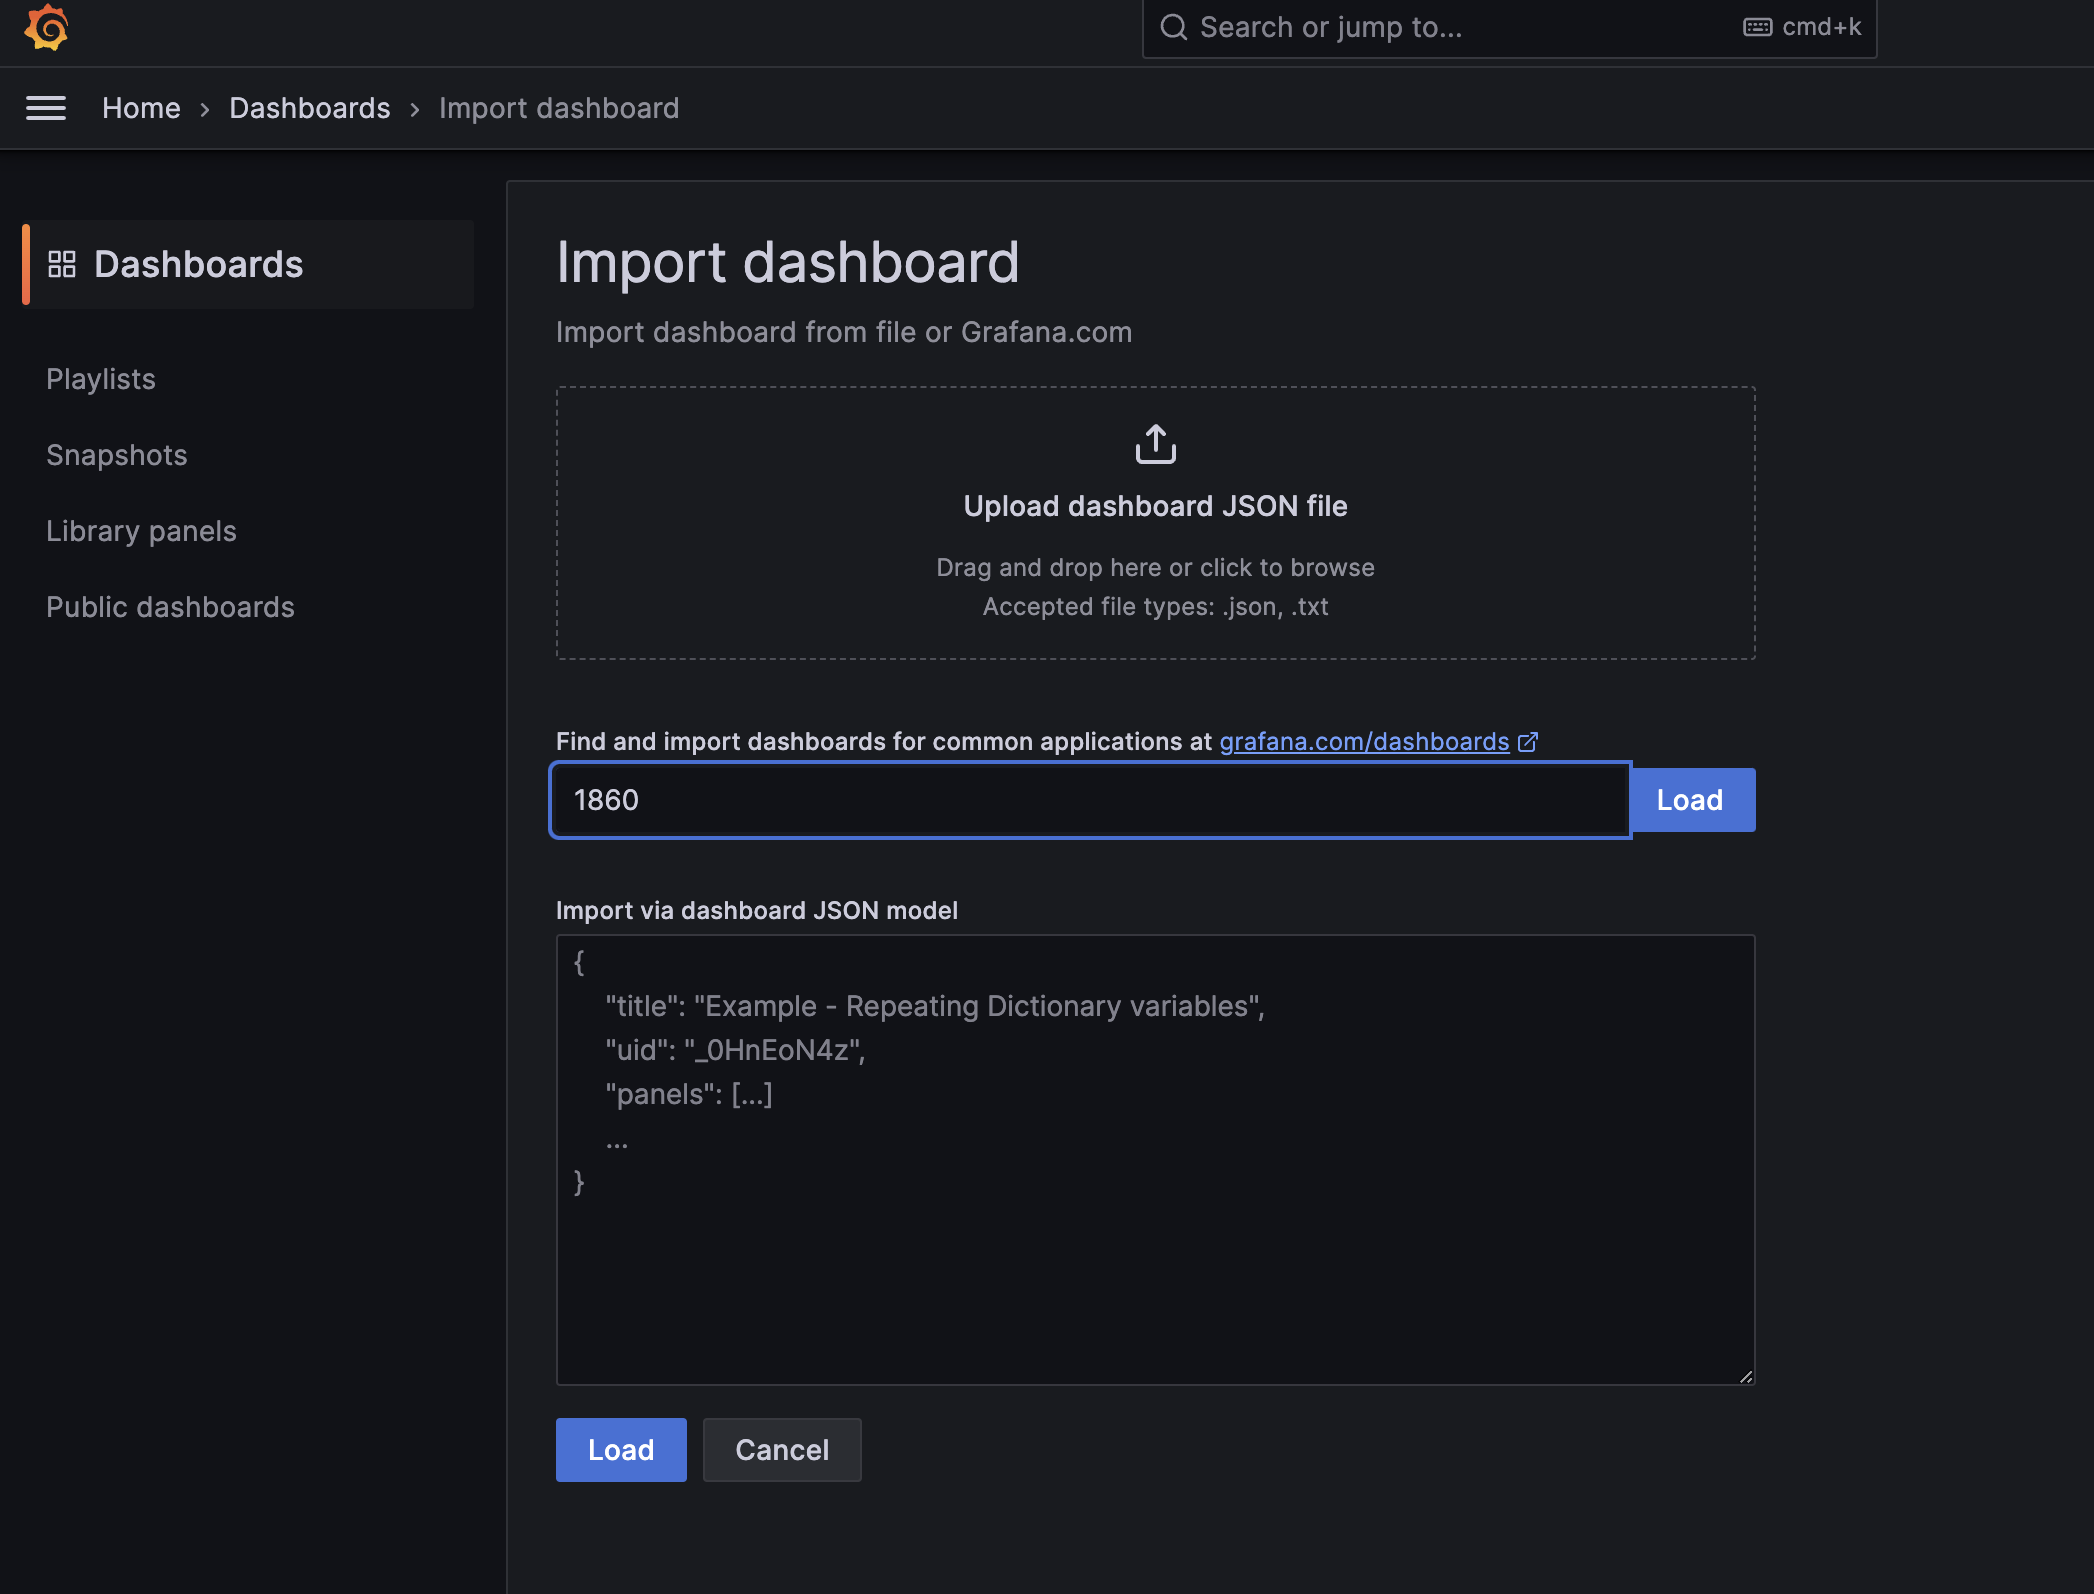
템플릿의 Id에 1860을 입력 하고 Load 클릭. 만약 다른 템플릿을 적용하고 싶다면 https://grafana.com/grafana/dashboards/ 사이트에 접속하여 원하는 템플릿의 Id를 복사하면 된다.
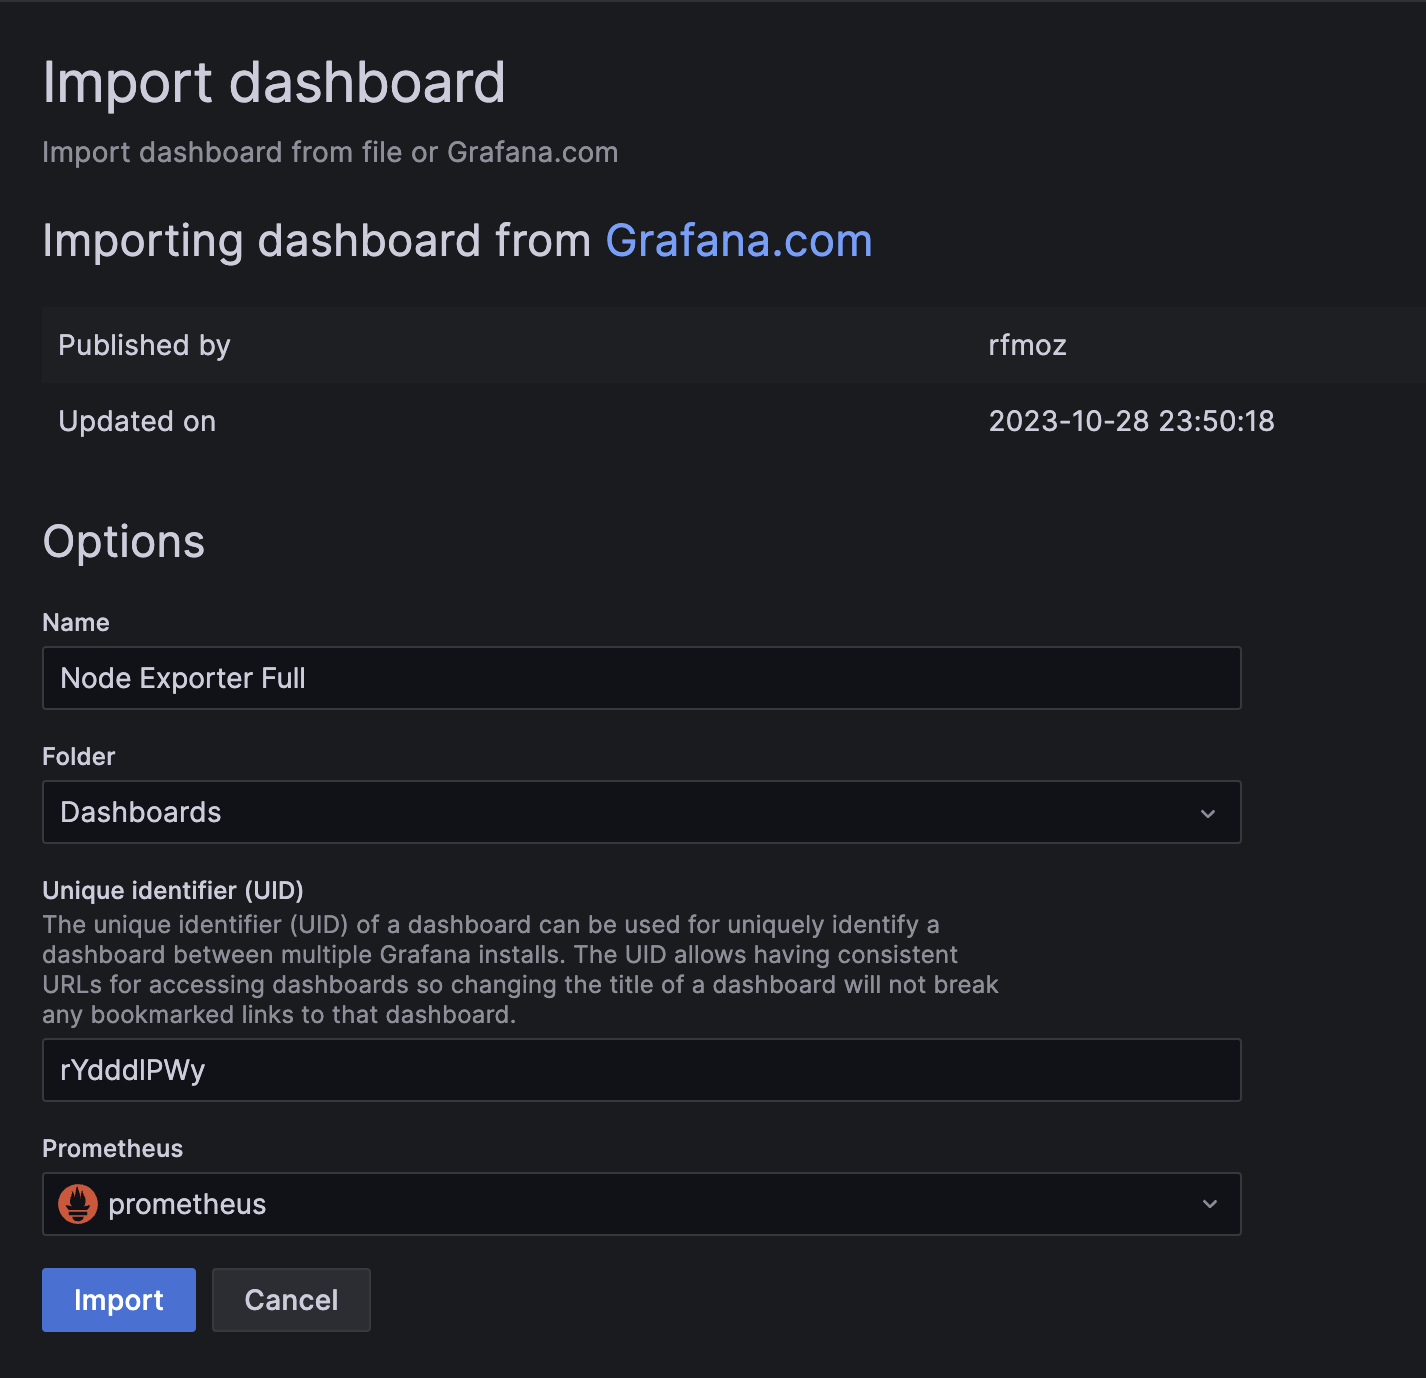
다음과 같이 데이터 소스를 prometheus로 설정하고 Import한다.
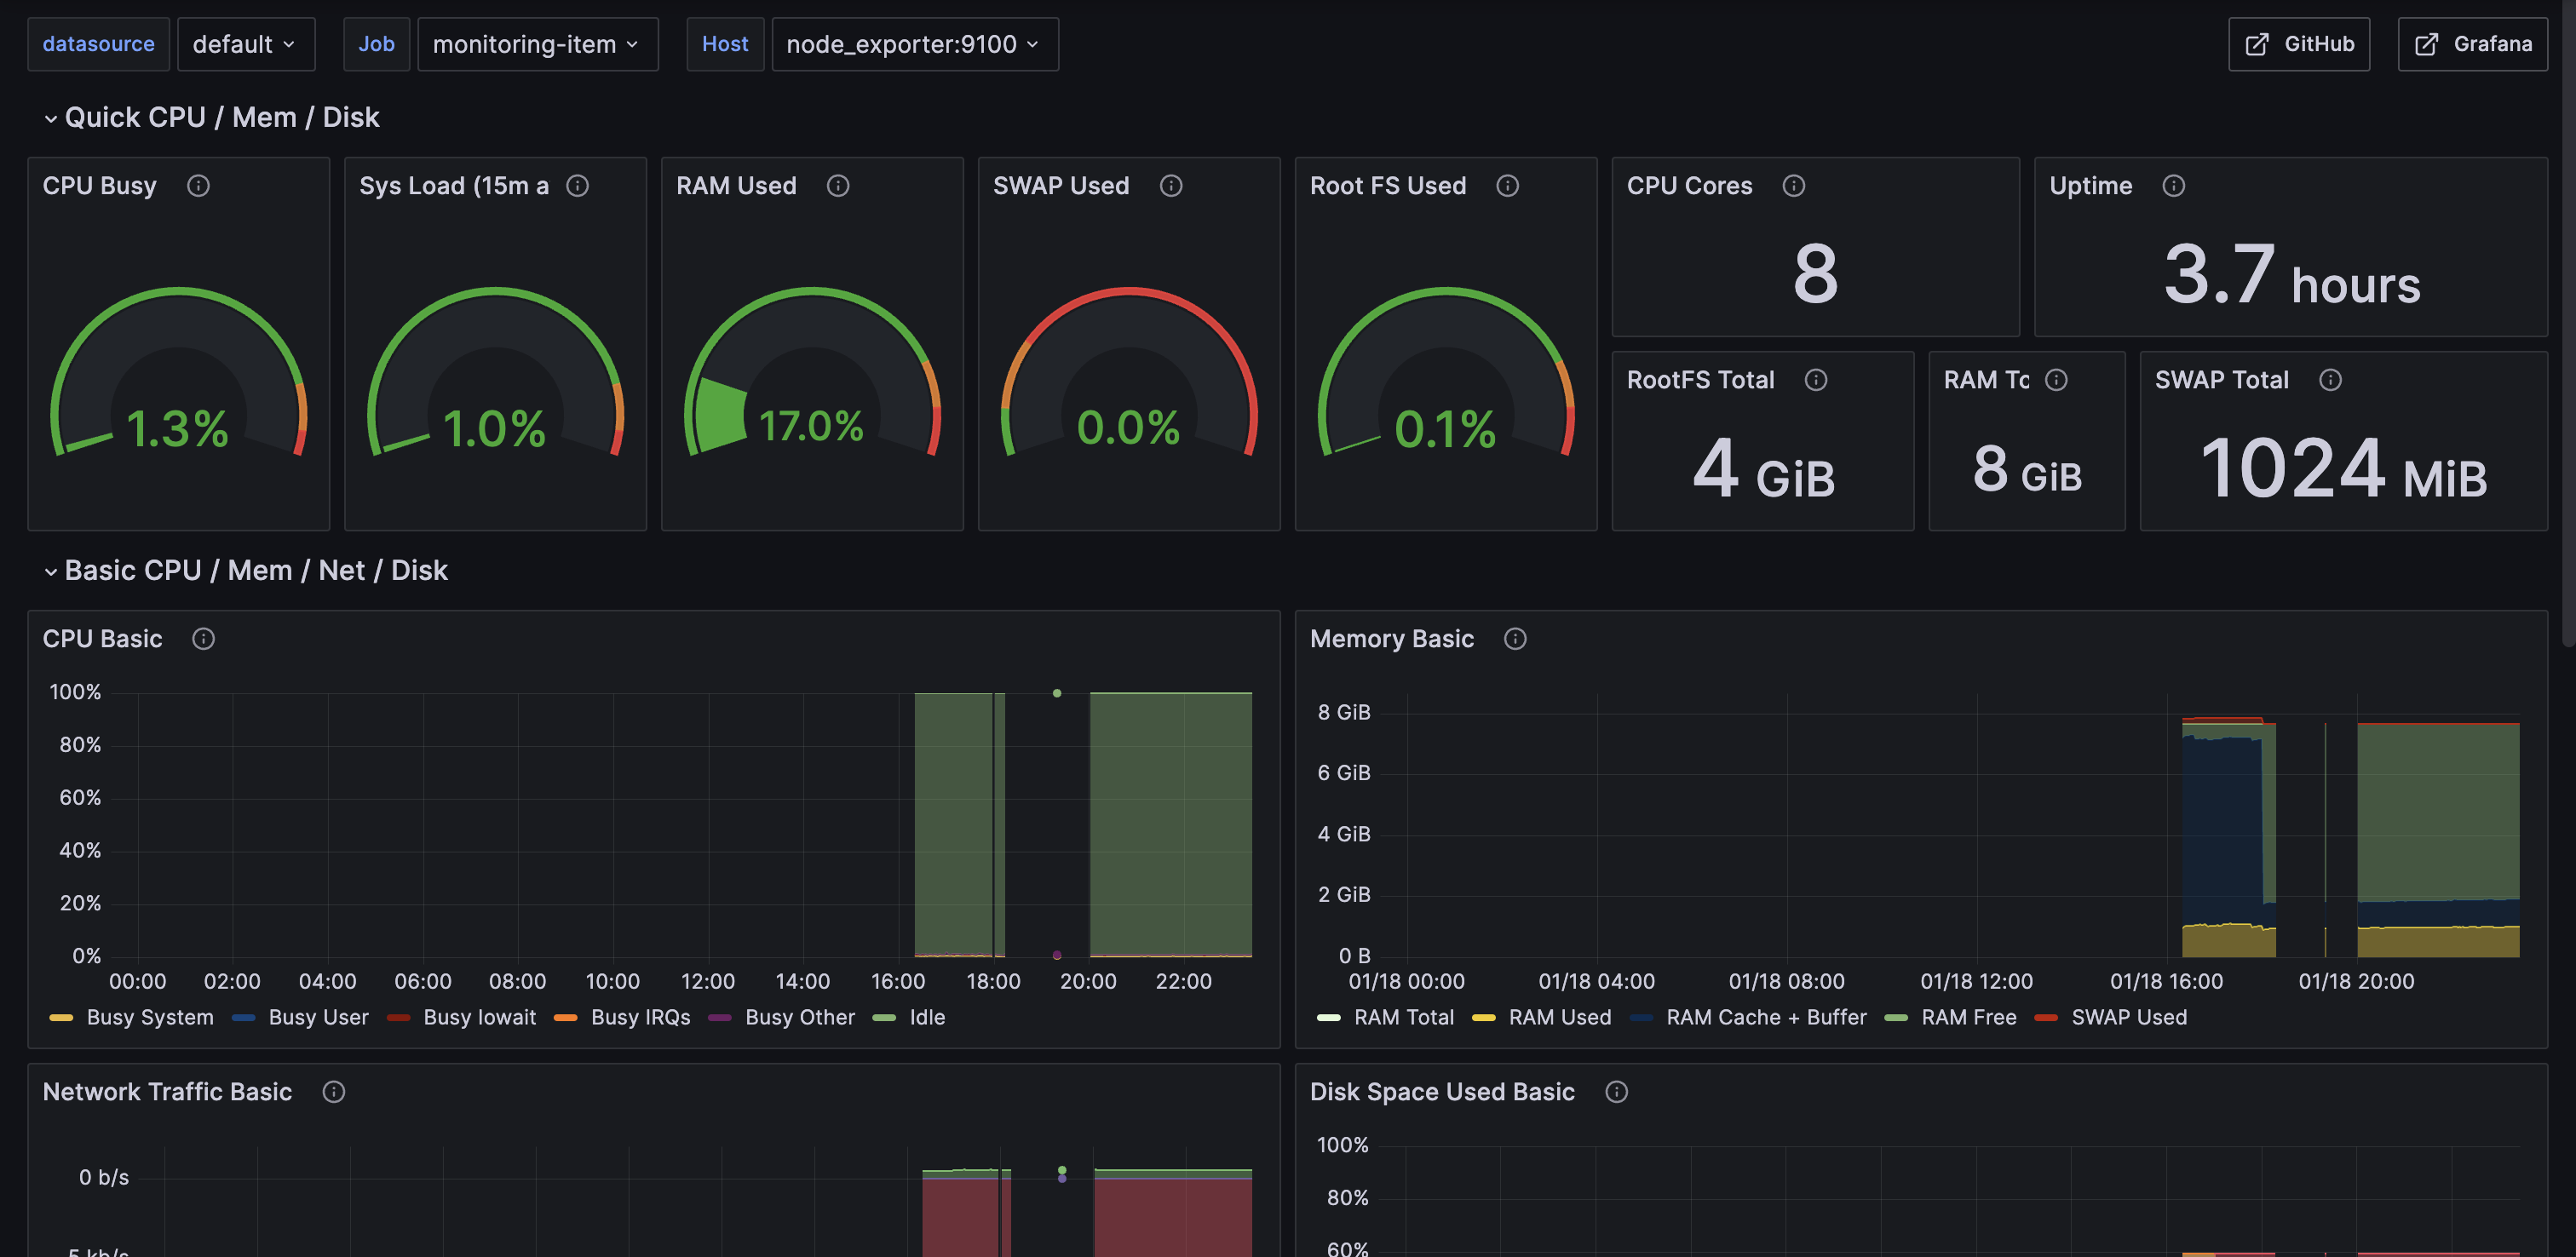
아래와 같이 대시보드가 완성되었다! 이제 Node Exporter를 통해 서버의 메모리, CPU 사용량, Network Traffic 등을 모니터링 할 수 있다.


안녕하세요~~