[정리] Deep transfer learning and data augmentation improve glucose levels prediction in type 2 diabetes patients(Yixiang Deng, NPJ digital medicine 2021)
Author : Yixiang Deng , Lu Lu , Laura Aponte , Angeliki M. Angelidi , Vera Novak , George Em Karniadakis, and Christos S. Mantzoros
Paper Link: https://www.nature.com/articles/s41746-021-00480-x.pdf
Code Link : https://github.com/yixiangD/AccurateBG
Supplymentary inform : https://static-content.springer.com/esm/art%3A10.1038%2Fs41746-021-00480-x/MediaObjects/41746_2021_480_MOESM1_ESM.pdf
[Abstract]
- 제 2형 당뇨병에 있어서 혈당 변화에 대한 정확한 예측은 혈당을 조절하고 합병증의 발생을 예방하기 위해 필수적이다.
- 특히 저혈당 증상은 중증이나 혼수상태, 사망으로 이어질 가능성이 높기 때문에 저혈당이 발생할 경우 정확히 예측을 해야 위급 상황을 예방할 수 있다.
- 하지만
- (1) patient-specific 딥러닝 모델을 학습하기에는 환자 별 데이터의 양이 너무 작고,
- (2) 저혈당 및 고혈당의 데이터가 정상 데이터에 비해 양이 너무 적기 때문에(특히 저혈당은 더욱 적기 때문에) 데이터 불균형으로 인해 학습이 잘못된 방향으로 가는 문제가 있다.
- 이 두 문제를 Transfer learning과 data augmentation을 사용하여 해결하려 함
- 3 종류의 neural network / 4 종류의 loss function / 4 종류의 transfer-learning 방법 / 4종류의 data augmentation 방식을 테스트 및 비교 진행
- 여러 모델과 metrics를 실험하고 비교함으로써 가장 결과가 좋은 모델과 학습 방법, data augmentation 방법을 제시함
[Introduction]
- 풀고자 하는 문제
- Human-specific 딥러닝 모델에 사용할 각 환자의 데이터 부족
- 데이터 불균형
- 논문에서 제시한 솔루션
- Transfer learning과 data augmentation을 사용
- 3 종류의 neural network / 4 종류의 loss function / 4 종류의 transfer-learning 방법 / 4종류의 data augmentation 방식을 테스트 및 비교 진행
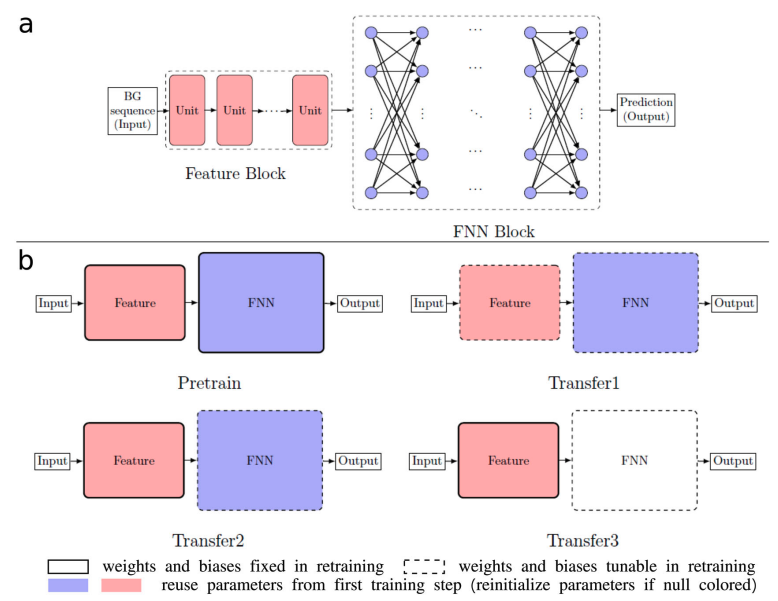
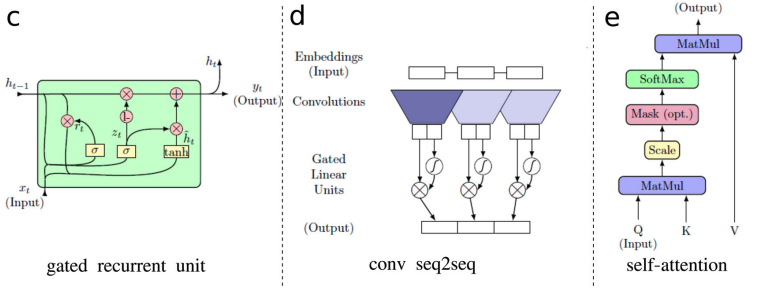
- 3 Neural networks
- RNN with GRU cell (GRU size 10, 2 GRUs; 1 FNN layer with width 10)
- Gated convolutional neural networks(CNN) (1-D convolutional kernel with size 4, 4 conv seq2seq units; 3 FNN layers with width 10)
- Self-attention networks(SANs) (8 self-attention units; 4 FNN layers with width 10)
-
4 Loss functions
- Mean absolute error
- Relative mean absolute error
- Mean squared error
- Relative mean squared error
-
4 Transfer learning strategies
- None(Pretrained)
- Transfer1 : Reuse weights of feature block and FNN block, retrain both blocks
- Transfer2 : Reuse weights of feature block and FNN block, retrain only FNN block
- Transfer3: Reuse weights of feature block, reinitialize FNN block, retrain FNN block
-
4 Data Augmentation starategies
- Repeat existing samples
- Add random noises
- Mixup: Linearly interpolating between samples in the training dataset
- TimeGAN (designed specially for time-series prediction tasks)
[Methods]
-
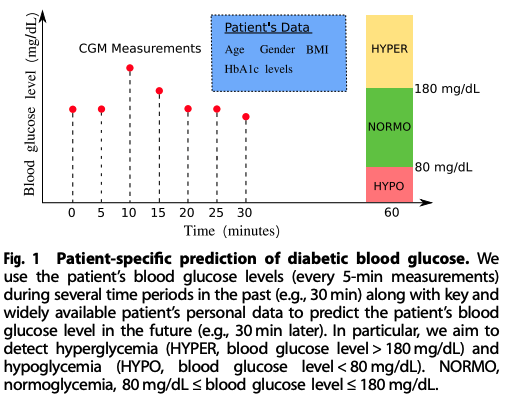
두 가지 분류법 사용 및 비교 → (1) Hypo(저혈당) / No hypo(정상) & (2) hypo(저혈당) / normal(보통) / hyper(고혈당)
-
저혈당과 고혈당의 기준 :
Hyperglycemia >180mg/dL,
Hypoglycemia <80mg/dL (CGM underestimates by 10mg/dL)
-
Dataset
- T2D (제 2형 당뇨)
- IRB of the Beth Israel Deaconess Medical Center
- BG level was measured every 5 min by a Continuous Glucose Monitoring System
- 40 outpatients with diabetes (19 males; age 65 ± 8 years BMI at 30 ± 5; with a mean HbA1c level at 7.33%), who contributed a mean of 130.6 mg/dL blood glucose level through CGM (BG ranging from 40 to 400 mg/dL)
- T1D (제 1형 당뇨): Ohio T1DM
- documenting the CGM history and physiological measurements(the glucose level, insulin dosage, exercise and other metabolism readings) of 12 patients with type 1 diabetes ( 이 중 6명은 2018 버전, 다른 6명은 2020 버전 데이터)
- T2D (제 2형 당뇨)
-
4 classification metrics 사용
- Sensitivity
- Positive predictive value(PPV)
- Specificity
- Negative predictive value(NPV)
[Result]
Prediction Part : 어떤 모델과 Transformer 방식이 혈당 예측을 잘하는 지 확인
-
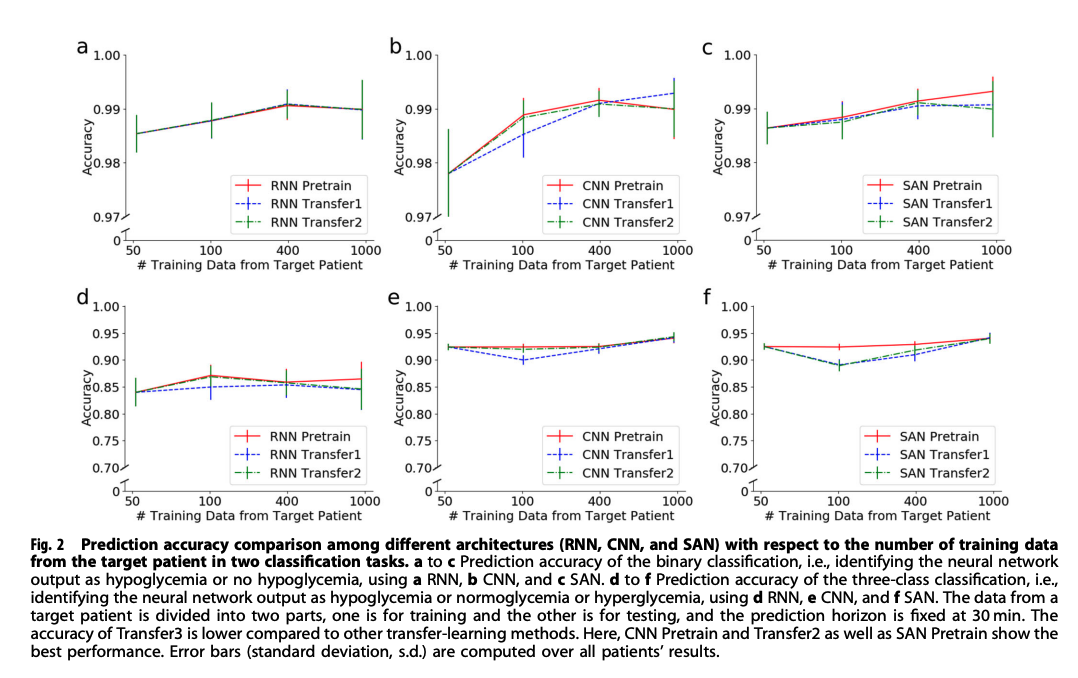
Prediction accuracy comparison among RNN, CNN, SAN
- 비교 대상
- RNN Pretrained / RNN Transfer1 / RNN Transfer2 / RNN Transfer3
- CNN Pretrained / CNN Transfer1 / CNN Transfer2 / CNN Transfer3
- SAN Pretrained / SAN Transfer1 / SAN Transfer2 / SAN Transfer3
- Transfer3의 정확도는 전체적으로 낮게 나옴
- CNN Pretrained와 CNN Transfer2, SAN Pretrain이 가장 성능이 좋음
- 비교 대상
-
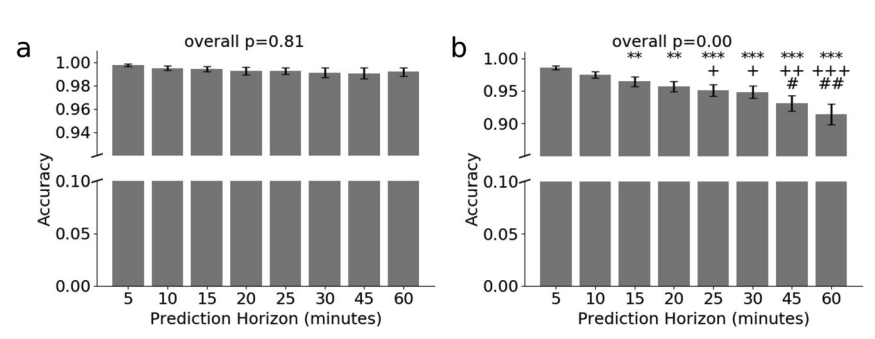
Prediction accuracy for two classification tasks given different prediction horizons using the best CNN model
- 카테고리를 두 개로 설정할 때(Hypo(저혈당) / No hypo(정상))와 세 개로 설정할 때(Hypo(저혈당) / Normal(보통) / Hyper(고혈당))의 성능 차이 비교
- 앞 실험 결과에서 성능이 가장 잘 나왔던 CNN 구조 사용
- 비교 대상
- Binary classfication (Hypo(저혈당) / No hypo(정상) )
- Three-class classfication (Hypo(저혈당) / Normal(보통) / Hyper(고혈당))
- Binary classfication에서는 prediction horizon minutes에 따라 별 차이 없었음
- 아래 그림에서 a가 binary, b가 three-class
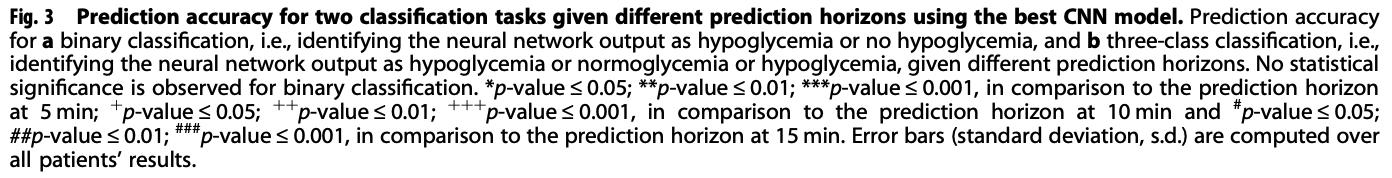
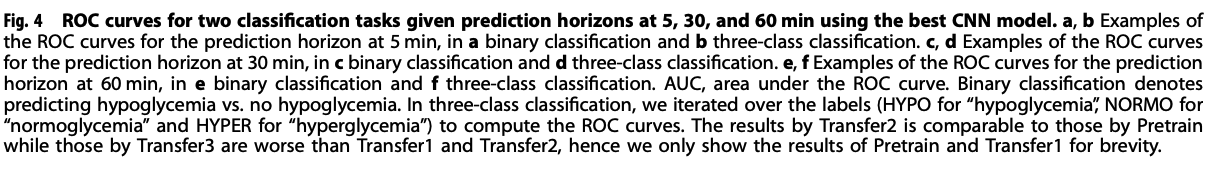
- ROC curves for two classification tasks given prediction horizons at 5, 30, 60 minutes using the best CNN model
- 경과 시간 별로 ROC curve를 비교
- 앞 실험 결과에서 성능이 가장 잘 나왔던 CNN 구조 사용
- 비교 대상
- 5min → binary classification / three-class classification
- 30min → binary classification / three-class classification
- 60min → binary classification / three-class classification
- Transfer2가 Pretrained와 비슷하게 성능이 좋고,
Transfer3는 Transfer1, Transfer2에 비해 성능이 안 좋음
- 그림에서 a,b는 5min, c,d는 30min, e,f는 60min 때의 결과이고, 전체적으로 왼쪽이 binary, 오른쪽이 three-class
Data Augmentation Part
-
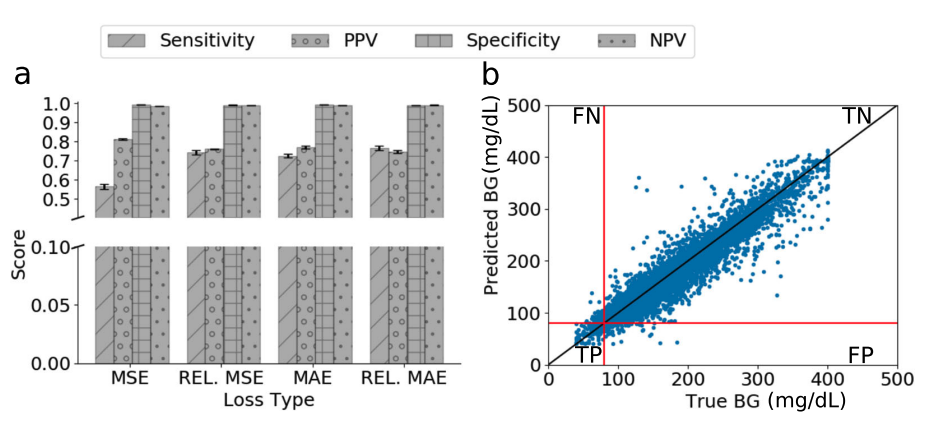
Regression Performance of the best CNN model on the original dataset using 4 different loss functions
- 앞 실험 결과에서 성능이 가장 잘 나왔던 CNN 구조 사용
- 4개의 loss functions을 비교
- Relative mean absolute error를 사용한 모델이 성능이 가장 좋음
- 성능이 좋다 == 4개의 metrics(Sensitivity,Positive predictive value(PPV),Specificity, Negative predictive value(NPV))에 대해 균형적으로 높은 점수를 가진다
-
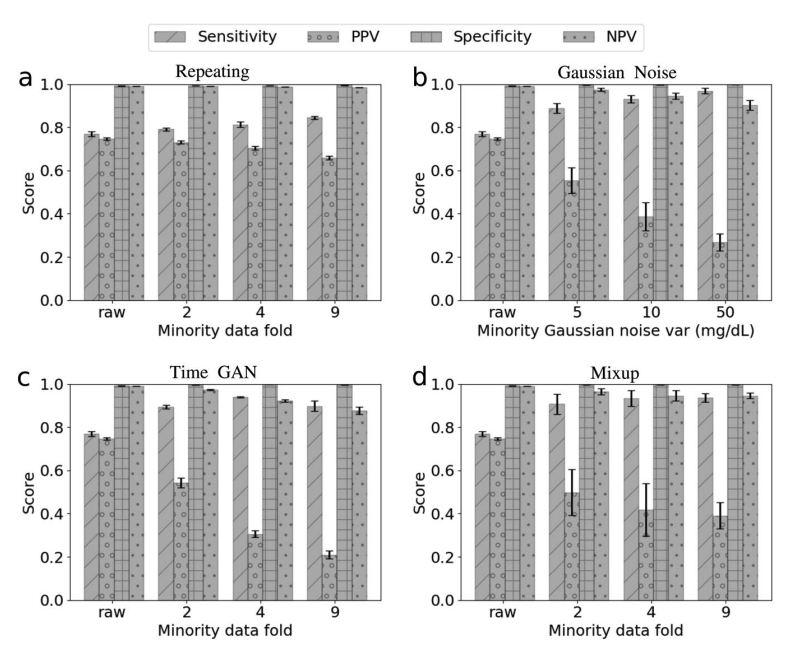
Prediction scores by different data augmentaion methods and different folds of minority data augmentation
-
Data augmentation 방법들에 따른 Prediction scores 비교
-
비교 대상
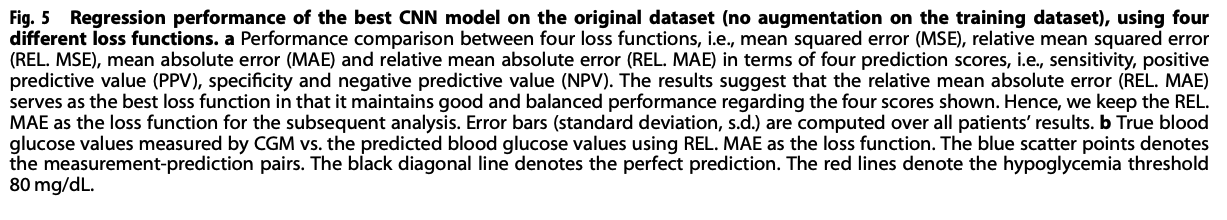
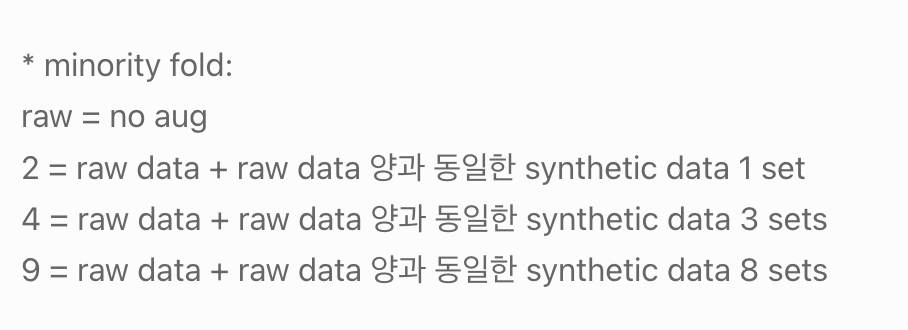
- Repeating (minority fold : raw 2/4/9)
- Gaussian Noise (minority fold : raw 2/4/9)
- Time GAN (minority fold : raw 2/4/9)
- Mixup(alpha=2) (minority fold : raw 2/4/9)
-
전체적으로 minority data를 틀리면 model sensitivity는 증가하지만, precision for minority class는 감소
-
TimeGAN
- Unsupervised GAN + Control over conditional temporal dynamics afforded by supervised auto-regressive models
- model sensitivity는 올렸으나 다른 방법들에 비해 전체적인 metrics score가 균일하지 않음
- 특히 PPV가 낮음, 즉 정상인데 저혈당 또는 고혈당으로 판단하는 경우가 많음
- 그래프 상에서는 Gaussian Noise나 Mixup과 큰 차이가 없고, Uncertainty는 낮은 편
-
Mixup
- Linearly interpolating between samples in the training dataset
- Formula :
for two different samples
-
[정리]
- 처음으로 TimeGAN을 제시한 논문은 아니고, 2019년에 발표된 TimeGAN 논문을 참고하여 구현한 것으로 보임
- Time series prediction에 대한 모델별 성능과, transfer learning을 제시했을 때 성능 등을 비교
-> CNN pretrained, Transfer2 방식이 성능 높게 나옴 - Data Augmentation 방식을 4가지 metrics를 가지고 비교함
-> 어느 하나가 월등히 차이나지는 않음. Data augmentation에서 Gaussian과 TimeGAN, MixUp 3개 같이 사용하면 좋을 것이라고 제시
[의견]
-
positive를 hypoglycemia 상태로, negative를 정상으로 설정했는데 TimeGAN의 PPV가 낮다는 것은,
정상인데 저혈당으로 구별되는 것들(False Positive)이 많았다는 이야기이므로 type 1 error가 커졌다는 의미.
이를 보면 저혈당 데이터의 비중이 증가한 것으로 볼 수도 있음.
하지만 hypoglycemia 범위의 기준이나 조정이 들어간 것일 수도 있고,
PPV가 현저히 낮아지는 현상은 좋아 보이지 않음 -
우리가 가장 줄여야 오류는 '저혈당인 데이터를 그냥 정상으로 판단하는 오류(type 2 error)'이다.
이는 NPV와 관련이 있는데 NPV가 낮을수록 type 2 error가 커진다. TimeGAN의 minority fold가 커질수록(=만든 데이터의 비중이 커질수록) NPV도 작아진다는 type 2 error가 커진다는 것이기 때문에 이를 해결해야 할 것으로 보임 -
TimeGAN을 처음 제시한 논문을 추가로 읽어볼 필요가 있음

Deep transfer learning and data augmentation techniques are revolutionizing glucose level prediction in type 2 diabetes patients.