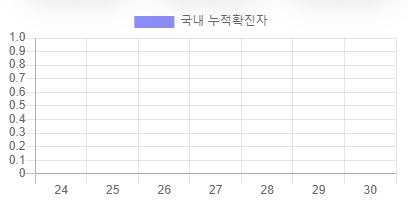
목표 : 일일 확진자수 확인할 수 있는 상황판 만들기
컴포넌트 종류
- Header
- TodayContents
- infoBox
- BarChart
- Table
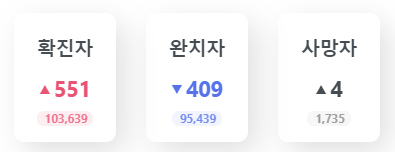
👉 TodayContents.js (일일 확진자, 완치자, 사망자)
const [countryInfo, setCountryInfo] = useState({});

useEffect(() => {
    fetch("https://disease.sh/v3/covid-19/countries/kr")
      .then((response) => response.json())
      .then((data) => {
        setCountryInfo(data);
      });
  }, []);
useState를 활용하여 countryInfo정보를 담고 fetch함수를 통해 api를 불러옴
기본적인 fetch 작성법
fetch('api주소')
  .then( res => res.json())
  .then( res => {
    // data를 응답받은 후의 로직
  );
fetch 는 response 객체에 .json() 메소드를 호출하여서 json 객체를 얻고, axios 는 response 객체의 data property 에 접근함으로써 얻는다.
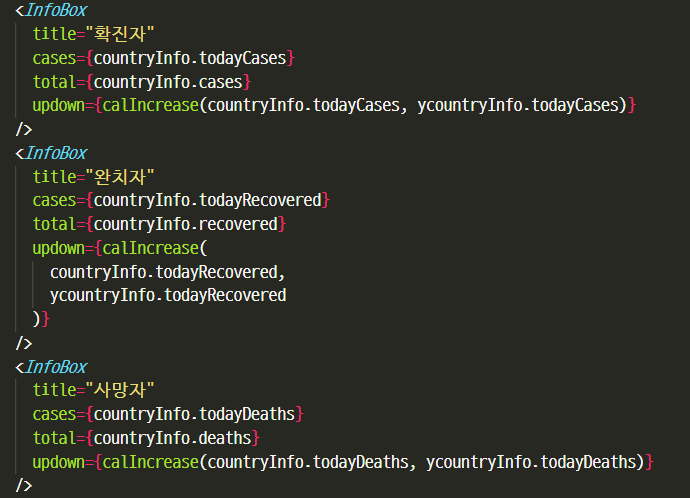
InfoBox 컴포넌트에 props로 title, cases(오늘의 확진자), total(총 확진자), updown을 넘겨줌
어제 확진자수와 오늘의 확진자수를 비교하여 오르면 "△"가 표시되고
내려가면 "▼"를 표시해주는 함수 필요
const calIncrease = (value, preValue) => {
    if (!(value && preValue)) {
      return "-";
    } else {
      if (value > preValue) {
        return "▲";
      } else if (value < preValue) {
        return "▼";
      } else return "-";
    }
  };
calIncrease함수를 통해 오늘 확진자와 어제의 확진자 수 를 넘겨줌
👉 InfoBox.js
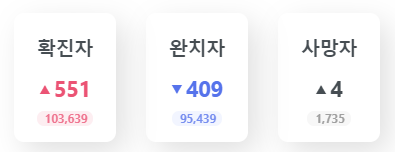
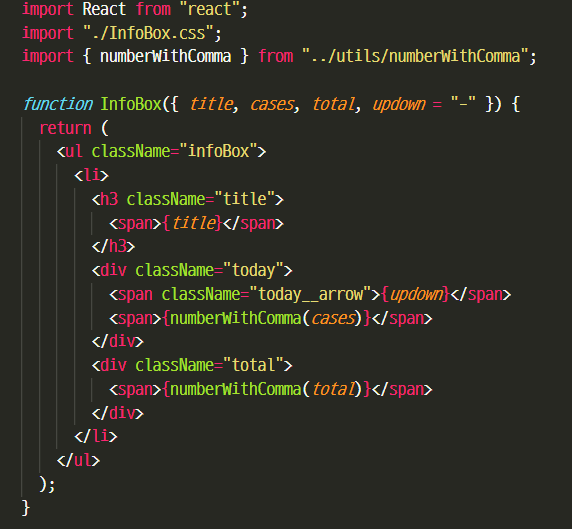
InfoBox.js에서는 title과 updown, cases, total을 뿌림
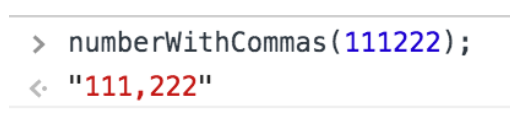
숫자에 1000단위에 콤바 넣는 컴포넌트 필요성
ex) 103,639명
👉 numberWithComma.js (숫자에 1000단위로 콤마 넣기)
export const numberWithComma = (x) =>
("" + x).toString().replace(/\B(?=(\d{3})+(?!\d))/g, ",");-
문자 변환
우선, 정규식을 사용하기 위하여
그리고 구분자가 포함된 새로운 문자열을 얻기 위하여 toString함수를 사용해 문자열로 변환해준다. -
조건에 맞는 문자를 찾아 대체
1000단위로 끊어, 콤마(,)를 삽입해야 함
즉, 특정 패턴을 찾아 새로운 문자열로 대체해야 한다.
JS에선 이러한 기능을 제공하는 replace 메소드가 있다.replace([정규식], ','); -
정규 표현식으로 패턴 지정
/\B(?=(\d{3})+(?!\d))/g,3-1. 앞 = 문자 존재(시작이 경계가 아닌 부분 찾기) : \B
여기서 경계는 1234에서 1 앞 과 4 뒤를 의미한다. 즉, 시작과 끝이다.3-2. (\d{3})+(?!\d)는 숫자가 3번만 나타나는 부분을 의미
-
결과
👉 Table.js
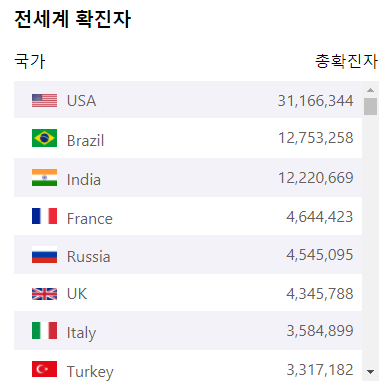
function Table(props) {
  const [countries, setCountries] = useState([]);

  // https://disease.sh/v3/covid-19/countries
  useEffect(() => {
    fetch("https://disease.sh/v3/covid-19/countries?sort=cases")
      .then((response) => response.json())
      .then((data) => {
        setCountries(data);
      });
  }, []);

  return (
    <>
      <div className="tableArea">
        <h3>전세계 확진자</h3>
        <div className="row">
          <span>국가</span>
          <span>총확진자</span>
        </div>
        <div className="table">
          {countries.map(({ country, cases, countryInfo, flag }) => (
            <tr>
              <td>
                <span>
                  <Img src={countryInfo.flag} alt={country}></Img>
                </span>
                {country}
              </td>
              <td>{numberWithComma(cases)}</td>
            </tr>
          ))}
        </div>
      </div>
    </>
  );
}
👉 BarChart.js
일주일 누적 확진자 차트 만드는중...ing....