https://developers.google.com/chart?h1=ko
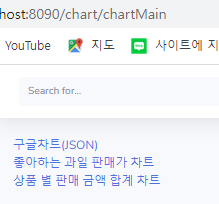
chartMain.jsp
<%@ page language="java" contentType="text/html; charset=UTF-8"%>
<%@ taglib prefix="c" uri="http://java.sun.com/jsp/jstl/core" %>
<!DOCTYPE html>
<html>
<head>
<title>구글차트</title>
</head>
<body>

<a href="/chart/chart01">구글차트(JSON)</a><br />

</body>
</html>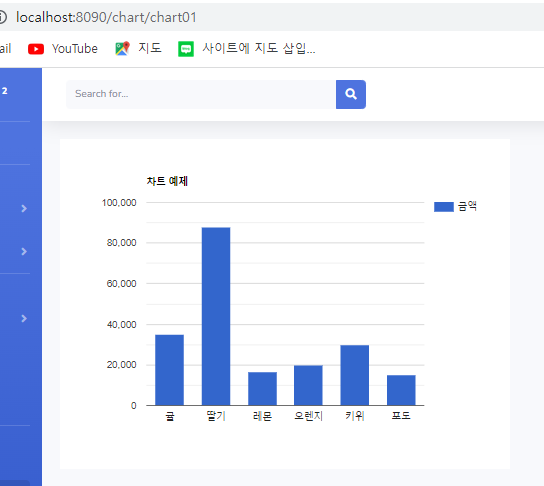
chart01.jsp
<%@ page language="java" contentType="text/html; charset=UTF-8"%>
<%@ taglib prefix="c" uri="http://java.sun.com/jsp/jstl/core" %>
<!DOCTYPE html>
<html>
<head>
<!-- 구글 차트를 호출하기 위한 js 파일 라이브러리 -->
<script type="text/javascript" src="https://www.google.com/jsapi"></script>
<title>구글 차트 01</title>
<script type="text/javascript">
//구글 차트 라이브러리 로딩
google.load("visualization","1",{
	"packages":["corechart"]
});

//Callback : 구글 차트 로딩이 완료가 된 후에 drawChar라는 함수를 실행(파라미터는 없음)
//responseText : json 데이터를 텍스트로 읽어들임
//JSON.stringify(j/s객체) :  javascript 객체를 json 데이터를 읽어들임
google.setOnLoadCallback(drawChart);

function drawChart(){
	var jsonData = $.ajax({
		url:"/resources/json/sampleData.json",
		dataType:"json",
		async:false
	}).responseText;

	console.log("jsonData : " + jsonData);

	//1) 데이터 테이블 생성
	var data = new google.visualization.DataTable(jsonData);
	//2) 차트 출력할 영역 지정
	var chart = new google.visualization.ColumnChart(document.getElementById("chart_div"))
	//1) + 2) => 차트 출력! 2)차트객체.draw( 1)데이터테이블, 옵션)
	//curveType:"function" => 곡선
	chart.draw(data,{
		title:"차트 예제",
		curveType:"function",
		width:600,
		height:440
	});
}

</script>

</head>
<body>
<div id="chart_div"></div>
</body>
</html>
chartController.jsp
package kr.or.ddit.common;

import org.springframework.stereotype.Controller;
import org.springframework.web.bind.annotation.GetMapping;
import org.springframework.web.bind.annotation.RequestMapping;

@RequestMapping("/chart")
@Controller
public class ChartController {

	@GetMapping("/chartMain")
	public String chartMain() {
		//forwarding
		return "chart/chartMain";
	}

	@GetMapping("/chart01")
	public String chart01() {
		//forwarding
		return "chart/chart01";
	}
}
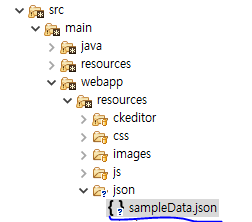
sampleData.json
{
"cols":[
{"id":"","label":"상품명","pattern":"","type":"string"},
{"id":"","label":"금액","pattern":"","type":"number"}
],
"rows":[
{"c":[{"v":"귤"},{"v":35000}]},
{"c":[{"v":"딸기"},{"v":88000}]},
{"c":[{"v":"레몬"},{"v":16500}]},
{"c":[{"v":"오렌지"},{"v":20000}]},
{"c":[{"v":"키위"},{"v":30000}]},
{"c":[{"v":"포도"},{"v":15000}]}
]
}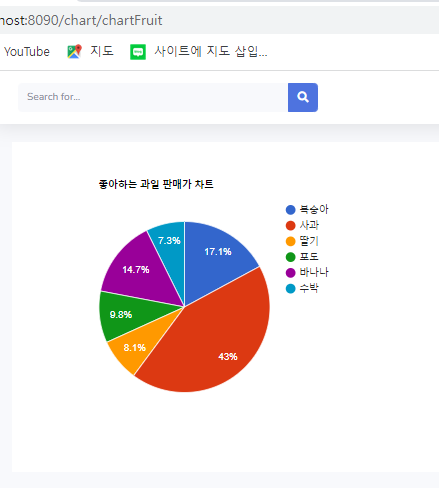
chartFruit.jsp
<%@ page language="java" contentType="text/html; charset=UTF-8"%>
<%@ taglib prefix="c" uri="http://java.sun.com/jsp/jstl/core" %>
<!DOCTYPE html>
<html>
<head>
<!-- 구글 차트를 호출하기 위한 js 파일 라이브러리 -->
<script type="text/javascript" src="https://www.google.com/jsapi"></script>
<title>좋아하는 과일 판매가 차트</title>
<script type="text/javascript">
//구글 차트 라이브러리 로딩
google.load("visualization","1",{
	"packages":["corechart"]
});

google.setOnLoadCallback(drawChart);

function drawChart(){
	var jsonData = $.ajax({
		url:"/resources/json/fruitData.json",
		dataType:"json",
		async:false
	}).responseText;

	//차트객체.draw(데이터테이블,옵션)
	var data = new google.visualization.DataTable(jsonData);
// 	var chart = new google.visualization.LineChart(document.getElementById("chart_div"));
	var chart = new google.visualization.PieChart(document.getElementById("chart_div"));

	chart.draw(data,{
		title:"좋아하는 과일 판매가 차트",
		curveType:"function",
		width:600,
		height:440
	});
}
</script>
</head>
<body>

<div id="chart_div"></div>

</body>
</html>
fruitData.json
{
"cols":[
{"id":"","label":"과일명","pattern":"","type":"string"},
{"id":"","label":"판매가","pattern":"","type":"number"}
],
"rows":[
{"c":[{"v":"복숭아"},{"v":35000}]},
{"c":[{"v":"사과"},{"v":88000}]},
{"c":[{"v":"딸기"},{"v":16500}]},
{"c":[{"v":"포도"},{"v":20000}]},
{"c":[{"v":"바나나"},{"v":30000}]},
{"c":[{"v":"수박"},{"v":15000}]}
]
}
chartController.jsp
@GetMapping("/chartFruit")
	public String chartFruit() {
		//forwarding
		return "chart/chartFruit";
	}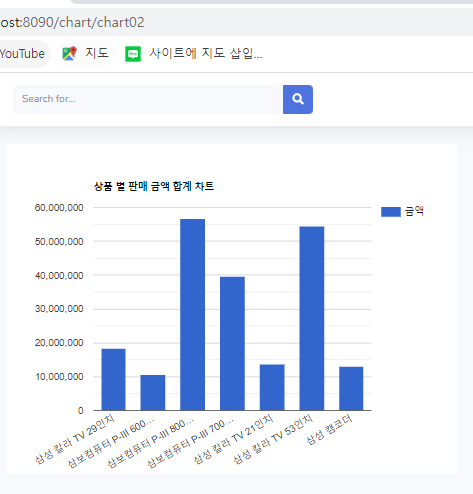
chart02.jsp
<%@ page language="java" contentType="text/html; charset=UTF-8"%>
<%@ taglib prefix="c" uri="http://java.sun.com/jsp/jstl/core" %>
<!DOCTYPE html>
<html>
<head>
<!-- 구글 차트를 호출하기 위한 js 파일 라이브러리 -->
<script type="text/javascript" src="https://www.google.com/jsapi"></script>
<title>상품 별 판매 금액 합계 차트</title>
<script type="text/javascript">
//구글 차트 라이브러리 로딩
google.load("visualization","1",{
	"packages":["corechart"]
});

google.setOnLoadCallback(drawChart);

function drawChart(){
	var jsonData = $.ajax({
		url:"/chart/chart02_money",
		dataType:"json",
		async:false
	}).responseText;

	console.log("jsonData : " + jsonData);

	//차트객체.draw(데이터테이블,옵션)
	var data = new google.visualization.DataTable(jsonData);
// 	var chart = new google.visualization.LineChart(document.getElementById("chart_div"));
// 	var chart = new google.visualization.PieChart(document.getElementById("chart_div"));
	var chart = new google.visualization.ColumnChart(document.getElementById("chart_div"));

	chart.draw(data,{
		title:"상품 별 판매 금액 합계 차트",
		curveType:"function",
		width:600,
		height:440
	});
}
</script>
</head>
<body>
<div id="chart_div"></div>
</body>
</html>
chartController.jsp
@GetMapping("/chart02")
	public String chart02() {
		//forwarding
		return "chart/chart02";
	}

	//@ResponseBody 어노테이션을 쓰면 JSON 데이터로 리턴함
	@ResponseBody
	@RequestMapping("/chart02_money")
	public JSONObject chart01_money() {
		return this.lprodService.cartMoney();
	}