World Map 그리기
- https://github.com/d3/d3-geo에서 다양한 world map projection 예시를 확인할 수 있다.
- 더 다양한 projection을 사용하고 싶다면 https://github.com/d3/d3-geo-projection 라이브러리를 사용할 수 있다.
World Map을 데이터로 변환하기
1️⃣ World Map을 그리기 위해서 World Atlas TopoJSON 라이브러리를 사용한다. (World Map Geography를 TopoJSON형식의 데이터로 변환)
- 간단한 버전의 맵을 그리고 싶다면
50m.json을, 디테일한 맵을 글고 싶다면110m.json을 사용한다.
import { json } from 'd3';

// Convert topoJSON to geoJSON
json(
  'https://cdn.jsdelivr.net/npm/world-atlas@2/countries-50m.json'
).then(data => console.log(data));
2️⃣ TopoJSON 데이터를 GeoJSON으로 변환하기 위해서 togojson 라이브러리를 사용한다.
npm install topojson
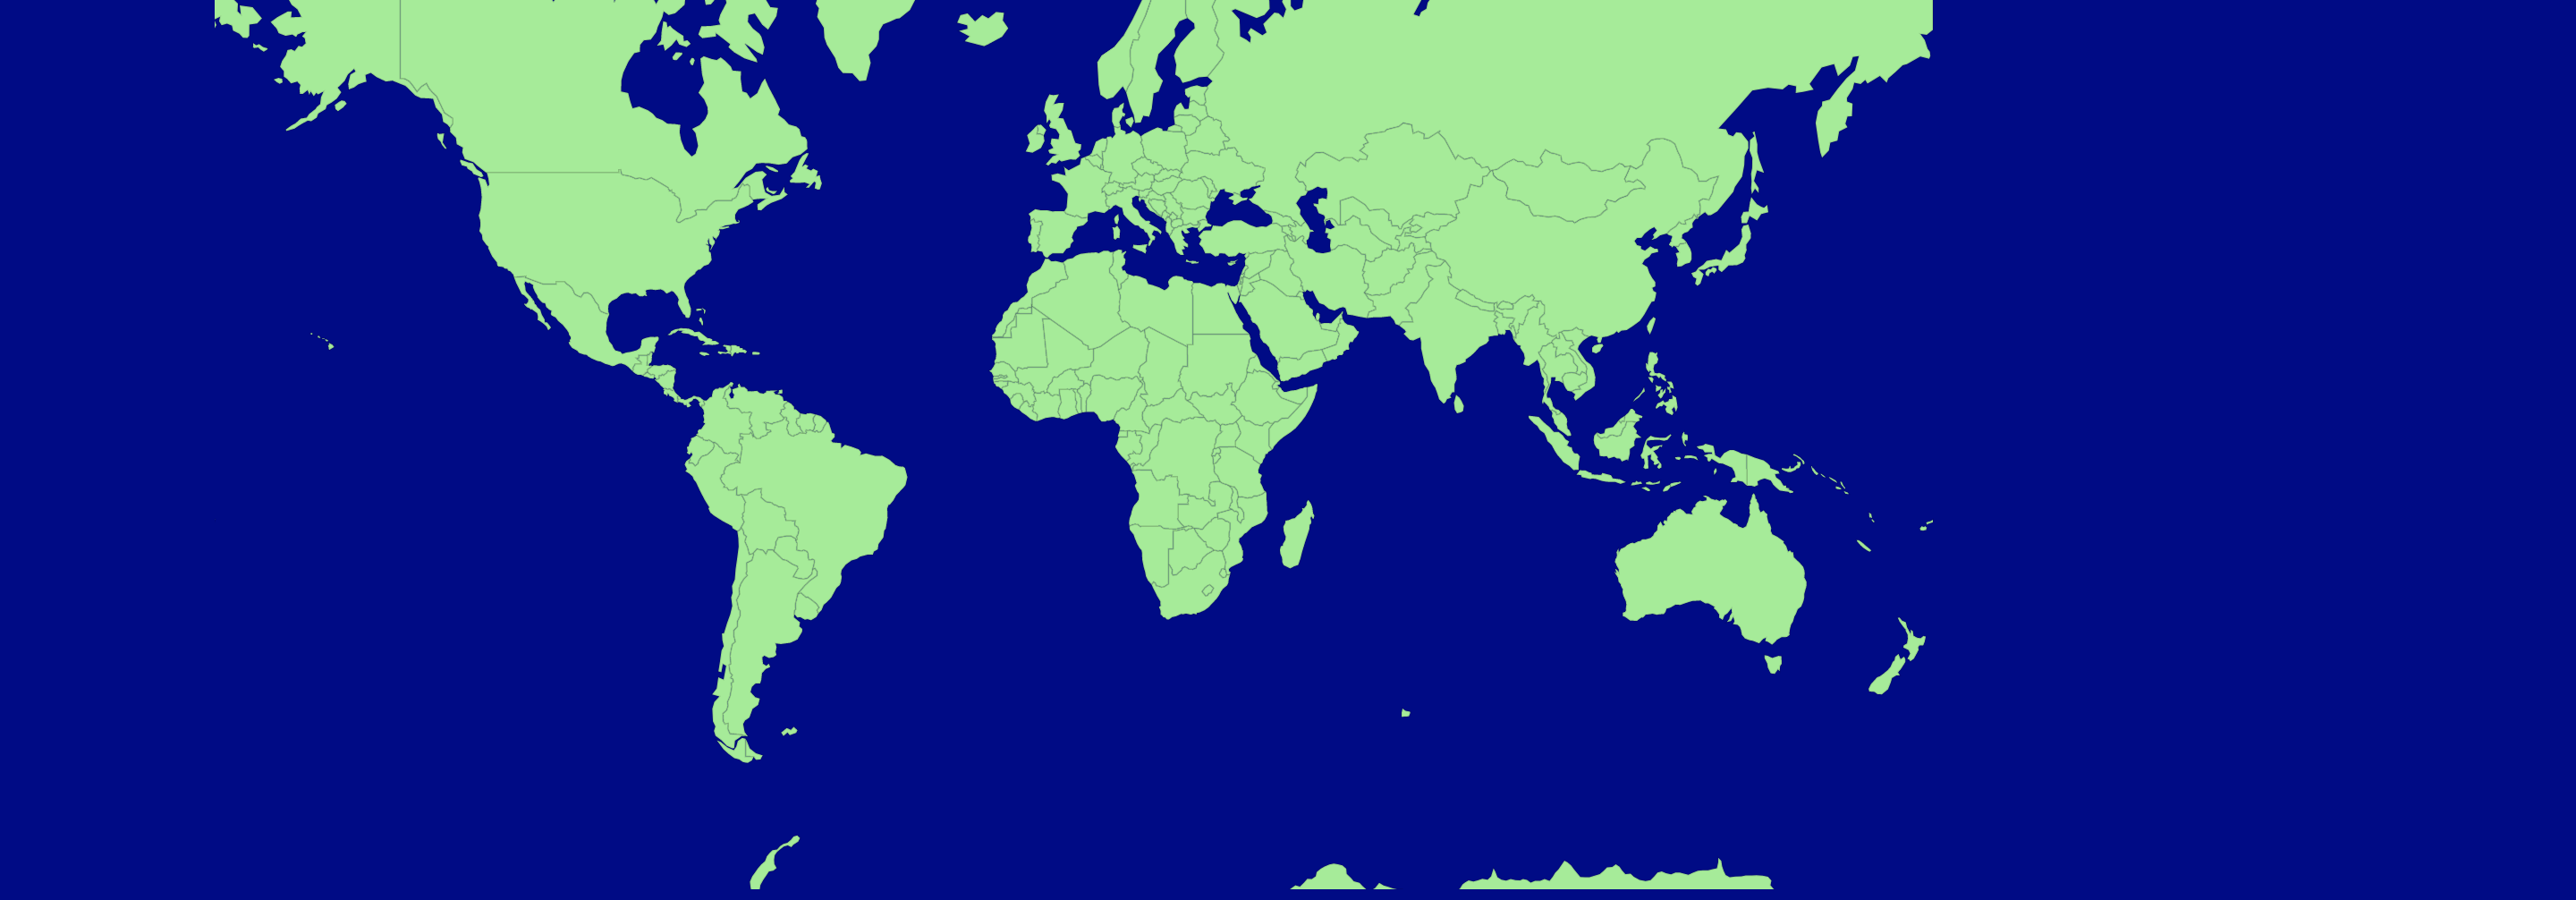
import { select, json, geoPath, geoMercator } from 'd3';
import { feature } from 'topojson';

// Convert data into svg path
const projection = geoMercator();
const pathGenerator = geoPath().projection(projection);

json('https://cdn.jsdelivr.net/npm/world-atlas@2/countries-110m.json').then(
  data => {
    // Convert topoJSON to geoJSON
    const countries = feature(data, data.objects.countries);

    // Join data and draw svg path
    svg
      .selectAll('path')
      .data(countries.features)
      .enter()
      .append('path')
      .attr('d', pathGenerator);
  }
);
지구모양의 Sphere를 추가하고 싶다면,
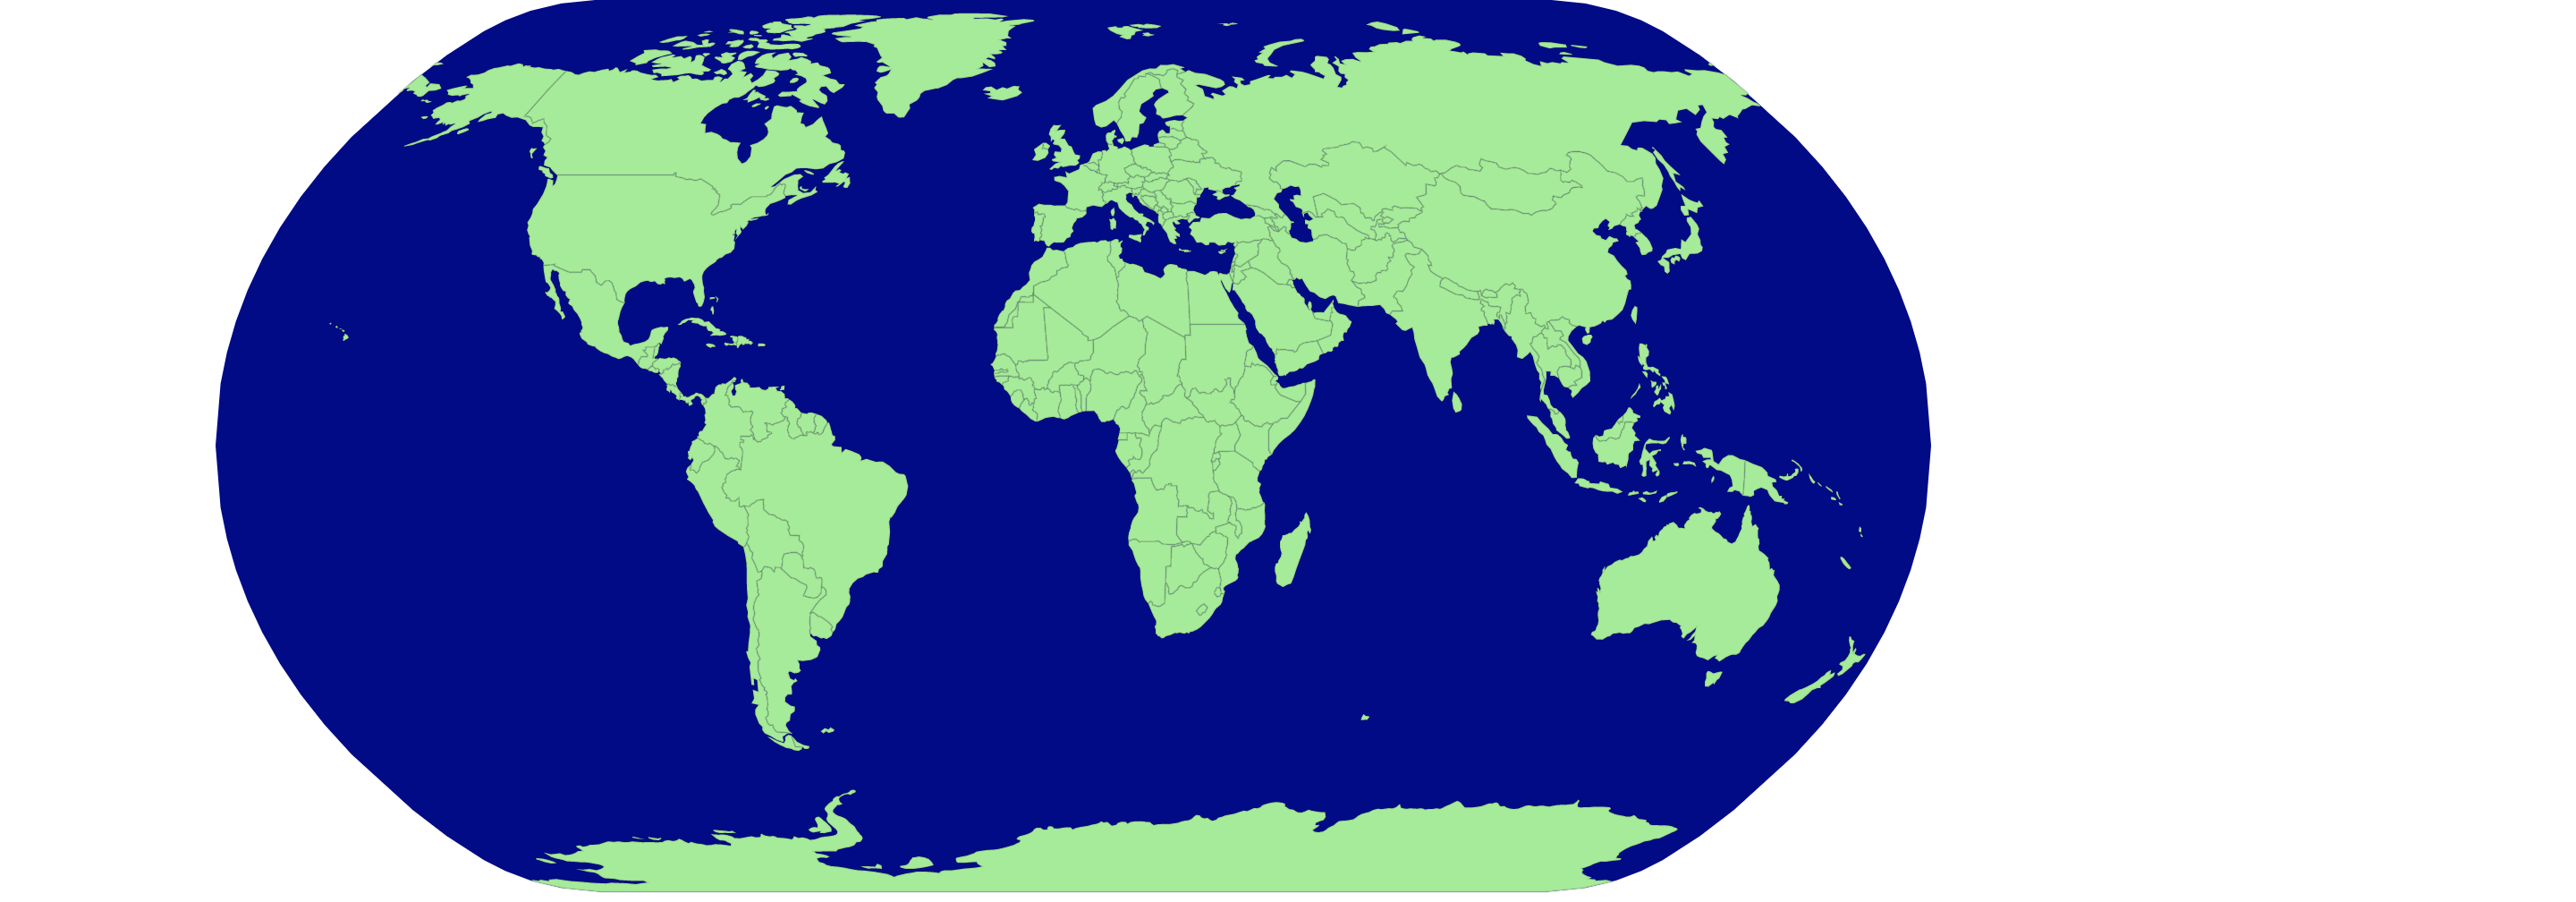
// Create earth sphere
svg
  .append('path')
  .attr('class', 'sphere')
  .attr('d', pathGenerator({ type: 'Sphere' }));
/* css */
.country {
fill: lightgreen;
stroke: black;
stroke-width: 0.05px;
}
.sphere {
fill: darkblue;
}알록달록하게 Color를 추가하고 싶다면,
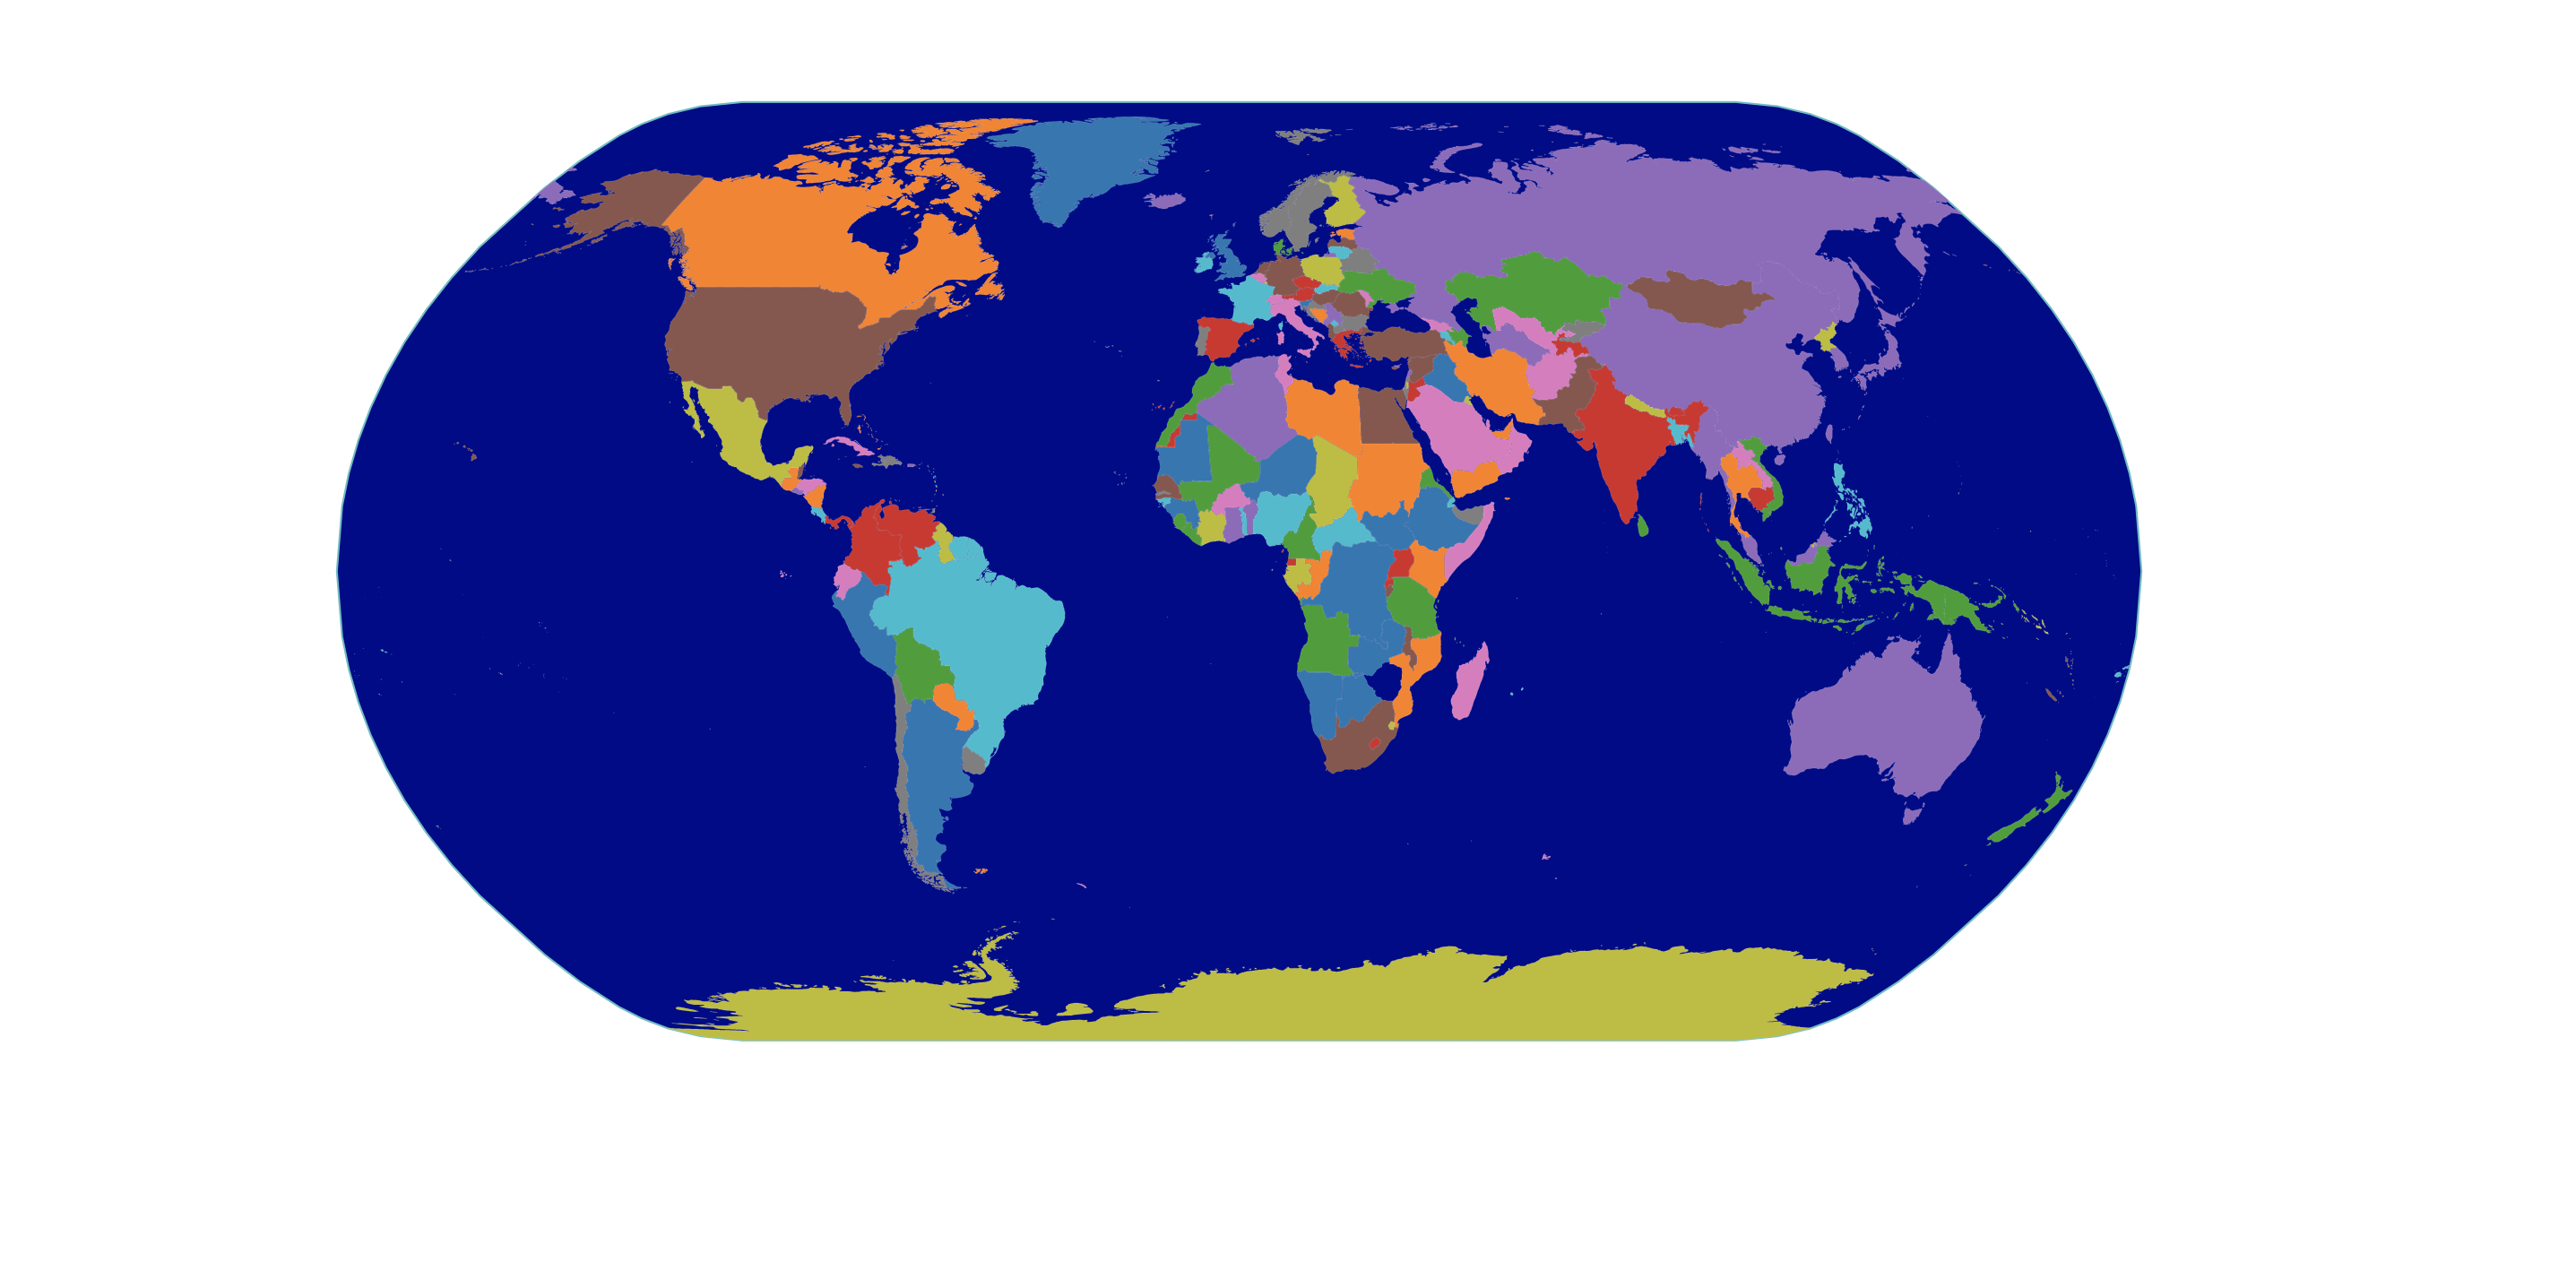
// Color Scale
const colorScale = scaleOrdinal(schemeCategory10);

g.selectAll('path')
  .data(countries.features)
  .enter()
  .append('path')
  .attr('class', 'country')
  .attr('d', pathGenerator)
  .attr('fill', d => colorScale(d.properties.name)) // (*)
  .append('title')
  .text(d => d.properties.name);
Interactive한 World Map 만들기
Hover Effect
.country:hover {
  fill: red;
}
각각의 Path에 Tooltip 추가하기
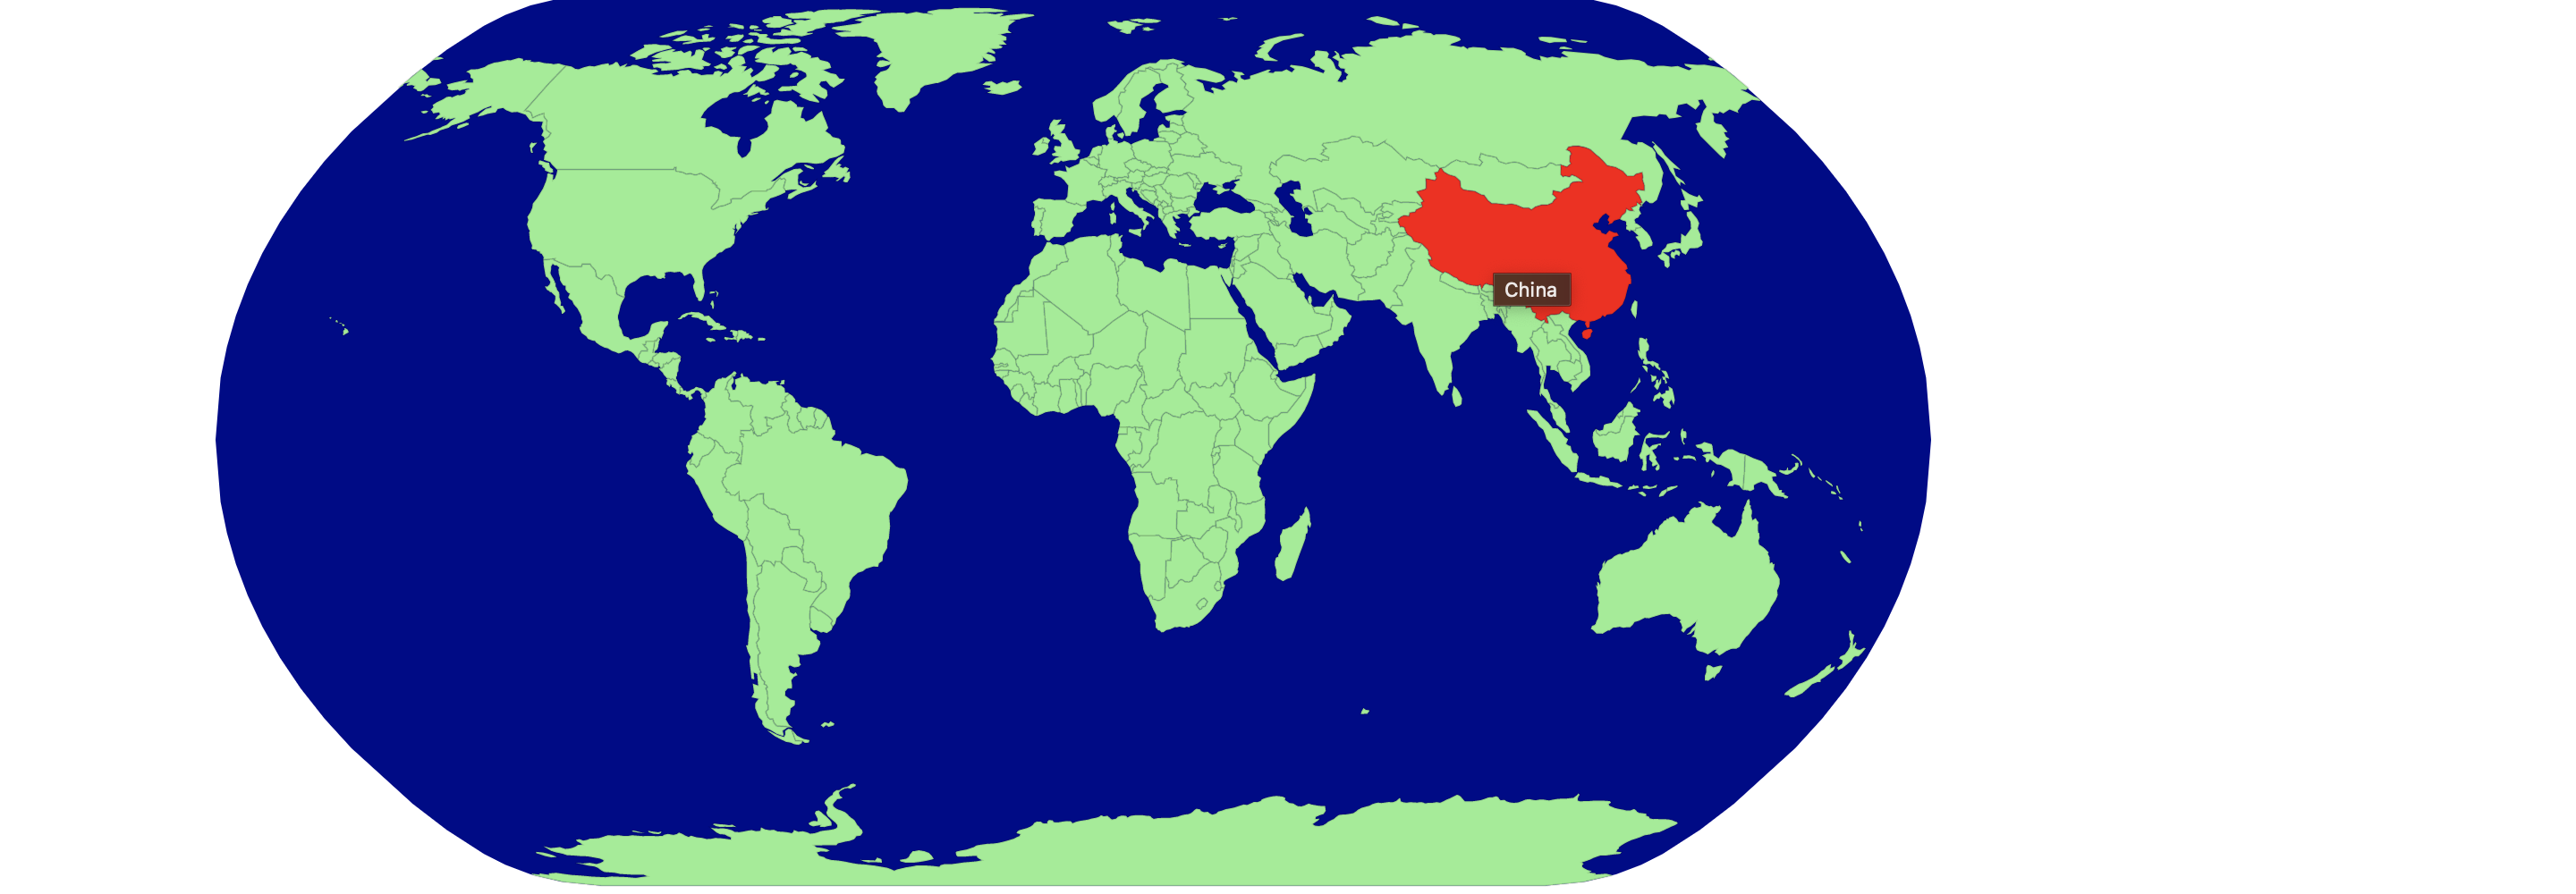
    svg
      .selectAll('path')
      .data(countries.features)
      .enter()
      .append('path')
      .attr('class', 'country')
      .attr('d', pathGenerator)
      .append('title') // (*)
      .text(d => d.properties.name); // (*)
Panning & Zooming
import { select, json, geoPath, geoNaturalEarth1, zoom } from 'd3';
import { feature } from 'topojson';

const svg = select('div').append('svg').attr('width', 1200).attr('height', 500);
const g = svg.append('g');

// Panning and zooming
svg.call(
  zoom().on('zoom', ({ transform }) => {
    g.attr('transform', transform);
  })
);
결과물 ✨
Source Code
import { select, json, geoPath, geoNaturalEarth1, zoom } from 'd3';
import { feature } from 'topojson';

const svg = select('div').append('svg').attr('width', 1440).attr('height', 900);
const g = svg.append('g');

// Convert data into svg path
const projection = geoNaturalEarth1();
const pathGenerator = geoPath().projection(projection);

// Create earth sphere
g.append('path')
  .attr('class', 'sphere')
  .attr('d', pathGenerator({ type: 'Sphere' }));

// Panning and zooming
svg.call(
  zoom().on('zoom', ({ transform }) => {
    g.attr('transform', transform);
  })
);

json('https://cdn.jsdelivr.net/npm/world-atlas@2/countries-50m.json').then(
  data => {
    // Convert topoJSON to geoJSON
    const countries = feature(data, data.objects.countries);

    // Join data and draw svg path
    g.selectAll('path')
      .data(countries.features)
      .enter()
      .append('path')
      .attr('class', 'country')
      .attr('d', pathGenerator)
      .append('title') // Add a tooltop
      .text(d => d.properties.name);
  }
);

Hello World.