
실습 프로젝트 4️⃣
【유가(Oil Price) 분석】
셀프 주유소가 정말 저렴할까???
- 대한민국 주유 가격을 알아보는 사이트 오피넷(Opinet)을 활용한다.
1. 분석 데이터 웹 스크랩핑
🔰 웹 데이터 가져오기
- Selenium으로 Chrome 제어창 열기
    from selenium import webdriver
    from selenium.webdriver.chrome.service import Service

    chrome_driver_path = "../chromedriver-win64/chromedriver.exe"
    service = Service(executable_path=chrome_driver_path)
    options = webdriver.ChromeOptions()

    driver = webdriver.Chrome(options=options, service=service)

    // Opinet > 싼 주유소 찾기 > 지역별 페이지로 접근
    url = "https://www.opinet.co.kr/searRgSelect.do"
driver.get(url)id=“SIDO_NM0”아이디 속성으로 접근해 지역 > 시/도 데이터 입력하기
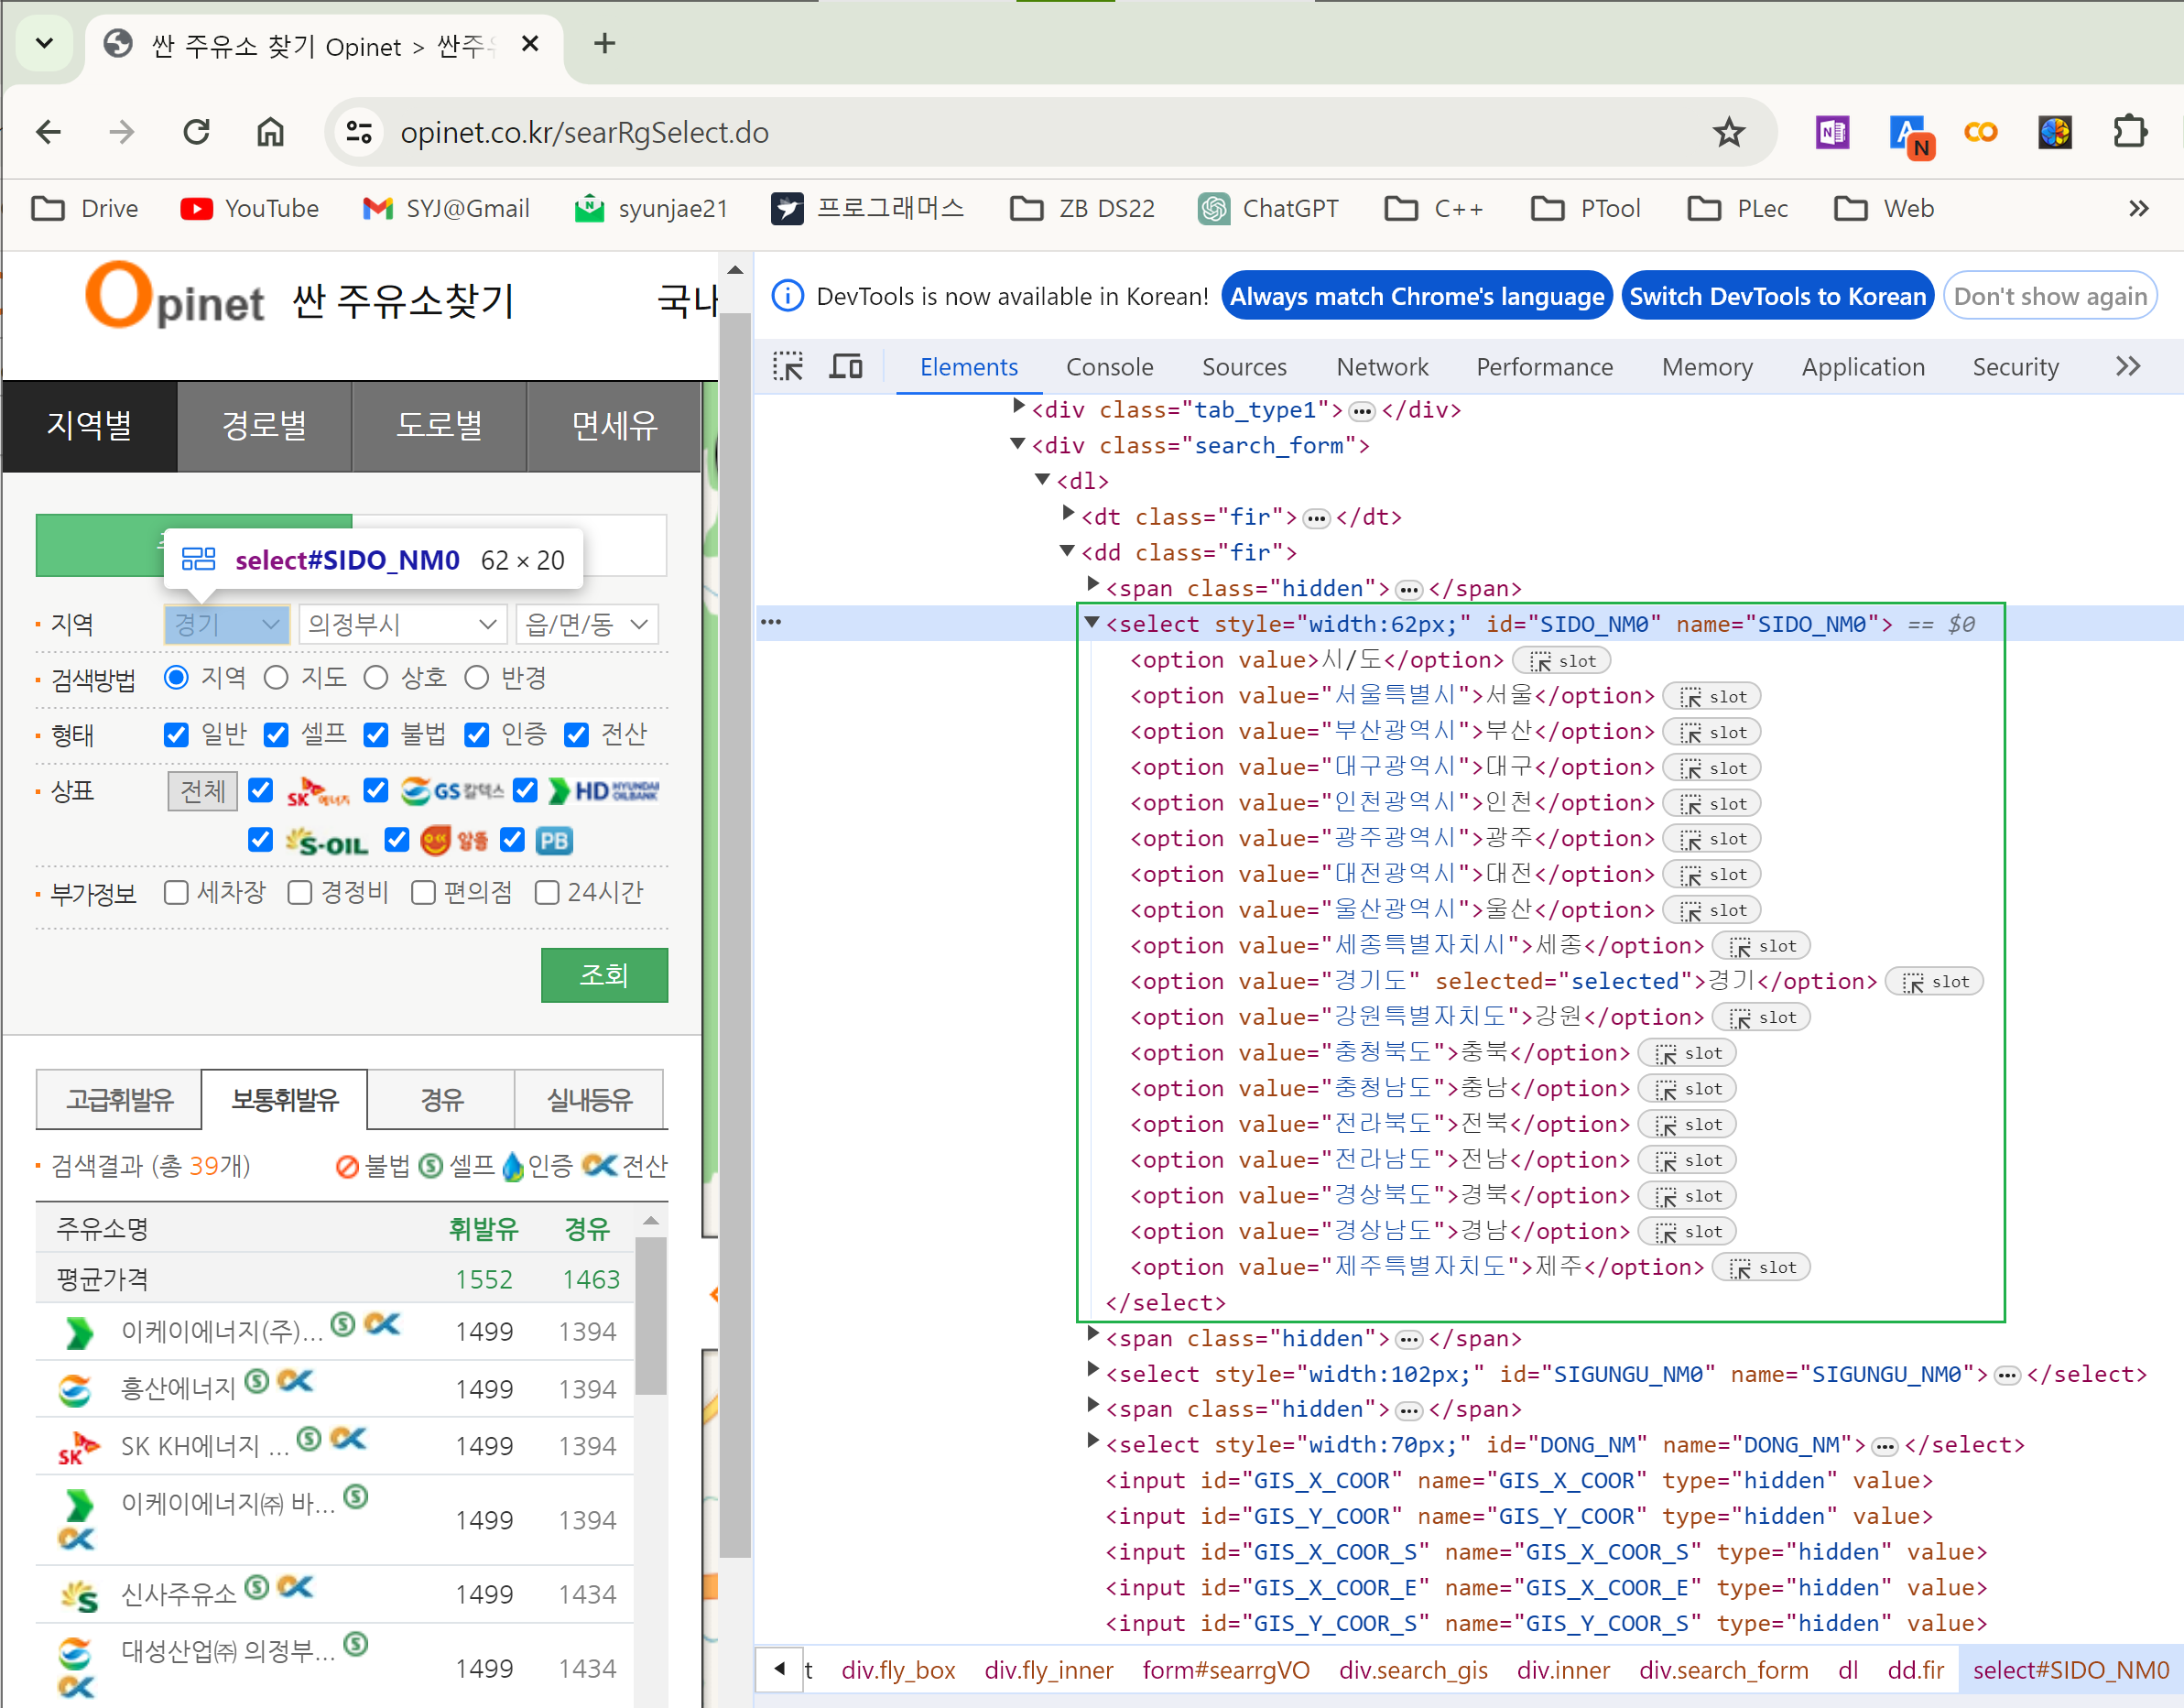
    sido_list_raw = driver.find_element(By.ID, "SIDO_NM0")
    sido_list = sido_list_raw.find_elements(By.TAG_NAME, "option")
    sido_names = [option.get_attribute("value") for option in sido_list]
    sido_names[:5] // ['', '서울특별시', '부산광역시', '대구광역시', '인천광역시']
    del sido_names[0]

sido_list_raw.send_keys(sido_names[0]) // '서울' 입력id=“SIGUNGU_NM0”아이디 속성으로 접근해서 25개의 구 데이터 가져오기
    // 부모 태그: <select> tag
    gu_list_raw = driver.find_element(By.ID, "SIGUNGU_NM0")

    // 자식 태그: <option> tag
    gu_list = gu_list_raw.find_elements(By.TAG_NAME, "option")

    // 태그 속성값: <option> tag의 value= 값
    gu_names = [option.get_attribute("value") for option in gu_list]

    del gu_names[0]
    gu_names[:5], len(gu_names)
    // (['강남구', '강동구', '강북구', '강서구', '관악구'], 25)
🔰 데이터 엑셀 저장
- 엑셀저장 버튼 클릭하기
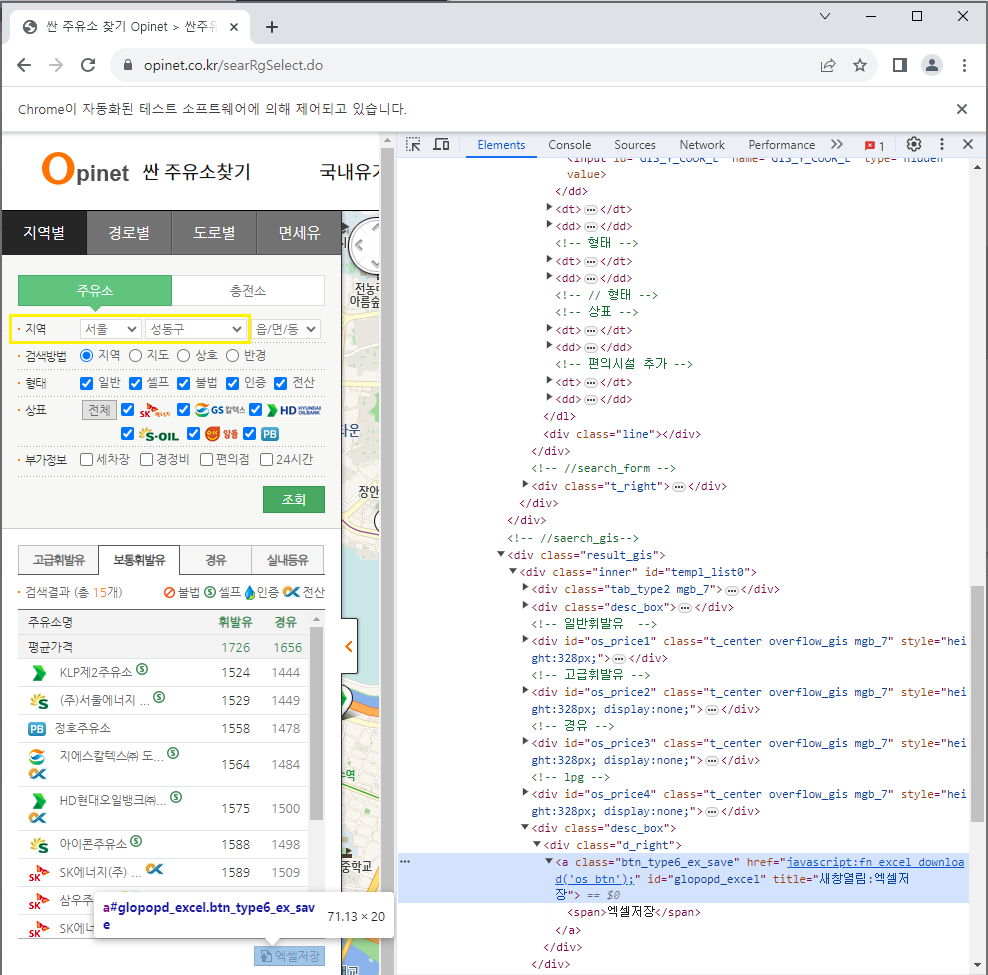
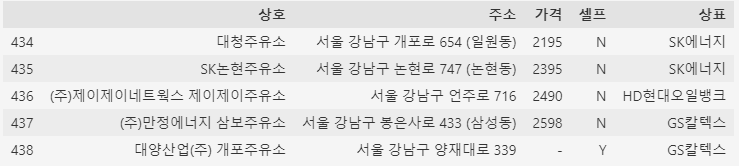
driver.find_element(By.CSS_SELECTOR, "#glopopd_excel").click()- 구별 25개의 주유소 정보를 엘셀로 저장하기
    import time
    from tqdm import tqdm_notebook

    for gu in tqdm_notebook(gu_names):
        element = driver.find_element(By.ID, "SIGUNGU_NM0")
        element.send_keys(gu)
        time.sleep(3)

        element_get_excel = driver.find_element(By.ID, "glopopd_excel")
        element_get_excel.click()
        time.sleep(3)

    driver.close()
2. 분석 데이터 전처리
🔰 DataFrame 생성
- 저장한 엑셀 파일들을 불러와 pandas의 DataFrame으로 정리한다.
	from glob import glob

    // 파일 목록을 리스트로 반환
    oil_stations_files = glob("./지역_*.xls")

    // 25개 엑셀 파일 읽기
    tmp_gu_df_raw = []
    for file_name in oil_stations_files:
        tmp_gu_df = pd.read_excel(file_name, header=2)
        tmp_gu_df_raw.append(tmp_gu_df)

    // DataFrame으로 모두 합치기
    stations_raw = pd.concat(tmp_gu_df_raw)

    // 인덱스 재정렬
    stations_raw.reset_index(inplace=True)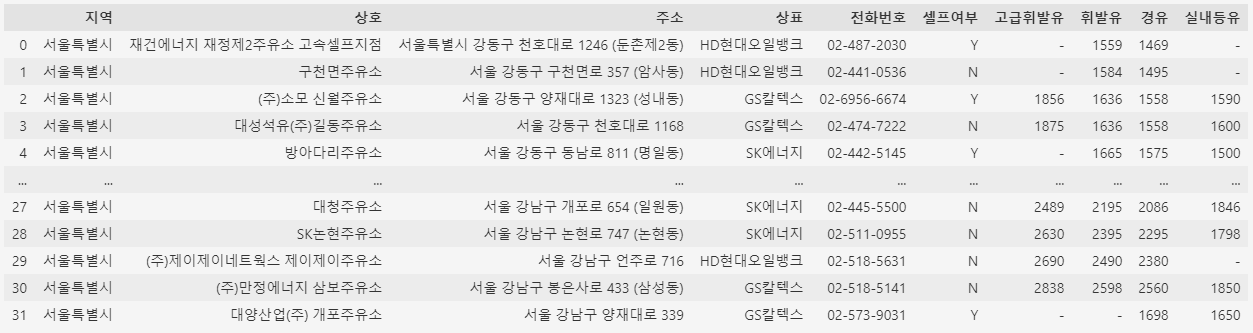
🔰 DataFrame 편집
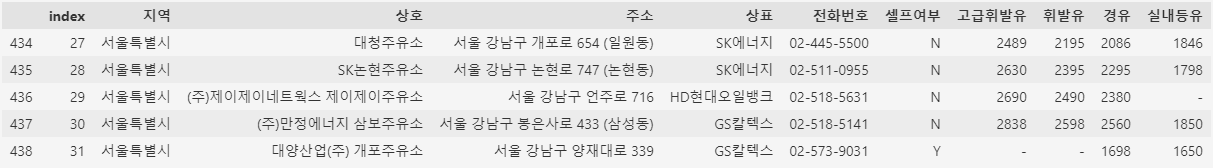
- 필요한 컬럼 데이터만 추려서 새로운 DataFrame 생성
    stations = pd.DataFrame({
        "상호": stations_raw["상호"],
        "주소": stations_raw["주소"],
        "가격": stations_raw["휘발유"],
        "셀프": stations_raw["셀프여부"],
        "상표": stations_raw["상표"]
    })
- “주소” 컬럼에서 구 이름 추출하기
stations["구"] = [each_address.split()[1] for each_address in stations["주소"]]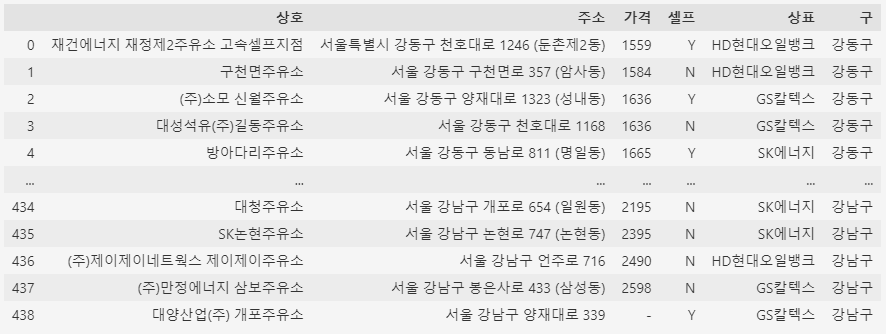
- “가격” 컬럼 데이터 형변환 : object → float
    // 가격 정보가 있는 주유소만 사용
    stations = stations[stations["가격"] != "-"]

    stations["가격"] = stations["가격"].astype("float")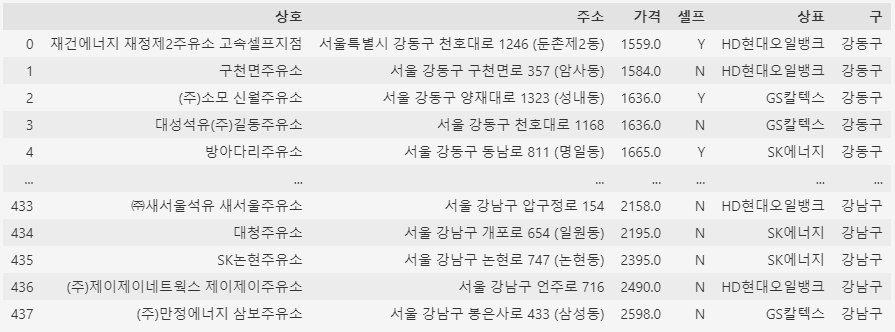
3. 분석 데이터 시각화
    import matplotlib.pyplot as plt
    import seaborn as sns
    import platform
    from matplotlib import font_manager, rc

    get_ipython().run_line_magic("matplotlib", "inline")

    path = "C:/Windows/Fonts/malgun.ttf"
    font_name = font_manager.FontProperties(fname=path).get_name()
    rc("font", family=font_name)
🔰 Boxplot by seaborn
셀프 주유소와 아닌 주유소 간의 휘발유 가격 비교
    plt.figure(figsize=(10, 6))
    sns.boxplot(x="셀프", y="가격", data=stations, palette="Set2")
    plt.grid(True)
plt.show() 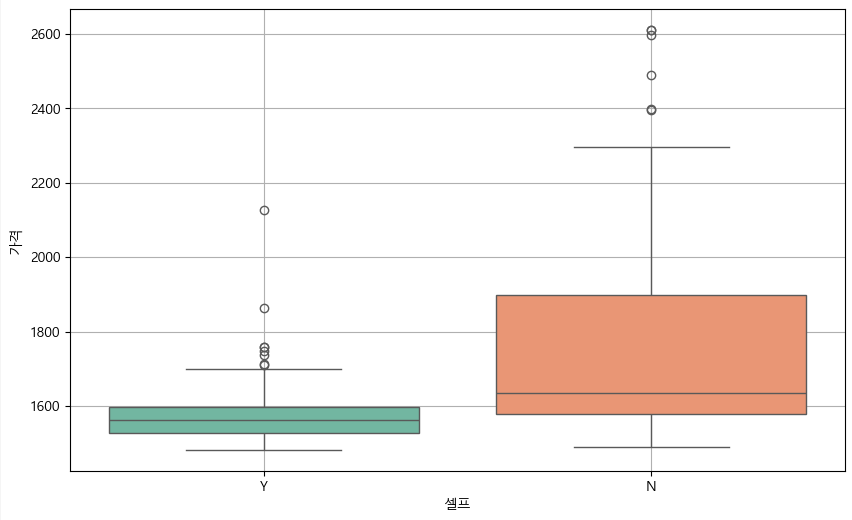
브랜드별로 셀프 주유소와 아닌 주유소의 휘발유 가격 비교
  plt.figure(figsize=(10, 6))
  sns.boxplot(x="상표", y="가격", hue="셀프", data=stations, palette="Set3")
  plt.grid(True)
  plt.show()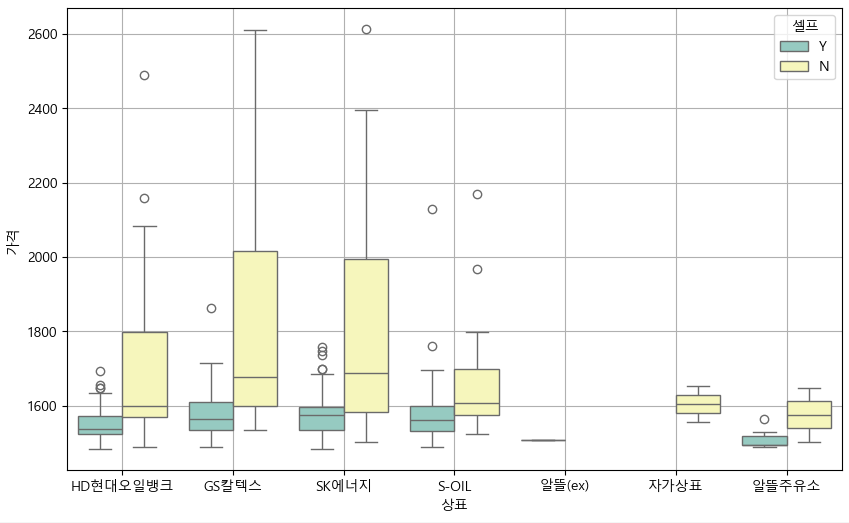
🔰 지도 시각화 by folium
- 구별로 전체 주유소의 휘발유 가격 평균으로 DataFrame 재편성
gu_price_data = pd.pivot_table(data=stations, index="구", values="가격")- 구별 평균 휘발유 가격을 지도에 표시
    import folium
    import json

    geo_path = "../data/seoul_municipalities_geo_simple.json"
    geo_str	= json.load(open(geo_path, encoding="utf-8"))

    oil_price_map = folium.Map(
            location=[37.5502, 126.982], zoom_start=10.5, tiles="CartoDB Voyager"
    )

    folium.Choropleth(
        geo_data=geo_str,
        data=gu_price_data,
        columns=[gu_price_data.index, "가격"],
        key_on="feature.id",
        fill_color="PuRd",
        legend_name="휘발유 가격"
    ).add_to(oil_price_map)

    oil_price_map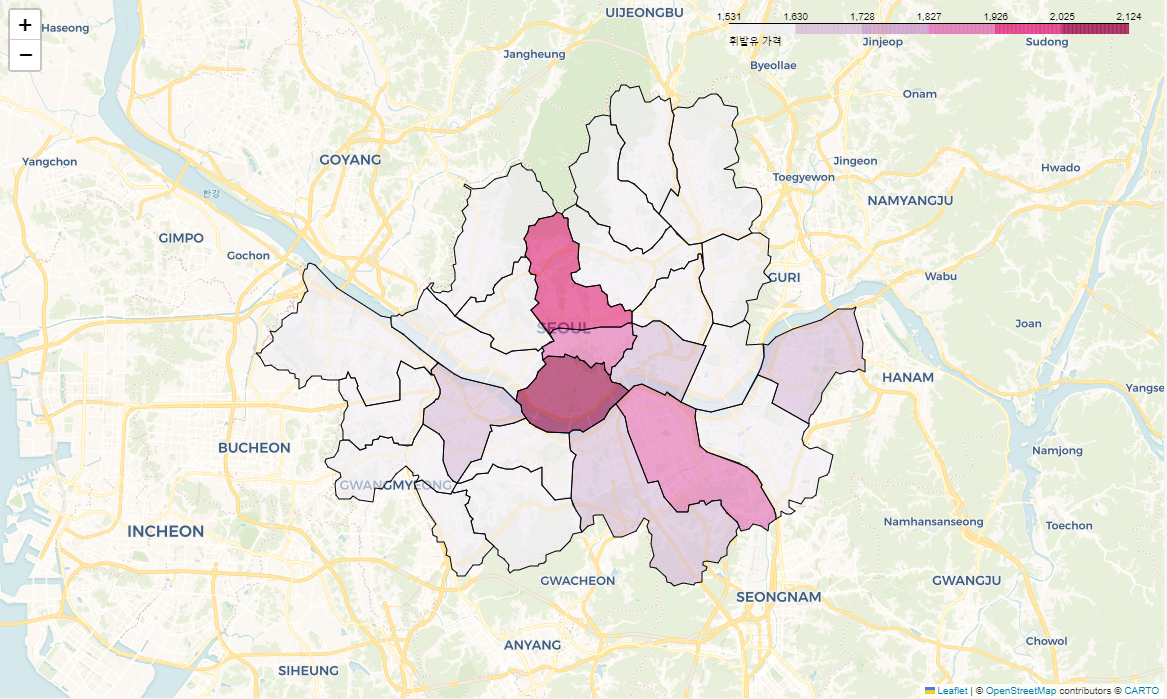

ISTP(정신승리), To Be Data Scientist