proximity analysis 근접분석
📌 근접분석(proximity analysis)
: 지리 정보 시스템(GIS) 및 공간 데이터 분석에서 사용되는 기술.
- 특정 지리적 위치와 그 주변의 다른 지리적 엔터티 사이의 상호 관계를 이해하고 분석하는 프로세스를 나타냄.
- 물체나 위치 간의 상대적인 거리, 교차점, 인접성 등을 조사하는 데 유용
releases = gpd.read_file("../input/geospatial-learn-course-data/toxic_release_pennsylvania/toxic_release_pennsylvania/toxic_release_pennsylvania.shp")
releases.head()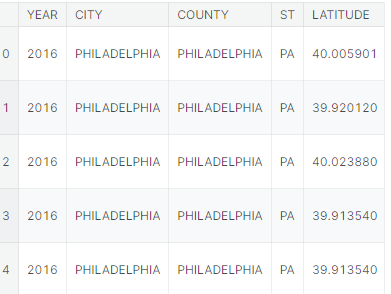
stations = gpd.read_file("../input/geospatial-learn-course-data/PhillyHealth_Air_Monitoring_Stations/PhillyHealth_Air_Monitoring_Stations/PhillyHealth_Air_Monitoring_Stations.shp")
stations.head()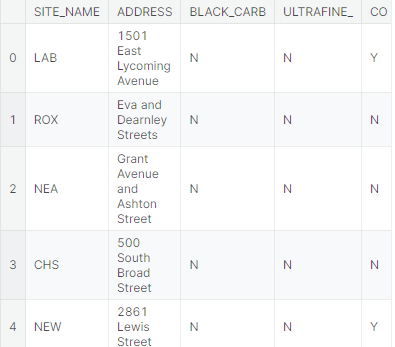
Measuring distance
- 거리를 측정하기 전에 CRS를 동일하게 맞춰주는 작업이 필요하다
print(stations.crs)
print(releases.crs)- GeoPandas에서 거리를 계산하는 것은 비교적 간단하다.
- 아래 코드 셀은 최근_release에서 비교적 최근에 발생한 릴리스 사고와 스테이션 GeoDataFrame의 모든 스테이션 사이의 거리(피트)를 계산한다.
# Select one release incident in particular
recent_release = releases.iloc[360]

# Measure distance from release to each station
distances = stations.geometry.distance(recent_release.geometry)
distances
0 44778.509761
1 51006.456589
2 77744.509207
3 14672.170878
4 43753.554393
5 4711.658655
6 23197.430858
7 12072.823097
8 79081.825506
9 3780.623591
10 27577.474903
11 19818.381002
dtype: float64
- 평균
print('Mean distance to monitoring stations: {} feet'.format(distances.mean()))Mean distance to monitoring stations: 33516.28487007786 feet
- 근접 역
print('Closest monitoring station ({} feet):'.format(distances.min()))
print(stations.iloc[distances.idxmin()][["ADDRESS", "LATITUDE", "LONGITUDE"]])
Closest monitoring station (3780.623590556444 feet):
ADDRESS 3100 Penrose Ferry Road
LATITUDE 39.91279
LONGITUDE -75.185448
Name: 9, dtype: object
Creatung a buffer
📌 Buffer
: 특정 선, 면 주위에 생성된 일정한 거리의 영역
- 해당 지점이나 버퍼 주변의 영향력을 시각화 및 분석하는데 사용
- 마커(Marker)를 중심으로 하는 일정거리의 원
- 한 지점에서 특정 거리 만큼 떨어진 반경들
two_mile_buffer = stations.geometry.buffer(2*5280)
two_mile_buffer.head()
0 POLYGON ((2721944.641 257149.310, 2721893.792 ...
1 POLYGON ((2682494.290 271248.900, 2682443.441 ...
2 POLYGON ((2744886.638 280980.247, 2744835.789 ...
3 POLYGON ((2703638.580 233247.101, 2703587.731 ...
4 POLYGON ((2726959.773 251134.976, 2726908.924 ...
dtype: geometry
folium.GeoJson()으로 지도에 polygon을 시각화할 수 있다.
# Create map with release incidents and monitoring stations
m = folium.Map(location=[39.9526,-75.1652], zoom_start=11)
HeatMap(data=releases[['LATITUDE', 'LONGITUDE']], radius=15).add_to(m)
for idx, row in stations.iterrows():
    Marker([row['LATITUDE'], row['LONGITUDE']]).add_to(m)

# Plot each polygon on the map
GeoJson(two_mile_buffer.to_crs(epsg=4326)).add_to(m)

# Show the map
m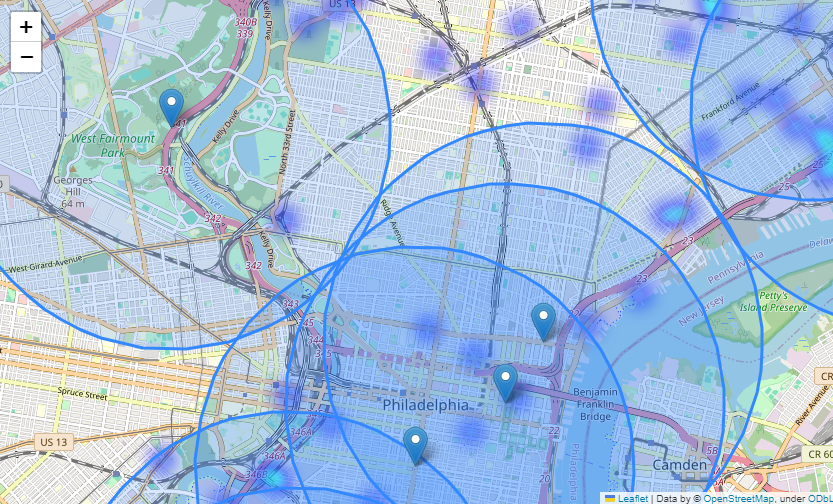
unary_union을 통해 polygon을 MultiPolygon으로 축소할 경우, 효과적으로 시각화할 수 있다.
# Turn group of polygons into single multipolygon
my_union = two_mile_buffer.geometry.unary_union
print('Type:', type(my_union))

# Show the MultiPolygon object
my_union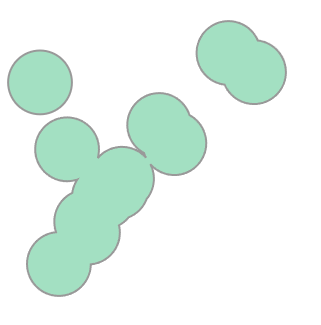
- Multipolygon에 point가 포함되어 있는 지
contains()로 확인할 수 있다
# The closest station is less than two miles away
my_union.contains(releases.iloc[360].geometry)
참고