목표
구글에 치면 그래프용 api가 있다 하지만 디자인은 바꿀수 없음,,,눈물남
그래서 canvas를 사용하여 직접 구현할 수 밖에 없었다,,,
https://jyys.tistory.com/11 블로그 참고 함
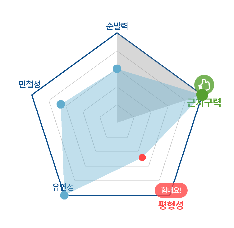
결과물 이미지)
해야 하는 일
- 오각형 그리기: 차트를 표현할 때 기준선(안쪽부터 바깥쪽까지 5단계의 오각형)을 그리고, 특성마다 점수를 점으로 찍어 연결
- 특성을 글씨로 표시: 오각형의 꼭짓점에 각 특성 이름 표시 (민첩성, 순발력 등...)
- 아이콘 추가 : 최고 점수와 최소 점수에 아이콘 붙여주기
- 데이터 받기 : 차트 비교를 위해 지난 주 점수(lastWeekData)와 이번 주 점수(thisWeekData) 두개의 데이터 받기
차트 작성
1. 데이터 준비
차트에 표시할 데이터를 정의, RadarChartData라는 클래스를 만들어서 데이터를 저장하고, CharacteristicType에 표시할 5가지 특성을 정함
- RadarChartData에 특성과 값을 저장
data class RadarChartData(
    val type: CharacteristicType,
    val value: Float
)

enum class CharacteristicType(val displayName: String) {
    AGILITY("민첩성"),
    BALANCE("평형성"),
    ENDURANCE("근지구력"),
    FLEXIBILITY("유연성"),
    SPEED("순발력")
}
2. 차트 그리기 준비
(1) 차트 스타일 지정
- Paint를 사용해 색깔, 굵기, 스타일 지정함
- style은 안을 채울지(FILL) 아니면 선만 그릴지(STROKE)를 정하기
- 텍스트 스타일도 지정
	private val linePaint = Paint().apply {
        color = Color.parseColor("#C8C8C8") //색상
        style = Paint.Style.STROKE // 테두리 스타일
        strokeWidth = 2f // 선 두께 (2픽셀)
    }
    private val firstLinePaint = Paint().apply {
        color = Color.parseColor("#0C4E8C")
        style = Paint.Style.STROKE
        strokeWidth = 5f
    }
    private val textPaintNomal = Paint().apply {
        color = Color.parseColor("#0C4E8C")
        textSize = 14f * resources.displayMetrics.scaledDensity
        textAlign = Paint.Align.CENTER
        typeface = ResourcesCompat.getFont(context, R.font.pretendard_medium)
    }
    private val textPaintMaxPoint = Paint().apply {
        color = Color.parseColor("#56A02F")
        textSize = 16f * resources.displayMetrics.scaledDensity
        textAlign = Paint.Align.CENTER
        typeface = ResourcesCompat.getFont(context, R.font.pretendard_bold)
    }
    private val textPaintMinPoint = Paint().apply {
        color = Color.parseColor("#FF4747")
        textSize = 16f * resources.displayMetrics.scaledDensity
        textAlign = Paint.Align.CENTER
        typeface = ResourcesCompat.getFont(context, R.font.pretendard_bold)
    }
    private val lastWeekPaint = Paint().apply {
        color = Color.parseColor("#9A9A9A")
        style = Paint.Style.FILL_AND_STROKE
        alpha = 100
    }
    private val thisWeekPaint = Paint().apply {
        color = Color.parseColor("#62ADCE")
        style = Paint.Style.FILL_AND_STROKE
        alpha = 100
    }
(2) 데이터를 받기
- etDataLists 함수는 레이더 차트에 표시할 데이터를 설정하는 역할
- 지난 주 데이터(lastWeekData)와 이번 주 데이터(thisWeekData)를 받아와서, 이를 클래스의 프로퍼티에 저장하고 차트를 갱신
- invalidate() 메서드를 호출하여 레이더 차트를 다시 그리게 함, 뷰가 변경되었음을 시스템에 알리고, 이를 반영하기 위해 onDraw()가 다시 호출되도록 만든다
- 새로운 데이터를 받아 레이더 차트를 업데이트하는 핵심적인 역할
private var lastWeekData: List<RadarChartData>? = null
private var thisWeekData: List<RadarChartData>? = null

fun setDataLists(lastWeekData: List<RadarChartData>, thisWeekData: List<RadarChartData>) {
        this.lastWeekData = lastWeekData
        Log.d("chart","lastWeekData => $lastWeekData")
        this.thisWeekData = thisWeekData
        Log.d("chart","thisWeekData => $thisWeekData")
        invalidate() // 뷰를 다시 그립니다
 }
(3) 아이콘과 차트에 보여질 순서 정하기
- 맨 위 꼭지점 부터 시계방향을 보여짐
// 아이콘 비트맵 추가
    private val thumbsUpIcon = vectorToBitmap(context, R.drawable.thumbs_up)
//    private val chearUpIcon = BitmapFactory.decodeResource(resources, R.drawable.cheer_up)
    private val chearUpIcon = vectorToBitmap(context, R.drawable.cheer_up)

    //차트에 보여질 순서 맨 위부터 시계방향
    private var chartTypes = arrayListOf(
        CharacteristicType.quickness,
        CharacteristicType.muscularEndurance,
        CharacteristicType.equilibrium,
        CharacteristicType.pliability,
        CharacteristicType.agility
    )
3. 차트 그리기
- Cnavas의 onDraw() 함수를 사용 해 차트 그리기
(1) 중심점 및 기본 설정
- cx, cy: 레이더 차트의 중심 좌표를 화면의 중심으로 설정. 화면의 크기에 따라 중심점(cx, cy)과 크기를 계산한다
- radius: 레이더 차트의 반경. min(cx, cy)를 기준으로 화면에 꽉 차도록 계산
- radian: 360도를 5등분한 각도. 레이더 차트의 꼭짓점(5개)을 균등하게 배치하기 위해 사용
- step: 레이더 차트의 단계(5단계로 설정)
- heightMaxValue: 레이더 차트의 최대 높이. 중심에서 차트 꼭짓점까지의 거리
- heightStep: 각 단계의 간격. 최대 높이를 단계 수로 나눈 값
val cx = width / 2f
val cy = height / 2f
val radius = min(cx, cy) * 0.8f * 1f
val radian = PI.toFloat() * 2 / 5
val step = 5
val heightMaxValue = min(cx, cy) * 0.7f * 1f
val heightStep = heightMaxValue / step
(2) 레벨 단계별 다각형 그리기
중심에서 시작해 다각형 단계별 레이어를 그린다
1. startX와 startY를 중심으로 초기화.
2. 각 단계의 시작점에서 transformRotate를 사용해 5등분 회전 좌표(stopPoint)를 계산
3. 첫 번째 단계(i == 0): 굵은 선(firstLinePaint)으로 그리기
4. 나머지 단계(i > 0): 얇은 선(linePaint)으로 그리기
for (i in 0..step) {
            var startX = cx
            var startY = (cy - heightMaxValue) + heightStep * i

            repeat(chartTypes.size) {
                // 중심좌표를 기준으로 점(startX,startY)를 radian만큼씩 회전시킨 점(stopX, stopY)을 계산한다.
                val stopPoint = transformRotate(radian, startX, startY, cx, cy)

                if (i==0) {
                    canvas.drawLine(startX, startY, stopPoint.x, stopPoint.y, firstLinePaint)
                } else {
                    canvas.drawLine(startX, startY, stopPoint.x, stopPoint.y, linePaint)
                }

                startX = stopPoint.x
                startY = stopPoint.y
            }

            // 각 단계별 기준값 표시
            if (i < step) {
                val strValue = "${100 - 20 * i}"
                textPaint.textAlign = Paint.Align.LEFT
                canvas.drawText(
                    strValue,
                    startX + 10,
                    textPaint.fontMetrics.getBaseLine(startY),
                    textPaint
                )
            }
        }
각 단계별 기준값 표시는 현재 내 프로젝트에선 주석처리했지만 주석을 풀면 선에 기준값이 표시됨
(3) 축 라인 그리기
이것 또한 현재 프로젝트에선 주석처리했지만 중심점에서 꼭짓점까지 연결하는 선을 그리는 코드이다
var startX = cx
        var startY = cy - heightMaxValue
        repeat(chartTypes.size) {
            val stopPoint = transformRotate(radian, startX, startY, cx, cy)
            canvas.drawLine(cx, cy, stopPoint.x, stopPoint.y, linePaint)

            startX = stopPoint.x
            startY = stopPoint.y
        }
(4) 각 꼭지점 부근에 텍스트와 아이콘 추가및 위치 계산
각 꼭짓점에 텍스트(특성 이름 및 값)와 최고값과 최저값에 아이콘 추가함
텍스트 위치와 아이콘 위치 계산를 계산하여 위치 조정함
startX = cx
        startY = (cy - 300f) * 0.7f
        r = 0f

        path.reset()
        chartTypes.forEach { type ->
            val point = transformRotate(r, startX, startY, cx, cy)

            val textHeight = textPaintNomal.fontMetrics.descent - textPaintNomal.fontMetrics.ascent  // 텍스트의 높이

            //꼭지점에 붙어 있는 글씨 위치
            var adjustedY = 0f
//            var iconY = 0f
            if (type.name.equals("pliability") || type.name.equals("agility")) {
                adjustedY = point.y - (textHeight / 2) - 7f
//                iconY = point.y - (textHeight * 3) - 10f
            } else if(type.name.equals("quickness")) {
                adjustedY = point.y - (textHeight / 7)
//                iconY = point.y - (textHeight * 2.5f) - 10f
            } else {
                adjustedY = point.y + textHeight + 5f
//                iconY = adjustedY + (textHeight / 2) + 1f  // 텍스트 바로 아래에 아이콘 배치
            }

            //아이콘 높이와 위치
            val iconThumbsHeight = thumbsUpIcon.height
            val iconThumbsY = adjustedY - (textHeight / 2) - iconThumbsHeight - 25f
            val iconCheerUpHeight = thumbsUpIcon.height
            val iconCheerUpY = adjustedY - (textHeight / 3) - iconCheerUpHeight - 10f
(5) 최대값 및 최소값 강조
- 최고값(maxValue)과 최저값(minValue)을 가진 특성을 찾는다
- 최고값 특성에는 thumbsUpIcon과 textPaintMaxPoint
- 최저값 특성에는 chearUpIcon과 textPaintMinPoint
- 나머지는 일반 텍스트로 표시
val maxValue = thisWeekData?.maxOfOrNull { it.value } ?: 0
            val maxType = thisWeekData?.firstOrNull { it.value == maxValue }

            val minValue = thisWeekData?.minOfOrNull { it.value } ?: 0
            val minType = thisWeekData?.firstOrNull { it.value == minValue }

            //아이콘 붙이기 && 강조 텍스트 설정
            val paint = when {
                maxType != null && type.name == maxType.type.toString() -> {
                    canvas.drawBitmap(thumbsUpIcon, point.x - (thumbsUpIcon.width / 2), iconThumbsY, null)
                    textPaintMaxPoint
                }
                minType != null && type.name == minType.type.toString() -> {
                    canvas.drawBitmap(chearUpIcon, point.x - (chearUpIcon.width / 2), iconCheerUpY, null)
                    textPaintMinPoint
                }
                else -> textPaintNomal
            }

            canvas.drawText(
                type.value,
                point.x,
                adjustedY,
                paint
            )

            r += radian
(6) 데이터 그리기
- 지난 주 데이터: drawRadarData를 호출하여 lastWeekData를 차트로 그립니다
- 이번 주 데이터: thisWeekData를 호출하여 다른 스타일로 강조
- drawRadarData는 실제 데이터를 반영한 다각형을 그리는 역할
lastWeekData?.let {
            drawRadarData(canvas, it, cx, cy, radius, heightMaxValue ,lastWeekPaint,false)
        }

        // 이번 주 데이터 그리기
        thisWeekData?.let {
            drawRadarData(canvas, it, cx, cy, radius, heightMaxValue,thisWeekPaint,true)
        }
onDraw()의 총 코드
override fun onDraw(canvas: Canvas) {
        super.onDraw(canvas)

        // 중심점 좌표
        val cx = width / 2f
        val cy = height / 2f
        val radius = min(cx, cy) * 0.8f * 1f   // 반경 설정

        // 각도 단계 설정 (각도를 5등분)
        val radian = PI.toFloat() * 2 / 5

        val step = 5
        val heightMaxValue =  min(cx, cy) * 0.7f * 1f

        val heightStep = heightMaxValue / step // 1단계에 해당하는 높이

        // 5개의 꼭지점 그리기
        for (i in 0..step) {
            var startX = cx
            var startY = (cy - heightMaxValue) + heightStep * i

            repeat(chartTypes.size) {
                // 중심좌표를 기준으로 점(startX,startY)를 radian만큼씩 회전시킨 점(stopX, stopY)을 계산한다.
                val stopPoint = transformRotate(radian, startX, startY, cx, cy)

                if (i==0) {
                    canvas.drawLine(startX, startY, stopPoint.x, stopPoint.y, firstLinePaint)
                } else {
                    canvas.drawLine(startX, startY, stopPoint.x, stopPoint.y, linePaint)
                }

                startX = stopPoint.x
                startY = stopPoint.y
            }

            // 각 단계별 기준값 표시
//            if (i < step) {
//                val strValue = "${100 - 20 * i}"
//                textPaint.textAlign = Paint.Align.LEFT
//                canvas.drawText(
//                    strValue,
//                    startX + 10,
//                    textPaint.fontMetrics.getBaseLine(startY),
//                    textPaint
//                )
//            }
        }

        // 2. 중심으로부터 5각형의 각 꼭지점까지 잇는 라인 그리기
//        var startX = cx
//        var startY = cy - heightMaxValue
//        repeat(chartTypes.size) {
//            val stopPoint = transformRotate(radian, startX, startY, cx, cy)
//            canvas.drawLine(cx, cy, stopPoint.x, stopPoint.y, linePaint)
//
//            startX = stopPoint.x
//            startY = stopPoint.y
//        }

        // 3. 각 꼭지점 부근에 각 특성 문자열 표시하기
        startX = cx
        startY = (cy - 300f) * 0.7f
        r = 0f

        path.reset()
        chartTypes.forEach { type ->
            val point = transformRotate(r, startX, startY, cx, cy)

            val textHeight = textPaintNomal.fontMetrics.descent - textPaintNomal.fontMetrics.ascent  // 텍스트의 높이

            //꼭지점에 붙어 있는 글씨 위치
            var adjustedY = 0f
//            var iconY = 0f
            if (type.name.equals("pliability") || type.name.equals("agility")) {
                adjustedY = point.y - (textHeight / 2) - 7f
//                iconY = point.y - (textHeight * 3) - 10f
            } else if(type.name.equals("quickness")) {
                adjustedY = point.y - (textHeight / 7)
//                iconY = point.y - (textHeight * 2.5f) - 10f
            } else {
                adjustedY = point.y + textHeight + 5f
//                iconY = adjustedY + (textHeight / 2) + 1f  // 텍스트 바로 아래에 아이콘 배치
            }

            //아이콘 높이와 위치
            val iconThumbsHeight = thumbsUpIcon.height
            val iconThumbsY = adjustedY - (textHeight / 2) - iconThumbsHeight - 25f
            val iconCheerUpHeight = thumbsUpIcon.height
            val iconCheerUpY = adjustedY - (textHeight / 3) - iconCheerUpHeight - 10f


            //최대값 최소값 찾기
            val maxValue = thisWeekData?.maxOfOrNull { it.value } ?: 0
            val maxType = thisWeekData?.firstOrNull { it.value == maxValue }

            val minValue = thisWeekData?.minOfOrNull { it.value } ?: 0
            val minType = thisWeekData?.firstOrNull { it.value == minValue }

            //아이콘 붙이기 && 강조 텍스트 설정
            val paint = when {
                maxType != null && type.name == maxType.type.toString() -> {
                    canvas.drawBitmap(thumbsUpIcon, point.x - (thumbsUpIcon.width / 2), iconThumbsY, null)
                    textPaintMaxPoint
                }
                minType != null && type.name == minType.type.toString() -> {
                    canvas.drawBitmap(chearUpIcon, point.x - (chearUpIcon.width / 2), iconCheerUpY, null)
                    textPaintMinPoint
                }
                else -> textPaintNomal
            }

            canvas.drawText(
                type.value,
                point.x,
                adjustedY,
                paint
            )

            r += radian

//            val maxValue = thisWeekData?.maxOfOrNull { it.value } ?: 0
//            val maxType = thisWeekData?.firstOrNull { it.value == maxValue }
//
//            val minValue = thisWeekData?.minOfOrNull { it.value } ?: 0
//            val minType = thisWeekData?.firstOrNull { it.value == minValue }
//
//            if (maxType != null) {
//                if (type.name == maxType.type.toString()) {
//                    canvas.drawBitmap(thumbsUpIcon, point.x - (chearUpIcon.width / 2), iconY, null)
//                }
//            }
//            if (minType != null) {
//                if (type.name == minType.type.toString()) {
//                    canvas.drawBitmap(chearUpIcon, point.x - (chearUpIcon.width / 2), iconY, null)
//                }
//            }
        }

        // 지난 주 데이터 그리기
        lastWeekData?.let {
            drawRadarData(canvas, it, cx, cy, radius, heightMaxValue ,lastWeekPaint,false)
        }

        // 이번 주 데이터 그리기
        thisWeekData?.let {
            drawRadarData(canvas, it, cx, cy, radius, heightMaxValue,thisWeekPaint,true)
        }

    }

//    private fun setIcon(canvas: Canvas, data: List<RadarChartData>, maxValue :Int, minValue:Int) {
//        val point = transformRotate(r, startX, startY, width / 2f, height / 2f)
//        val textHeight = textPaintNomal.fontMetrics.descent - textPaintNomal.fontMetrics.ascent
//        //아이콘용
//        var minIconY = 0f
//        var maxIconY = 0f
//        var selectIcon : Bitmap? = null
//        var selectType = ""
//
//        // 최소값에 해당하는 아이콘 처리
//        data.forEach { item ->
//            if (item.value == minValue) {
//                selectType = item.type.toString()
//                selectIcon = chearUpIcon
//
//                minIconY = when {
//                    selectType == "pliability" || selectType == "agility" -> point.y - (textHeight * 3) - 10f
//                    selectType == "quickness" -> point.y - (textHeight * 2.5f) - 10f
//                    else -> point.y + (textHeight / 2) + 1f
//                }
//                Log.d("TAG", "minValue iconY => $minIconY")
//            }
//
//            if (item.value == maxValue) {
//                selectType = item.type.toString()
//                selectIcon = thumbsUpIcon
//
//                maxIconY = when {
//                    selectType == "pliability" || selectType == "agility" -> point.y - (textHeight * 3) - 10f
//                    selectType == "quickness" -> point.y - (textHeight * 2.5f) - 10f
//                    else -> point.y + (textHeight / 2) + 1f
//                }
//                Log.d("TAG", "maxValue iconY => $maxIconY")
//            }
//        }
//
//        // 아이콘 그리기
//        selectIcon?.let { icon ->
//            if (minValue != maxValue) {
//                canvas.drawBitmap(icon, point.x , minIconY, null)
//                canvas.drawBitmap(icon, point.x, maxIconY, null)
//            }
//        }
//
//    }
4. 도형 회전 용 함수
- 차트나 다각형의 데이터 포인트들이 정확하게 분포하기 위함 함수
- 함수는 주어진 점을 중심으로 특정 각도만큼 회전시켜주는 기능
- 이 함수를 사용하지 않으면, 차트나 도형의 각 꼭지점들이 원래의 위치에서 고정된 상태로 그려지게된다. 회전된 형태의 다각형(레이더 차트)을 그릴 수 없다.
private fun transformRotate(radian: Float, x: Float, y: Float, cx: Float, cy: Float): PointF {
        val stopX = cos(radian) * (x - cx) - sin(radian) * (y - cy) + cx
        val stopY = sin(radian) * (x - cx) + cos(radian) * (y - cy) + cy

        return PointF(stopX, stopY)
    }
5. 지난 주, 이번 주 데이터 그리기
- 레이더 차트 안에 지난주, 이번주 데이터 그리는 함수
- 각 데이터 포인트를 원형의 좌표계에 맞게 배치하고, 최대값과 최소값을 강조하는 원을 그려주는 기능
(1) 함수 시작
- canvas: 그래픽을 그릴 대상인 Canvas 객체입니다.
- data: RadarChartData 객체 리스트로, 레이더 차트의 각 점에 해당하는 데이터입니다.
- cx, cy: 차트의 중심 좌표입니다. 이 좌표를 기준으로 차트를 그립니다.
- radius: 차트의 전체 반지름입니다. (하지만 코드에서 사용되지 않음)
- heightMaxValue: 차트의 최대값을 나타내는 변수입니다. 이 값은 RadarChartData.value에 비례하여 각 점의 위치를 결정하는 데 사용됩니다.
- paint: 차트를 그리는 데 사용할 Paint 객체입니다.
- thisWeekData: 현재 차트가 이번 주 데이터인지 여부를 나타내는 불리언 값입니다. 이 값에 따라 최대값, 최소값에 표시를 추가합니다.
private fun drawRadarData(
    canvas: Canvas, data: List<RadarChartData>,
    cx: Float, cy: Float, radius: Float, heightMaxValue: Float, paint: Paint, thisWeekData: Boolean
)
(2) 데이터 포인트 계산 및 경로 생성
- path: 차트를 그릴 경로를 저장할 Path 객체
- angleStep: 데이터의 수에 맞게 각 데이터 포인트 간의 각도를 계산한다. 데이터가 6개라면 각도는 360°(2π 라디안)를 6으로 나눈 값이 된다
val path = Path()
val angleStep = 2 * Math.PI / data.size
(3) 최대값과 최소값 담을 변수 준비
- maxValue: 데이터에서 가장 큰 값을 저장할 변수.
- minValue: 데이터에서 가장 작은 값을 저장할 변수.
- maxIndex, minIndex: 각각 최대값과 최소값이 위치한 데이터 인덱스를 저장할 변수.
var maxValue = 0
var minValue = Int.MAX_VALUE
var maxIndex = 0
var minIndex = 0
(4) 각 데이터에 대한 계산 및 경로 설정
- forEachIndexed는 데이터를 인덱스와 함께 순회합니다.
- 각 데이터 포인트에 대해 각도(angle)와 반지름(valueRadius)을 계산하여, x, y 좌표를 구합니다.
-> heightMaxValue * (radarData.value / 100f)는 데이터의 값을 최대값에 맞춰 비례적으로 크기를 조정하는 부분입니다.
-> angle은 각 점의 위치를 원형 좌표계에 맞게 계산하는데 사용됩니다. Math.PI / 2를 빼는 이유는 차트의 기준이 12시 방향에 맞추어야 하기 때문입니다. - 첫 번째 데이터 포인트는 path.moveTo(x, y)로 경로를 시작하고, 이후의 데이터들은 path.lineTo(x, y)로 이어집니다
data.forEachIndexed { i, radarData ->
    val valueRadius = heightMaxValue * (radarData.value / 100f)
    val angle = i * angleStep - Math.PI / 2
    val x = cx + (valueRadius * Math.cos(angle)).toFloat()
    val y = cy + (valueRadius * Math.sin(angle)).toFloat()

    if (radarData.value > maxValue) {
        maxValue = radarData.value
        maxIndex = i
    }

    if (radarData.value < minValue) {
        minValue = radarData.value
        minIndex = i
    }

    if (i == 0) {
        path.moveTo(x, y)
    } else {
        path.lineTo(x, y)
    }
}
(5) 최대값과 최소값 표시(이번 주 데이터일 때만)
- thisWeekData가 true일 때만 최대값과 최소값을 강조합니다.
- 최대값과 최소값의 좌표는 각각 최대값과 최소값의 인덱스를 사용하여 계산합니다.
- 초록색 원은 최대값을, 빨간색 원은 최소값을 강조하는 데 사용됩니다. 각 원은 canvas.drawCircle로 그려집니다.
if (thisWeekData) {
    // 최대값 표시
    val maxAngle = maxIndex * angleStep - PI / 2
    val maxValueRadius = heightMaxValue * (maxValue / 100f)
    val maxX = cx + (maxValueRadius * Math.cos(maxAngle)).toFloat()
    val maxY = cy + (maxValueRadius * Math.sin(maxAngle)).toFloat()

    val greenCirclePaint = Paint().apply {
        color = Color.parseColor("#56A02F")  // 초록색
        style = Paint.Style.FILL
    }
    canvas.drawCircle(maxX, maxY, 25f, greenCirclePaint)

    // 최소값 표시
    val minAngle = minIndex * angleStep - PI / 2
    val minValueRadius = heightMaxValue * (minValue / 100f)
    val minX = cx + (minValueRadius * Math.cos(minAngle)).toFloat()
    val minY = cy + (minValueRadius * Math.sin(minAngle)).toFloat()

    val redCirclePaint = Paint().apply {
        color = Color.parseColor("#FF4747")  // 빨간색
        style = Paint.Style.FILL
    }
    canvas.drawCircle(minX, minY, 15f, redCirclePaint)
(6) 나머지 값에 대한 원 그리
- 최대값과 최소값을 제외한 나머지 값들에 대해서는 파란색 원을 그립니다.
- 각 원은 이전에 계산한 x, y 좌표에 맞게 그려집니다
data.forEachIndexed { i, radarData ->
    if (i != maxIndex && i != minIndex) {
        val valueRadius = heightMaxValue * (radarData.value / 100f)
        val angle = i * angleStep - Math.PI / 2
        val x = cx + (valueRadius * Math.cos(angle)).toFloat()
        val y = cy + (valueRadius * Math.sin(angle)).toFloat()

        val blueCirclePaint = Paint().apply {
            color = Color.parseColor("#62ADCE")  // 파란색
            style = Paint.Style.FILL
        }

        canvas.drawCircle(x, y, 18f, blueCirclePaint)
    }
}
drawRadarData 총코드
위 코드 한번에 보여주면 아래와 같음
private fun drawRadarData(
        canvas: Canvas, data: List<RadarChartData>,
        cx: Float, cy: Float, radius: Float,heightMaxValue:Float, paint: Paint, thisWeekData:Boolean
    ) {
        val path = Path()
        val angleStep = 2 * Math.PI / data.size

        var maxValue = 0
        var minValue = Int.MAX_VALUE
        var maxIndex = 0
        var minIndex = 0

        data.forEachIndexed { i, radarData ->
            // 'heightMaxValue'에 맞춰 크기 조정
            val valueRadius = heightMaxValue * (radarData.value / 100f)  // 값에 따라 크기 설정
            val angle = i * angleStep - Math.PI / 2  // 12시 방향으로 맞추기 위한 오프셋 적용
            val x = cx + (valueRadius * Math.cos(angle)).toFloat()
            val y = cy + (valueRadius * Math.sin(angle)).toFloat()

            // 최대값, 최소값을 찾고 그 인덱스를 기억
            if (radarData.value > maxValue) {
                maxValue = radarData.value
                maxIndex = i
            }

            if (radarData.value < minValue) {
                minValue = radarData.value
                minIndex = i
            }

            if (i == 0) {
                path.moveTo(x, y)
            } else {
                path.lineTo(x, y)
            }

        }

        path.close()
        canvas.drawPath(path, paint)

        if (thisWeekData) {
            // 최대값에 해당하는 모서리 점에 초록색 동그라미 (25f)
            val maxAngle = maxIndex * angleStep - PI / 2
            val maxValueRadius = heightMaxValue * (maxValue / 100f)  // 최대값에 해당하는 반지름
            val maxX = cx + (maxValueRadius * Math.cos(maxAngle)).toFloat()
            val maxY = cy + (maxValueRadius * Math.sin(maxAngle)).toFloat()

            val greenCirclePaint = Paint().apply {
                color = Color.parseColor("#56A02F")  // 최대값 강조용 초록색
                style = Paint.Style.FILL
            }

            // 초록색 동그라미 그리기
            canvas.drawCircle(maxX, maxY, 25f, greenCirclePaint)

            // 최소값에 해당하는 모서리 점에 빨간 동그라미 (15f)
            val minAngle = minIndex * angleStep - PI / 2
            val minValueRadius = heightMaxValue * (minValue / 100f)  // 최소값에 해당하는 반지름
            val minX = cx + (minValueRadius * Math.cos(minAngle)).toFloat()
            val minY = cy + (minValueRadius * Math.sin(minAngle)).toFloat()

            val redCirclePaint = Paint().apply {
                color = Color.parseColor("#FF4747")  // 최소값 강조용 빨간색
                style = Paint.Style.FILL
            }

            // 빨간 동그라미 그리기
            canvas.drawCircle(minX, minY, 15f, redCirclePaint)

            // 나머지 값에 파란 동그라미 (18f)
            data.forEachIndexed { i, radarData ->
                if (i != maxIndex && i != minIndex) {
                    val valueRadius = heightMaxValue * (radarData.value / 100f)  // 값에 따라 크기 설정
                    val angle = i * angleStep - Math.PI / 2  // 12시 방향으로 맞추기 위한 오프셋 적용
                    val x = cx + (valueRadius * Math.cos(angle)).toFloat()
                    val y = cy + (valueRadius * Math.sin(angle)).toFloat()

                    val blueCirclePaint = Paint().apply {
                        color = Color.parseColor("#62ADCE")  // 나머지 값에 파란색
                        style = Paint.Style.FILL
                    }

                    // 파란 동그라미 그리기
                    canvas.drawCircle(x, y, 18f, blueCirclePaint)
                }
            }
        }
    }
위 코드 통합본
package com.airpass.aifitparentapp.utils

import android.content.Context
import android.graphics.BitmapFactory
import android.graphics.Canvas
import android.graphics.Color
import android.graphics.Paint
import android.graphics.Path
import android.graphics.PointF
import android.util.AttributeSet
import android.util.Log
import android.view.View
import androidx.core.content.res.ResourcesCompat
import com.airpass.aifitparentapp.R
import com.airpass.aifitparentapp.utils.ImageUtils.Companion.vectorToBitmap
import java.lang.Math.PI
import java.lang.Math.min
import kotlin.math.cos
import kotlin.math.sin

data class RadarChartData(
    val type: CharacteristicType,
    val value: Int
)

enum class CharacteristicType(val value: String) {
    quickness("순발력"),
    agility("민첩성"),
    muscularEndurance("근지구력"),
    equilibrium("평형성"),
    pliability("유연성"),
}

class RadarChartView @JvmOverloads constructor(
    context: Context, attrs: AttributeSet? = null, defStyleAttr: Int = 0
) : View(context, attrs, defStyleAttr) {

    private val linePaint = Paint().apply {
        color = Color.parseColor("#C8C8C8")
        style = Paint.Style.STROKE
        strokeWidth = 2f
    }
    private val firstLinePaint = Paint().apply {
        color = Color.parseColor("#0C4E8C")
        style = Paint.Style.STROKE
        strokeWidth = 5f
    }
    private val textPaintNomal = Paint().apply {
        color = Color.parseColor("#0C4E8C")
        textSize = 14f * resources.displayMetrics.scaledDensity
        textAlign = Paint.Align.CENTER
        typeface = ResourcesCompat.getFont(context, R.font.pretendard_medium)
    }
    private val textPaintMaxPoint = Paint().apply {
        color = Color.parseColor("#56A02F")
        textSize = 16f * resources.displayMetrics.scaledDensity
        textAlign = Paint.Align.CENTER
        typeface = ResourcesCompat.getFont(context, R.font.pretendard_bold)
    }
    private val textPaintMinPoint = Paint().apply {
        color = Color.parseColor("#FF4747")
        textSize = 16f * resources.displayMetrics.scaledDensity
        textAlign = Paint.Align.CENTER
        typeface = ResourcesCompat.getFont(context, R.font.pretendard_bold)
    }
    private val lastWeekPaint = Paint().apply {
        color = Color.parseColor("#9A9A9A")
        style = Paint.Style.FILL_AND_STROKE
        alpha = 100
    }
    private val thisWeekPaint = Paint().apply {
        color = Color.parseColor("#62ADCE")
        style = Paint.Style.FILL_AND_STROKE
        alpha = 100
    }

    private var lastWeekData: List<RadarChartData>? = null
    private var thisWeekData: List<RadarChartData>? = null

    fun setDataLists(lastWeekData: List<RadarChartData>, thisWeekData: List<RadarChartData>) {
        this.lastWeekData = lastWeekData
        Log.d("chart","lastWeekData => $lastWeekData")
        this.thisWeekData = thisWeekData
        Log.d("chart","thisWeekData => $thisWeekData")
        invalidate() // 뷰를 다시 그립니다
    }

    private var path = Path()

    // 아이콘 비트맵 추가
    private val thumbsUpIcon = vectorToBitmap(context, R.drawable.thumbs_up)
//    private val chearUpIcon = BitmapFactory.decodeResource(resources, R.drawable.cheer_up)
    private val chearUpIcon = vectorToBitmap(context, R.drawable.cheer_up)

    //차트에 보여질 순서 맨 위부터 시계방향
    private var chartTypes = arrayListOf(
        CharacteristicType.quickness,
        CharacteristicType.muscularEndurance,
        CharacteristicType.equilibrium,
        CharacteristicType.pliability,
        CharacteristicType.agility
    )

    var startX = 0f
    var startY = 0f
    var r = 0f

    override fun onDraw(canvas: Canvas) {
        super.onDraw(canvas)

        // 중심점 좌표
        val cx = width / 2f
        val cy = height / 2f
        val radius = min(cx, cy) * 0.8f * 1f   // 반경 설정

        // 각도 단계 설정 (각도를 5등분)
        val radian = PI.toFloat() * 2 / 5

        val step = 5
        val heightMaxValue =  min(cx, cy) * 0.7f * 1f

        val heightStep = heightMaxValue / step // 1단계에 해당하는 높이

        // 5개의 꼭지점 그리기
        for (i in 0..step) {
            var startX = cx
            var startY = (cy - heightMaxValue) + heightStep * i

            repeat(chartTypes.size) {
                // 중심좌표를 기준으로 점(startX,startY)를 radian만큼씩 회전시킨 점(stopX, stopY)을 계산한다.
                val stopPoint = transformRotate(radian, startX, startY, cx, cy)

                if (i==0) {
                    canvas.drawLine(startX, startY, stopPoint.x, stopPoint.y, firstLinePaint)
                } else {
                    canvas.drawLine(startX, startY, stopPoint.x, stopPoint.y, linePaint)
                }

                startX = stopPoint.x
                startY = stopPoint.y
            }

            // 각 단계별 기준값 표시
//            if (i < step) {
//                val strValue = "${100 - 20 * i}"
//                textPaint.textAlign = Paint.Align.LEFT
//                canvas.drawText(
//                    strValue,
//                    startX + 10,
//                    textPaint.fontMetrics.getBaseLine(startY),
//                    textPaint
//                )
//            }
        }

        // 2. 중심으로부터 5각형의 각 꼭지점까지 잇는 라인 그리기
//        var startX = cx
//        var startY = cy - heightMaxValue
//        repeat(chartTypes.size) {
//            val stopPoint = transformRotate(radian, startX, startY, cx, cy)
//            canvas.drawLine(cx, cy, stopPoint.x, stopPoint.y, linePaint)
//
//            startX = stopPoint.x
//            startY = stopPoint.y
//        }

        // 3. 각 꼭지점 부근에 각 특성 문자열 표시하기
        startX = cx
        startY = (cy - 300f) * 0.7f
        r = 0f

        path.reset()
        chartTypes.forEach { type ->
            val point = transformRotate(r, startX, startY, cx, cy)

            val textHeight = textPaintNomal.fontMetrics.descent - textPaintNomal.fontMetrics.ascent  // 텍스트의 높이

            //꼭지점에 붙어 있는 글씨 위치
            var adjustedY = 0f
//            var iconY = 0f
            if (type.name.equals("pliability") || type.name.equals("agility")) {
                adjustedY = point.y - (textHeight / 2) - 7f
//                iconY = point.y - (textHeight * 3) - 10f
            } else if(type.name.equals("quickness")) {
                adjustedY = point.y - (textHeight / 7)
//                iconY = point.y - (textHeight * 2.5f) - 10f
            } else {
                adjustedY = point.y + textHeight + 5f
//                iconY = adjustedY + (textHeight / 2) + 1f  // 텍스트 바로 아래에 아이콘 배치
            }

            //아이콘 높이와 위치
            val iconThumbsHeight = thumbsUpIcon.height
            val iconThumbsY = adjustedY - (textHeight / 2) - iconThumbsHeight - 25f
            val iconCheerUpHeight = thumbsUpIcon.height
            val iconCheerUpY = adjustedY - (textHeight / 3) - iconCheerUpHeight - 10f


            //최대값 최소값 찾기
            val maxValue = thisWeekData?.maxOfOrNull { it.value } ?: 0
            val maxType = thisWeekData?.firstOrNull { it.value == maxValue }

            val minValue = thisWeekData?.minOfOrNull { it.value } ?: 0
            val minType = thisWeekData?.firstOrNull { it.value == minValue }

            //아이콘 붙이기 && 강조 텍스트 설정
            val paint = when {
                maxType != null && type.name == maxType.type.toString() -> {
                    canvas.drawBitmap(thumbsUpIcon, point.x - (thumbsUpIcon.width / 2), iconThumbsY, null)
                    textPaintMaxPoint
                }
                minType != null && type.name == minType.type.toString() -> {
                    canvas.drawBitmap(chearUpIcon, point.x - (chearUpIcon.width / 2), iconCheerUpY, null)
                    textPaintMinPoint
                }
                else -> textPaintNomal
            }

            canvas.drawText(
                type.value,
                point.x,
                adjustedY,
                paint
            )

            r += radian

//            val maxValue = thisWeekData?.maxOfOrNull { it.value } ?: 0
//            val maxType = thisWeekData?.firstOrNull { it.value == maxValue }
//
//            val minValue = thisWeekData?.minOfOrNull { it.value } ?: 0
//            val minType = thisWeekData?.firstOrNull { it.value == minValue }
//
//            if (maxType != null) {
//                if (type.name == maxType.type.toString()) {
//                    canvas.drawBitmap(thumbsUpIcon, point.x - (chearUpIcon.width / 2), iconY, null)
//                }
//            }
//            if (minType != null) {
//                if (type.name == minType.type.toString()) {
//                    canvas.drawBitmap(chearUpIcon, point.x - (chearUpIcon.width / 2), iconY, null)
//                }
//            }
        }

        // 지난 주 데이터 그리기
        lastWeekData?.let {
            drawRadarData(canvas, it, cx, cy, radius, heightMaxValue ,lastWeekPaint,false)
        }

        // 이번 주 데이터 그리기
        thisWeekData?.let {
            drawRadarData(canvas, it, cx, cy, radius, heightMaxValue,thisWeekPaint,true)
        }

    }

//    private fun setIcon(canvas: Canvas, data: List<RadarChartData>, maxValue :Int, minValue:Int) {
//        val point = transformRotate(r, startX, startY, width / 2f, height / 2f)
//        val textHeight = textPaintNomal.fontMetrics.descent - textPaintNomal.fontMetrics.ascent
//        //아이콘용
//        var minIconY = 0f
//        var maxIconY = 0f
//        var selectIcon : Bitmap? = null
//        var selectType = ""
//
//        // 최소값에 해당하는 아이콘 처리
//        data.forEach { item ->
//            if (item.value == minValue) {
//                selectType = item.type.toString()
//                selectIcon = chearUpIcon
//
//                minIconY = when {
//                    selectType == "pliability" || selectType == "agility" -> point.y - (textHeight * 3) - 10f
//                    selectType == "quickness" -> point.y - (textHeight * 2.5f) - 10f
//                    else -> point.y + (textHeight / 2) + 1f
//                }
//                Log.d("TAG", "minValue iconY => $minIconY")
//            }
//
//            if (item.value == maxValue) {
//                selectType = item.type.toString()
//                selectIcon = thumbsUpIcon
//
//                maxIconY = when {
//                    selectType == "pliability" || selectType == "agility" -> point.y - (textHeight * 3) - 10f
//                    selectType == "quickness" -> point.y - (textHeight * 2.5f) - 10f
//                    else -> point.y + (textHeight / 2) + 1f
//                }
//                Log.d("TAG", "maxValue iconY => $maxIconY")
//            }
//        }
//
//        // 아이콘 그리기
//        selectIcon?.let { icon ->
//            if (minValue != maxValue) {
//                canvas.drawBitmap(icon, point.x , minIconY, null)
//                canvas.drawBitmap(icon, point.x, maxIconY, null)
//            }
//        }
//
//    }

    private fun transformRotate(radian: Float, x: Float, y: Float, cx: Float, cy: Float): PointF {
        val stopX = cos(radian) * (x - cx) - sin(radian) * (y - cy) + cx
        val stopY = sin(radian) * (x - cx) + cos(radian) * (y - cy) + cy

        return PointF(stopX, stopY)
    }

    // 방사형 데이터 그리기 (지난 주, 이번 주 데이터 그리기)
    private fun drawRadarData(
        canvas: Canvas, data: List<RadarChartData>,
        cx: Float, cy: Float, radius: Float,heightMaxValue:Float, paint: Paint, thisWeekData:Boolean
    ) {
        val path = Path()
        val angleStep = 2 * Math.PI / data.size

        var maxValue = 0
        var minValue = Int.MAX_VALUE
        var maxIndex = 0
        var minIndex = 0

        data.forEachIndexed { i, radarData ->
            // 'heightMaxValue'에 맞춰 크기 조정
            val valueRadius = heightMaxValue * (radarData.value / 100f)  // 값에 따라 크기 설정
            val angle = i * angleStep - Math.PI / 2  // 12시 방향으로 맞추기 위한 오프셋 적용
            val x = cx + (valueRadius * Math.cos(angle)).toFloat()
            val y = cy + (valueRadius * Math.sin(angle)).toFloat()

            // 최대값, 최소값을 찾고 그 인덱스를 기억
            if (radarData.value > maxValue) {
                maxValue = radarData.value
                maxIndex = i
            }

            if (radarData.value < minValue) {
                minValue = radarData.value
                minIndex = i
            }

            if (i == 0) {
                path.moveTo(x, y)
            } else {
                path.lineTo(x, y)
            }

        }

        path.close()
        canvas.drawPath(path, paint)

        if (thisWeekData) {
            // 최대값에 해당하는 모서리 점에 초록색 동그라미 (25f)
            val maxAngle = maxIndex * angleStep - PI / 2
            val maxValueRadius = heightMaxValue * (maxValue / 100f)  // 최대값에 해당하는 반지름
            val maxX = cx + (maxValueRadius * Math.cos(maxAngle)).toFloat()
            val maxY = cy + (maxValueRadius * Math.sin(maxAngle)).toFloat()

            val greenCirclePaint = Paint().apply {
                color = Color.parseColor("#56A02F")  // 최대값 강조용 초록색
                style = Paint.Style.FILL
            }

            // 초록색 동그라미 그리기
            canvas.drawCircle(maxX, maxY, 25f, greenCirclePaint)

            // 최소값에 해당하는 모서리 점에 빨간 동그라미 (15f)
            val minAngle = minIndex * angleStep - PI / 2
            val minValueRadius = heightMaxValue * (minValue / 100f)  // 최소값에 해당하는 반지름
            val minX = cx + (minValueRadius * Math.cos(minAngle)).toFloat()
            val minY = cy + (minValueRadius * Math.sin(minAngle)).toFloat()

            val redCirclePaint = Paint().apply {
                color = Color.parseColor("#FF4747")  // 최소값 강조용 빨간색
                style = Paint.Style.FILL
            }

            // 빨간 동그라미 그리기
            canvas.drawCircle(minX, minY, 15f, redCirclePaint)

            // 나머지 값에 파란 동그라미 (18f)
            data.forEachIndexed { i, radarData ->
                if (i != maxIndex && i != minIndex) {
                    val valueRadius = heightMaxValue * (radarData.value / 100f)  // 값에 따라 크기 설정
                    val angle = i * angleStep - Math.PI / 2  // 12시 방향으로 맞추기 위한 오프셋 적용
                    val x = cx + (valueRadius * Math.cos(angle)).toFloat()
                    val y = cy + (valueRadius * Math.sin(angle)).toFloat()

                    val blueCirclePaint = Paint().apply {
                        color = Color.parseColor("#62ADCE")  // 나머지 값에 파란색
                        style = Paint.Style.FILL
                    }

                    // 파란 동그라미 그리기
                    canvas.drawCircle(x, y, 18f, blueCirclePaint)
                }
            }
        }
    }

//    private fun drawRadarData(
//        canvas: Canvas, data: List<RadarChartData>,
//        cx: Float, cy: Float, radius: Float,heightMaxValue:Float, paint: Paint,
//    ) {
//        val path = android.graphics.Path()
//        val angleStep = 2 * Math.PI / data.size
//
//        data.forEachIndexed { i, radarData ->
//            // 'heightMaxValue'에 맞춰 크기 조정
//            val valueRadius = heightMaxValue * (radarData.value / 100f)  // 값에 따라 크기 설정
//            val angle = i * angleStep - Math.PI / 2  // 12시 방향으로 맞추기 위한 오프셋 적용
//            val x = cx + (valueRadius * Math.cos(angle)).toFloat()
//            val y = cy + (valueRadius * Math.sin(angle)).toFloat()
//
//            if (i == 0) {
//                path.moveTo(x, y)
//            } else {
//                path.lineTo(x, y)
//            }
//        }
//
//        path.close()
//        canvas.drawPath(path, paint)
//    }

}

// y좌표가 중심이 오도록 문자열을 그릴수 있도록하는 baseline좌표를 반환
fun Paint.FontMetrics.getBaseLine(y: Float): Float {
    val halfTextAreaHeight = (bottom - top) / 2
    return y - halfTextAreaHeight - top
}
뷰에 보여주기
1. 레이아웃에 위에 작성한 코드 삽입
<com.myApp.parentapp.utils.RadarChartView
        android:id="@+id/radarChart"
        android:layout_marginTop="30dp"
        android:layout_width="0dp"
        android:layout_height="450dp"
        app:layout_constraintTop_toBottomOf="@id/lly_explain"
        app:layout_constraintStart_toStartOf="parent"
        app:layout_constraintEnd_toEndOf="parent"
        app:layout_constraintBottom_toBottomOf="parent"/>
나처럼 꼭 디자이너 시안에 맞추지 않아도 된다면 먼길 돌아가지 말고 아래 api 사용 추천함,,,
https://github.com/PhilJay/MPAndroidChart

보조기억장치