학습내용
Git, Github
Fork : branch 생성
clone : 개인 pc에서 작업
commit : branch에 적용
pull request : master에 pull
Markdown
# Heading 1~6
___ 선으로 분리
**bold**
*itlaic*
~~strikethrough~~
>
* 목록
- 목록
[](링크)

|Header|Description|
|--|--|
표
`코드`
```java
코드블럭EDA
#colab plot의 한글깨짐 해결

import matplotlib as mpl
import matplotlib.pyplot as plt

%config InlineBackend.figure_format = 'retina'

!apt -qq -y install fonts-nanum

import matplotlib.font_manager as fm
fontpath = '/usr/share/fonts/truetype/nanum/NanumBarunGothic.ttf'
font = fm.FontProperties(fname=fontpath, size=9)
plt.rc('font', family='NanumBarunGothic')
mpl.font_manager._rebuild()
# plot
import matplotlib.pyplot as plt
plt.figure(figsize=(18,5)) #그래프 크기설정
#plt.subplot(121) #한번에 여러 그래프 출력
for date in dates:
plt.plot(df3.loc[df3['new_date'] == date]['Close'])
plt.legend(dates) #plot labeling
plt.grid(True, axis='y') # 격자 생성
plt.ylabel("Close Price")
plt.title("Stock Price Movement Grouped by Year on Close")
plt.show()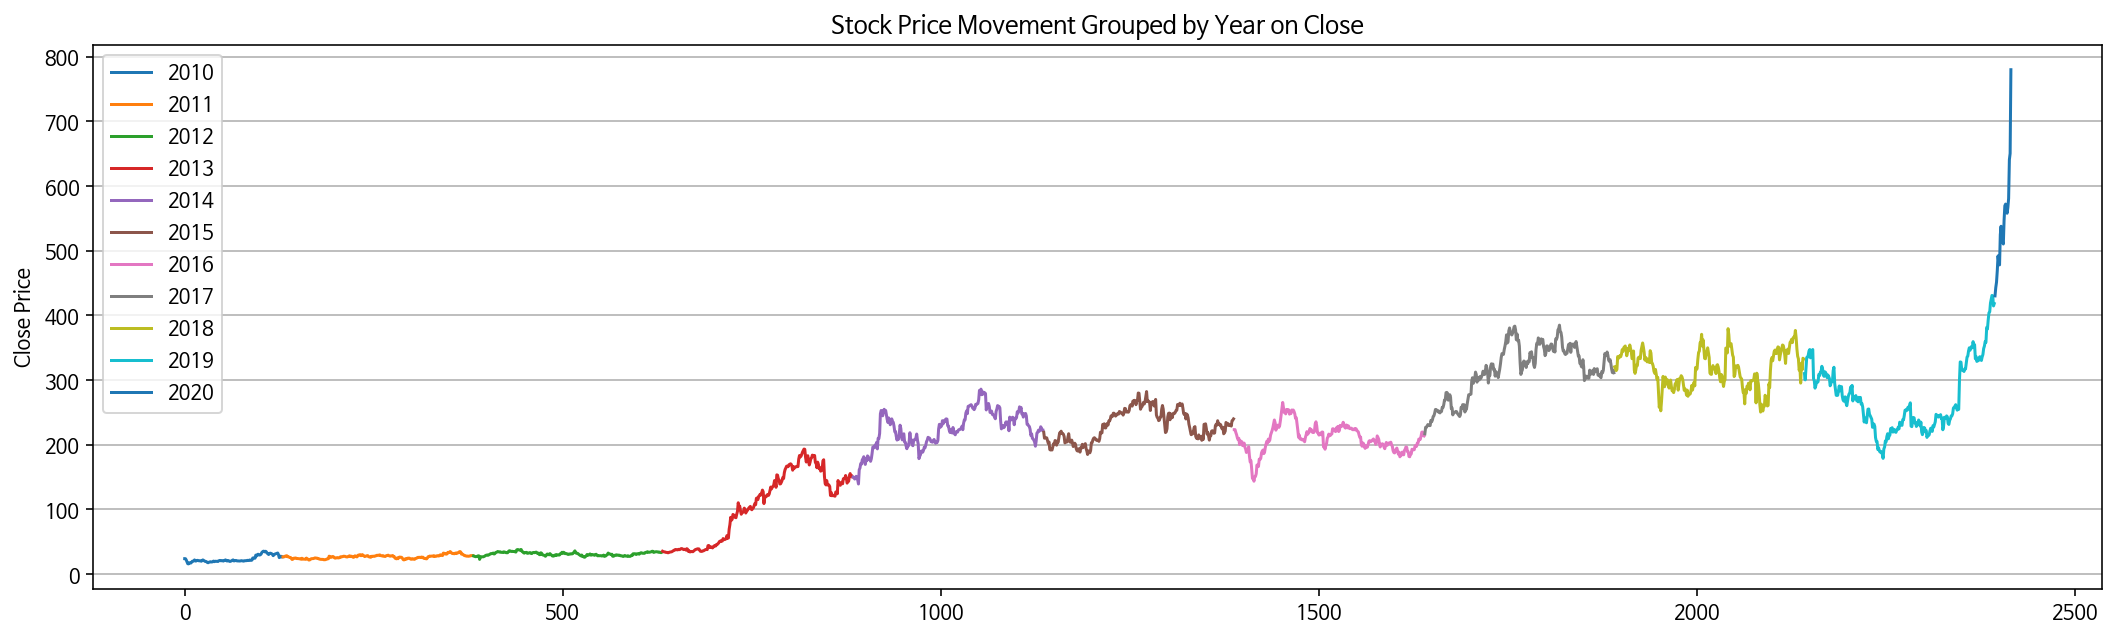
#url을 지정하여 파일불러오기, excel파일 sheet는 index 또는 sheet명으로 불러오기 가능.

import pandas as pd

url = ' '

df1 = pd.read_excel(url, sheet_name=0)
df2 = pd.read_excel(url, sheet_name='035250')
# pandas 기본 함수
import pandas as pd
df.shape #dimension 확인
df.isna() #na확인
df.fillna(value = 0, inplace=True) #na처리
df.columns = [] #데이터프레임 칼럼지정
df.to_csv('df.csv') #csv로 저장
df.value_counts() #value 종류와 그 개수
pd.DataFrame(df[1:], columns=df.iloc[0]) #첫 row를 데이터프레임 column명으로- 추가 공부계획 : git 문법 및 작동process, pandas, 그래프를 사용한 시각화