Background
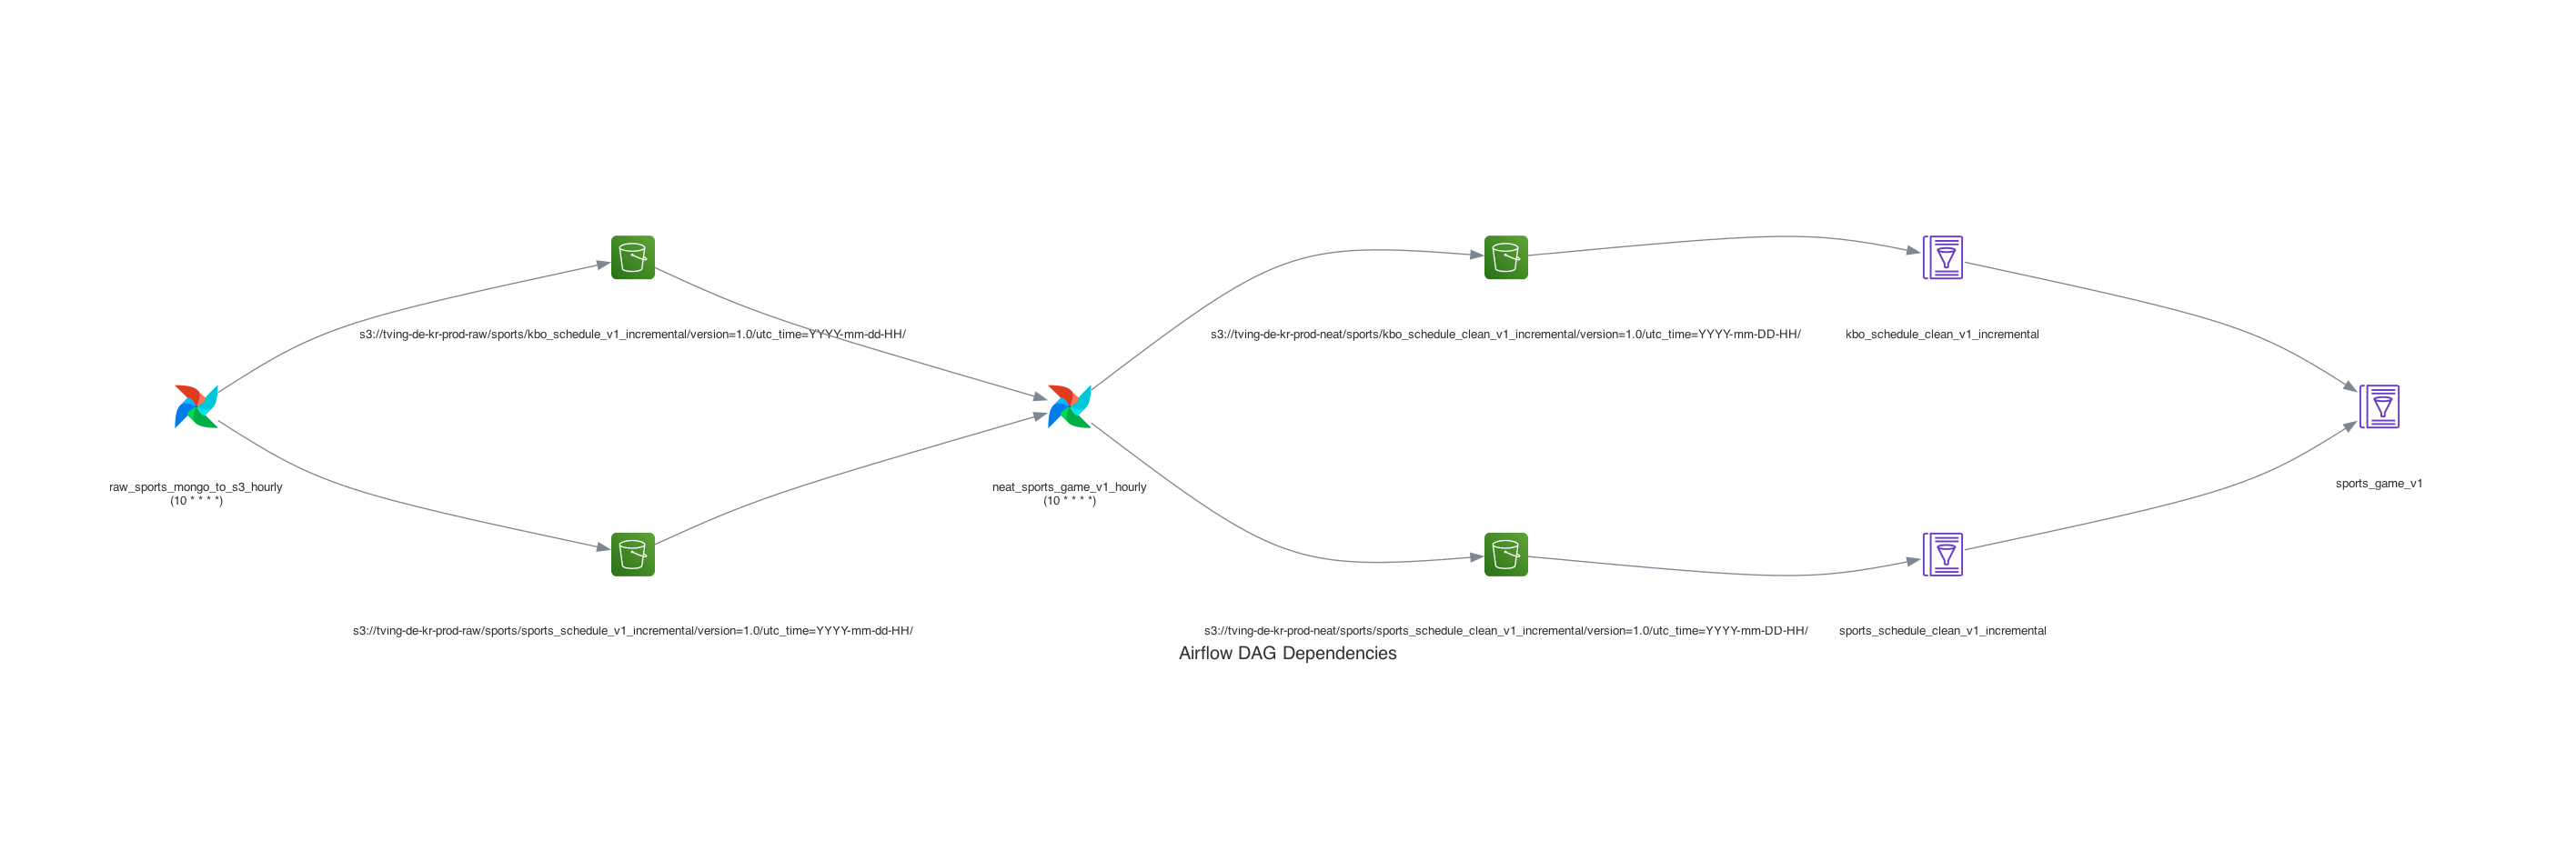
- Airflow Dag 개발 중 Airflow WEB UI 에서 제공하는 Dag 종속성 페이지가 너무 보기 불편하여, 특정 주제(도메인)에 대한 Dag 종속성만 따로 관리하고자 별도 시각화 방법을 알아 보았다.
- Python diagrams 라이브러리를 이용하면 각 Task 의 흐름을 Dag 의 Task 실행 순서와 같이 shift 명령으로 구현 가능하다.
- 얼마나 편하고 유용할지 모르겠으나, 한 번 사용해보자.
Package Dependency
- OS: Mac OS M1
- Python: Python 3.10.16
$ brew install graphviz
$ python3 -m pip install diagrams
Code Example
from diagrams import Diagram

from diagrams.aws.storage import S3
from diagrams.aws.analytics import GlueDataCatalog
from diagrams.onprem.workflow import Airflow
# from diagrams.aws.compute import ECS
# from diagrams.generic.database import SQL


graph_attrs = {
    "splines": "curved",  # 화살표를 곡선으로 설정
    "ranksep": "3.5",     # 행(아이콘 좌우) 간 간격
    "nodesep": "1.5",     # 노드(아이콘 위아래) 간 간격
}

node_attrs = {
    "width": "0.5",       # 너비 설정 (기본값보다 작게 설정)
    "height": "0.5",      # 높이 설정 (기본값보다 작게 설정)
    "fixedsize": "true",  # 아이콘 크기 고정
    "fontsize": "10",     # 폰트 크기
}


with Diagram("TEST Dependencies", show=True, graph_attr=graph_attrs, node_attr=node_attrs):
    dag_a = Airflow("DAG_A\n(10 * * * *)")
    s3_a = S3('s3://my-bucket/my-prefix-b/year=YYYY/month=mm/day=dd/hour=HH/')
    s3_b = S3('s3://my-bucket/my-prefix-a/year=YYYY/month=mm/day=dd/hour=HH/')


    dag_b = Airflow("DAG_B\n(10 * * * *)")
    s3_c = S3('s3://my-bucket/my-prefix-c/year=YYYY/month=mm/day=dd/hour=HH/')
    s3_D = S3('s3://my-bucket/my-prefix-d/year=YYYY/month=mm/day=dd/hour=HH/')
    glue_table_a = GlueDataCatalog('glue_table_a')
    glue_table_b = GlueDataCatalog('glue_table_b')
    glue_table_c = GlueDataCatalog('glue_table_c')


    dag_a >> [s3_a, s3_b] >> \
    dag_b >> [s3_c, s3_D]


    s3_c >> glue_table_a
    s3_D >> glue_table_b

    [ glue_table_a, glue_table_b ] >> glue_table_c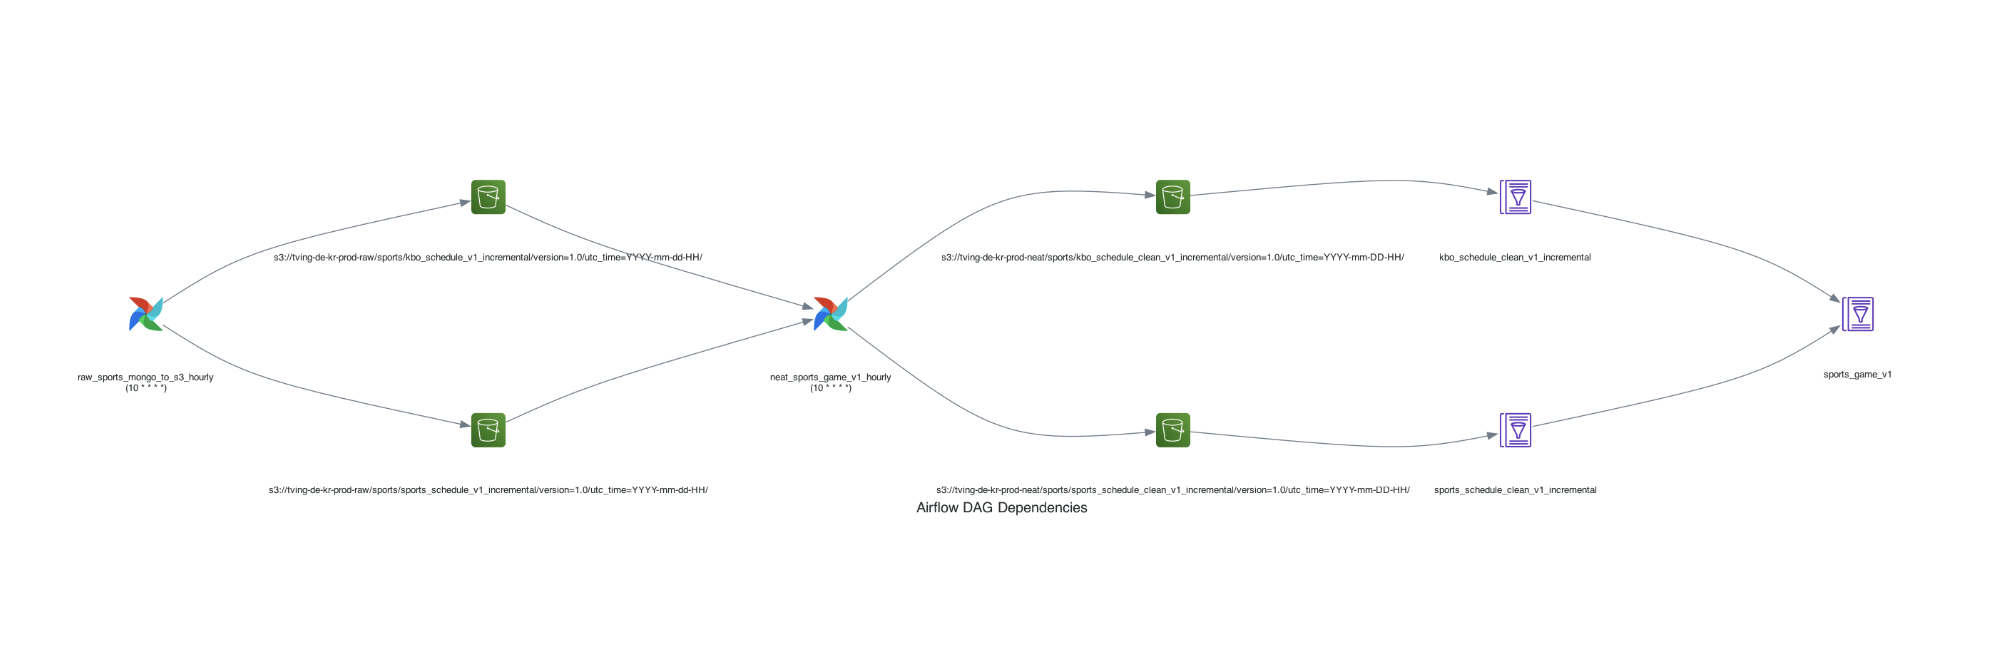

안녕하세요. 데이터 엔지니어 김재민 입니다.