https://ddii.dev/kubernetes/k6-prometheus/
https://sjparkk-dev1og.tistory.com/221
지피티 ㅅㅂ 쓸모없음
사용할 모니터링 도구
https://grafana.com/grafana/dashboards/18030-k6-prometheus-native-histograms/
Prometheus.yml 수정
global:
  scrape_interval: 15s
  evaluation_interval: 15s

alerting:
  alertmanagers:
    - static_configs:
        - targets:

scrape_configs:
  - job_name: 'prometheus'
    static_configs:
      - targets: [ 'prometheus:9090' ]

  - job_name: 'cs25-service'
    metrics_path: '/actuator/prometheus'
    static_configs:
      - targets: [ 'cs25-service:9292' ] # 추후 해당 백엔드가 올라가는 ec2 인스턴스의 프라이빗 ip로 변경

  - job_name: 'cs25-batch'
    metrics_path: '/actuator/prometheus'
    static_configs:
      - targets: [ 'cs25-batch:9292' ] # 추후 해당 배치가 올라가는 ec2 인스턴스의 프라이빗 ip로 변경

  - job_name: 'localhost-service'
    metrics_path: '/actuator/prometheus'
    static_configs:
      - targets: [ 'host.docker.internal:9292' ] # 로컬 테스트용

  - job_name: 'k6'
    static_configs:
      - targets: [ 'k6:6565' ] # k6용
Docker-compose.yml 수정
  prometheus:
    image: prom/prometheus
    container_name: prometheus
    volumes:
      - ./prometheus:/etc/prometheus
    ports:
      - "9090:9090"
    command:
      - --web.enable-remote-write-receiver
      - '--config.file=/etc/prometheus/prometheus.yml'
      - "--enable-feature=native-histograms"
    networks:
      - monitoring

  grafana:
    image: grafana/grafana
    container_name: grafana
    ports:
      - "3000:3000"
    volumes:
      - grafana-data:/var/lib/grafana
    depends_on:
      - prometheus
    networks:
      - monitoring

  k6:
    image: my-k6-prometheus
    container_name: k6
    volumes:
      - ./k6/scripts:/scripts
    environment:
      - K6_PROMETHEUS_RW_SERVER_URL=http://prometheus:9090/api/v1/write
      - K6_PROMETHEUS_RW_TREND_AS_NATIVE_HISTOGRAM=true
    ports:
      - "6565:6565"
    command: run --out experimental-prometheus-rw /scripts/test.js
    depends_on:
      - prometheus
    extra_hosts:
      - "host.docker.internal:host-gateway"
    networks:
      - monitoring
k6 설정
루트 프로젝트에다가 만들어주삼
Dockerfile
FROM golang:1.24 as builder

RUN go install go.k6.io/xk6/cmd/xk6@latest
RUN xk6 build --output /k6 \
  --with github.com/grafana/xk6-output-prometheus-remote@latest

# Step 2: 기본 k6 이미지에 빌드된 k6 복사
FROM grafana/k6:latest
COPY --from=builder /k6 /usr/bin/k6
이거하고 터미널창에서 이미지 업로드
docker build -f k6\Dockerfile -t my-k6-prometheus .
 // Window는 이거
docker build -f k6/Dockerfile -t my-k6-prometheus .
// Mac은 이걸로 해야함
test.js
이건 필요한대로짜삼
import http from 'k6/http';
import {sleep} from 'k6';

export const options = {
  vus: 100,
  duration: '30s',
};

export default function () {
  const subscriptionId = __VU; // 1 ~ vus (1000)
  const res = http.get(
      `http://host.docker.internal:8080/accuracyTest/getTodayQuiz/${subscriptionId}`);
  console.log(`VU ${__VU}: Status ${res.status}`);
  sleep(1);
}
기본적으로 k6 는 해당 스크립트 종료되면 도커에서도 종료됨 참고
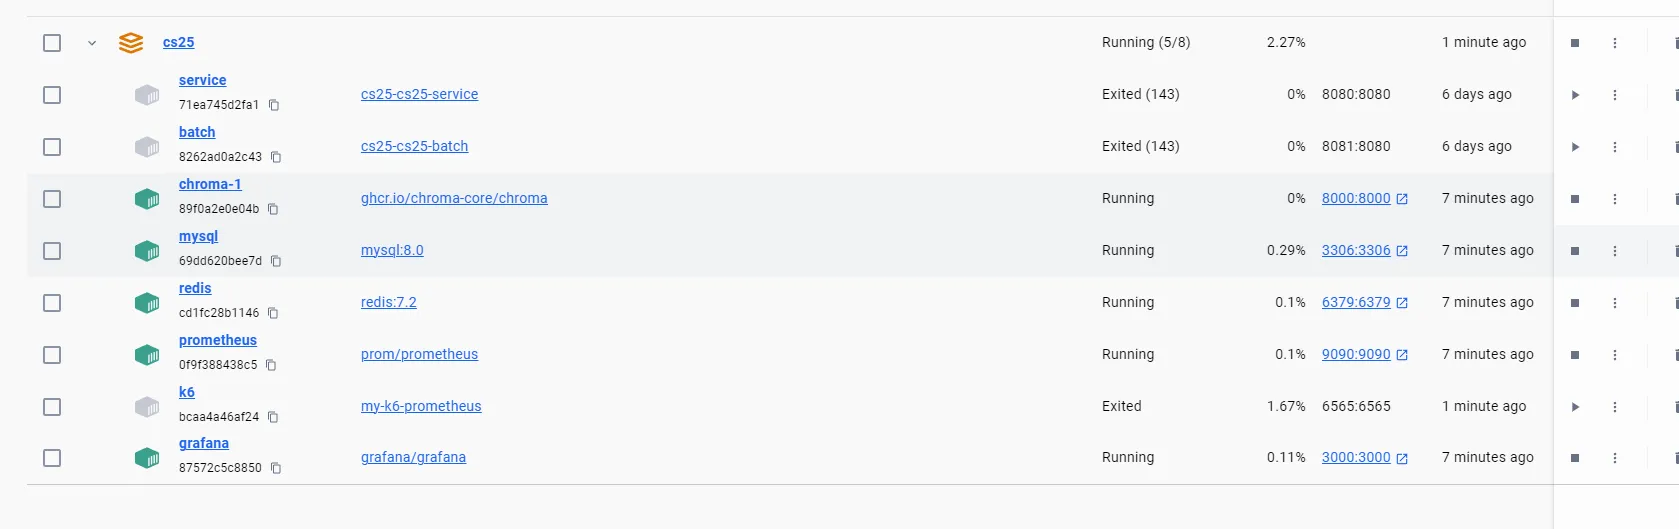
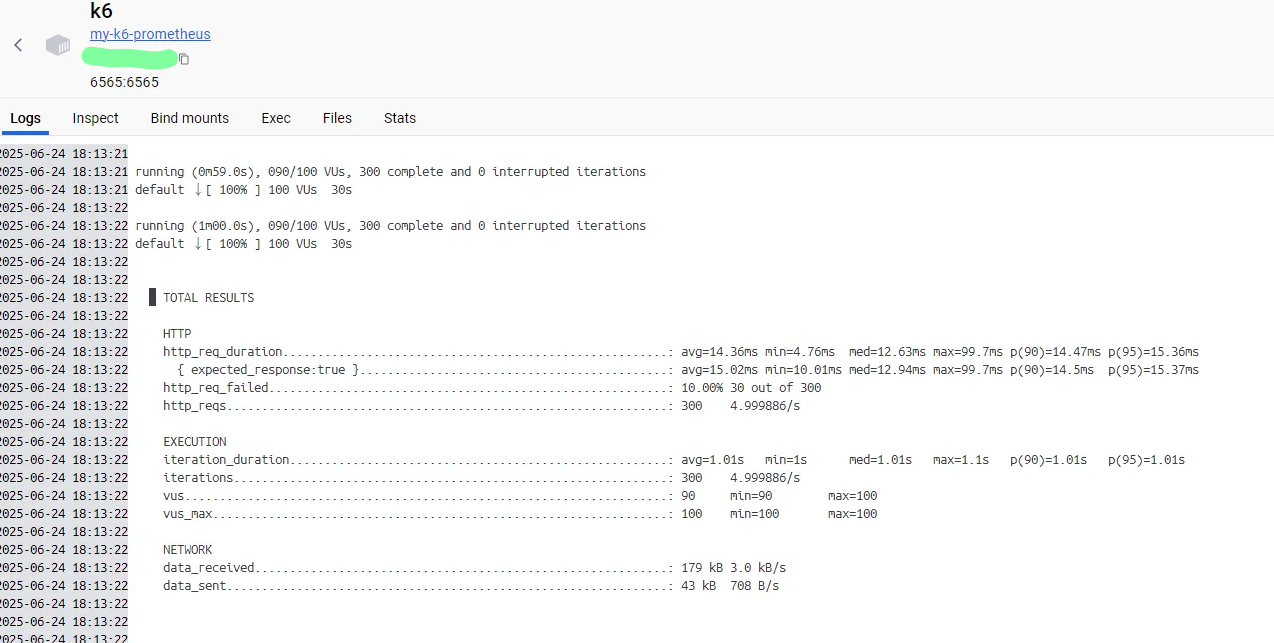
k6안에 들어가면 요청보낸거 그대로 다뜸
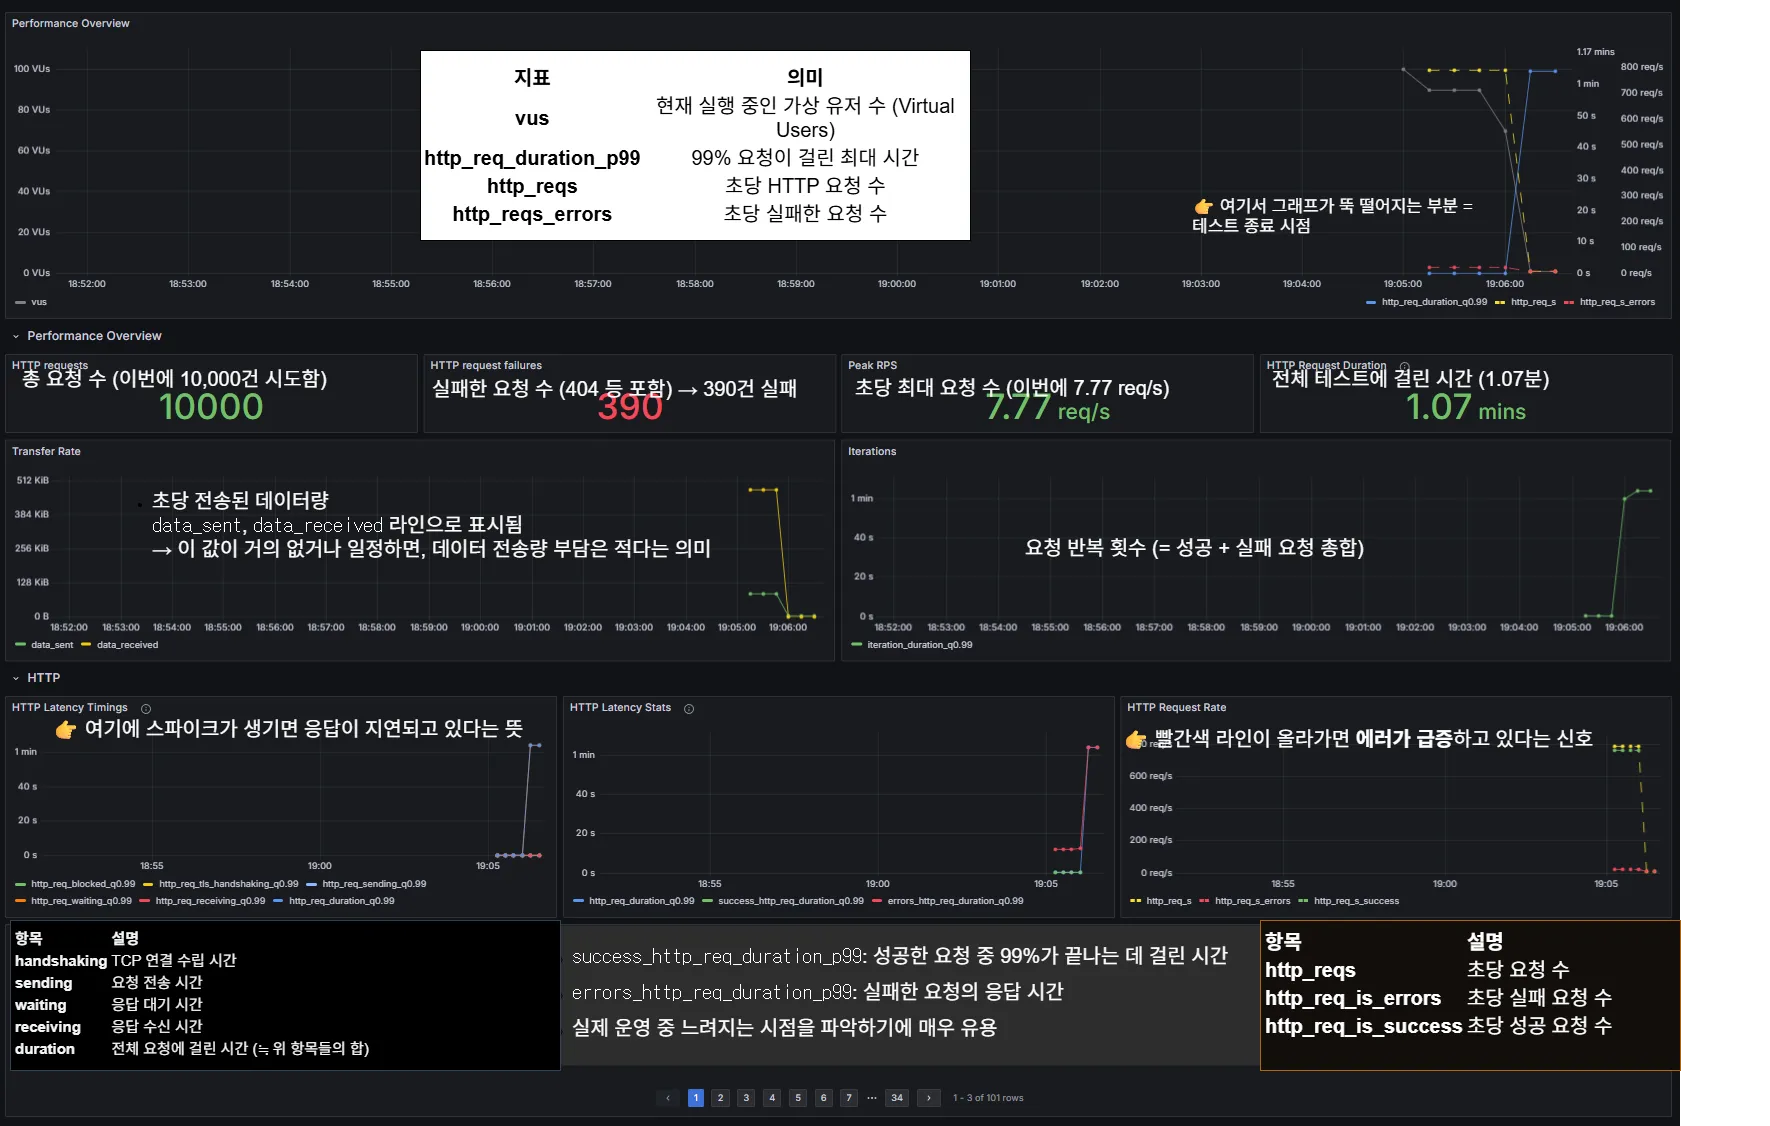
Grafana 설정 그대로
prometheus 물어오면됨
대시보드 번호 : 18030
대시보드 보는 방법

대충 데굴데굴 굴러가는 개발?자