[Nest JS] Winston으로 Azure에 로깅 구성하기
최근, Azure를 활용하여 서버를 배포할 일이 생기고 있어 매일 삽질을 반복하고 있습니다..ㅎㅎㅠ
본 포스팅에서는, Nest JS 서버에서 winston 라이브러리를 활용하여 Azure의 Application Insights 리소스에 로그를 보내는 삽질 과정을 기록하고자 합니다!
잘못된 내용에 대한 피드백은 언제나 감사드립니다! (__)
참고 자료
applicationinsights npm 문서
winston-azure-application-insights npm 문서
0. 패키지 설치하기
이하 과정에서 사용할 패키지를 먼저 설치해 줍니다!
P.S. winston-azure-application-insights 패키지 설명에 따르면, 이 패키지는 applicationinsights 1.0.6 버전과 가장 잘 맞는다고 합니다.
applicationinsights 는 1.0.6 버전을 맞춰 설치해주면 좋을 것 같습니다!
1. InstrumentationKey 가져오기
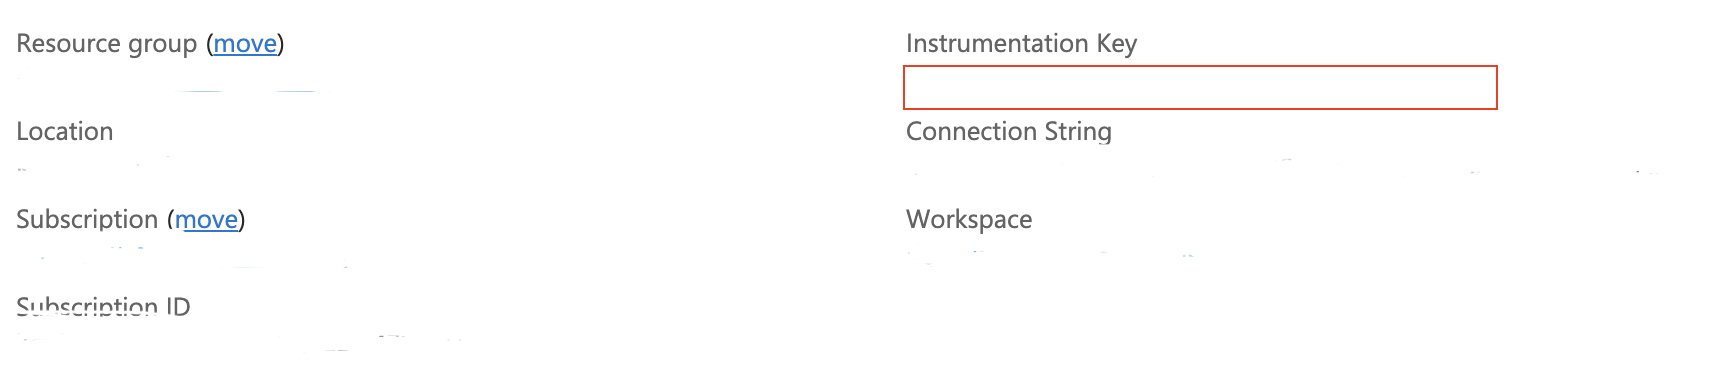
Azure의 Application Insights와 상호작용하기 위해, 해당 리소스의 Instrumentation Key가 필요합니다!
Azure의 Application Insights > 사용할 리소스 > Overview 에서 아래 부분의 Instrumentation Key를 가져와 줍니다!
2. LoggerModule 작성하기
저는 WinstonModule을 한 번 더 감싸서, DynamicModule의 형태로 작성하였습니다!
import { utilities, WINSTON_MODULE_PROVIDER, WinstonModule } from "nest-winston";
import * as winston from "winston";
/**
 @note es-lint 설정에 따라, require를 쓰는 부분에서 에러가 날 수 있으니 disable해 줍니다!
/* eslint-disable-next-line  */
const appInsights = require("applicationinsights");
/* eslint-disable-next-line  */
const { AzureApplicationInsightsLogger } = require("winston-azure-application-insights");

@Module({})
@Global()
export class LoggerModule {
	public static register():DynamicModule {
    	return {
        	module:LoggerModule,
        	imports: [
            	WinstonModule.forRootAsync({
                  useFactory: async (config:ConfigService) => {
                    // env에서 key를 가져와 줍니다.
                    const instrumentationKey = config.getOrThrow("AZURE_INSTRUMENTATION_KEY");

                    await appInsights.setup(instrumentationKey)
                      .setAutoCollectConsole(true, true) // console에 찍히는 값을 같이 수집합니다.
                      .start();

                    // 실행 환경에 따라 log level을 분리해 주셔도 좋을 듯합니다!
                    const logLevel = "info";

                    return {
                    	level: logLevel,
                    	format: winston.format.combine(
                          winston.format.timestamp(),
                          utilities.format.nestLike("myApp", {
                            colors:true,
                            prettyPrint:true,
                          }),
                        ),
                      // start한 appInsights의 defaultClient
                    	transports:[
                        	new AzureApplicationInsightsLogger({
                              client: appInsights.defaultClient,
                            })
                           ],
                      };
                    },
                   inject: [ConfigService],
             }),
          ],
        };
    }
}
3. LoggerModule register
/**
* @Global 처리한 LoggerModule을 주입!
*/
@Module({
  imports:[LoggerModule.register(),
          ...
          ...
     ]
})
export class AppModule {}
4. 로그 확인하기
아까와 동일하게,
Azure의 Application Insights > 사용할 리소스 진입 후
Monitoring 탭 > Logs로 가 줍니다!
맨 위에 파란색 tables에서..
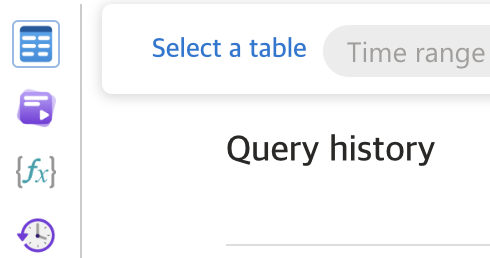
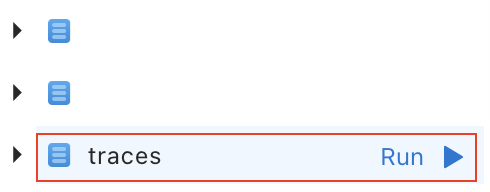
traces 테이블로 query를 run하면 로그를 확인할 수 있습니다!
P.S applicationinsights 디버깅
await appInsights.setup(instrumentationKey)
                  .setAutoCollectConsole(true, true)
				  // console에 찍히는 값을 같이 수집합니다.
                  .start();
2번 부분의 이 내용에서, setInternalLogging 옵션을 (true, true)로 켜주면, SDK의 내부 동작을 콘솔 창에서 확인할 수 있습니다!
await appInsights.setup(instrumentationKey)
                  .setAutoCollectConsole(true, true)
				  .setInternalLogging(true, true) // 추가!
                  .start();
혹시 세팅을 마치셨고, 일정 시간이 지났는데도 계속 로그가 확인되지 않는다면
SDK에서 Azure의 리소스로 보내는 요청이 에러가 나고 있는 것은 아닌지 확인해 보시면 좋을 것 같습니다! :)