
스트림릿 설치하기
- 파이썬 3.7 - 3.10 버전에서 설치 가능
- 파이썬 버전 확인하기
- 윈도우즈에서 Ananconda Prompt 실행하고
- 아래 명령어로 버전확인
python –V (대문자 V) 또는
python --version (‘-’ 두 개) - Streamlit 설치
Ananconda Prompt에서 pip install streamlit 명령어 입력
아래 명령어로 버전확인
streamlit --version (‘-’ 두 개)
Examples1
import streamlit as st
col1, col2, col3 = st.columns(3)
with col1:
st.header("A cat")
st.image("https://static.streamlit.io/examples/cat.jpg")
with col2:
st.header("A dog")
st.image("https://static.streamlit.io/examples/dog.jpg")
with col3:
st.header("An owl")
st.image("https://static.streamlit.io/examples/owl.jpg")
Examples2
import streamlit as st
import numpy as np
col1, col2 = st.columns([3, 1])
data = np.random.randn(10, 1)
col1.subheader("A wide column with a chart")
col1.line_chart(data)
col2.subheader("A narrow column with the data")
col2.write(data)
코드 출처 :https://docs.streamlit.io/library/api-reference/layout/st.columns
-> Example1, Examples2와 같이 코드를 구성해 스트림릿 페이지를 구성할 수 있었습니다!!
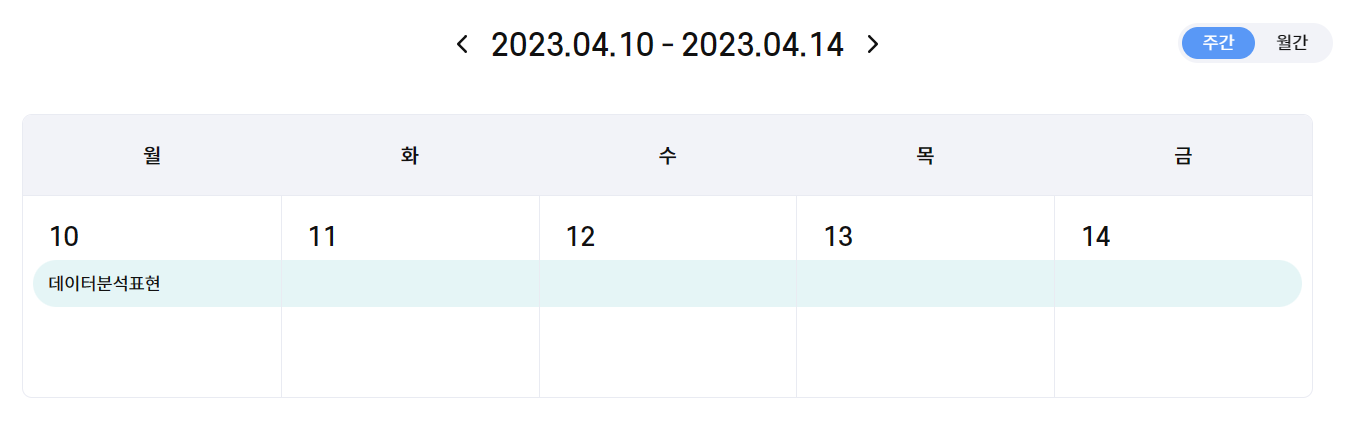
스트림릿을 활용한 시각화
실제 실습에서 사용한 코드를 올리지는 못해 아쉽지만
스트림 릿으로 시각화한 페이지 일부입니당:)
< 수업 후기 >
Power BI, 태블로는 시각화 툴로 평소에 들어봤지만 스트림릿이란 것을 활용해 데이터 분석 표현을 할 수 있다는 것을 처음 알게 되었고 스트림릿을 통해 프로토타입을 생성할 수 있어 재밌는 수업이였습니다 :)
또, 스트림릿을 활용해 미니프로젝트도 진행한다고 하니 기대가 되었습니다!!!