Custom Paint로 원형 차트 만들어 보기
이번 글에서는 커스텀 페인트로 연습 삼아 만들어 본 Pie Chart에 대한 부분을 작성하려고 한다.
저는 커스텀 페인트 사용 경험이 거의 없다. 몇 년전에 시계 화면 만들어 보고, 로그인 화면 만들 때에 백그라운드 UI 부분에 적용하려고 잠시 사용해 보기만 했다.
이번에 차트를 사용해야 하는데, 이것 저것 찾다가 궁금해서 직접 만들어 보게 되었다.
결론은 부채꼴 호의 터치 영역을 감지하지 못해 그냥 Syncfusion에서 배포한 라이브러리를 사용하기로 했다... 터치 영역만 해결하면 라이브러리 사용안해도 되는데..
Pie 차트를 직접 만들어 보고 싶으신 분은 참고 하시면 좋을 것 같다.
코드에 대한 설명은 따로 하지 않고, 코드만 공유하도록 하겠다.
Model
전체적인 차트에 사용되는 모델이다.
class PieModel {
  final int count;
  final Color color;

  PieModel({
    required this.count,
    required this.color,
  });
}
Pie Chart
class PainterPieChatScreen extends StatefulWidget {
const PainterPieChatScreen({super.key});
State<PainterPieChatScreen> createState() => _PainterPieChatScreenState();
}
class _PainterPieChatScreenState extends State<PainterPieChatScreen> {
Widget build(BuildContext context) {
List<PieModel> model = [
PieModel(count: 30, color: Colors.red.withOpacity(1)),
PieModel(count: 5, color: Colors.blue.withOpacity(1)),
PieModel(count: 3, color: Colors.grey.withOpacity(1)),
PieModel(count: 10, color: Colors.amber.withOpacity(1)),
PieModel(count: 2, color: Colors.green.withOpacity(1)),
PieModel(count: 30, color: Colors.cyan.withOpacity(1)),
PieModel(count: 20, color: Colors.purple.withOpacity(1)),
];
return Scaffold(
appBar: appBar(title: "Pie Chart"),
body: Column(
children: [
SizedBox(
width: MediaQuery.of(context).size.width,
height: MediaQuery.of(context).size.width,
child: CustomPaint(
size: Size(MediaQuery.of(context).size.width,
MediaQuery.of(context).size.width),
painter: _PieChart(model),
),
),
],
),
);
}
}
class _PieChart extends CustomPainter {
final List<PieModel> data;
_PieChart(this.data);
void paint(Canvas canvas, Size size) {
Paint circlePaint = Paint()..color = Colors.white;
Offset offset = Offset(size.width / 2, size.width / 2);
double radius = (size.width / 2) * 0.8;
canvas.drawCircle(offset, radius, circlePaint);
double _startPoint = 0.0;
for (int i = 0; i < data.length; i++) {
double _startAngle = 2 * math.pi * (data[i].count / 100);
double _nextAngle = 2 * math.pi * (data[i].count / 100);
circlePaint.color = data[i].color;
canvas.drawArc(
Rect.fromCircle(
center: Offset(size.width / 2, size.width / 2), radius: radius),
-math.pi / 2 + _startPoint,
_nextAngle,
true,
circlePaint);
_startPoint = _startPoint + _startAngle;
}
}
bool shouldRepaint(covariant CustomPainter oldDelegate) => false;
}
Result
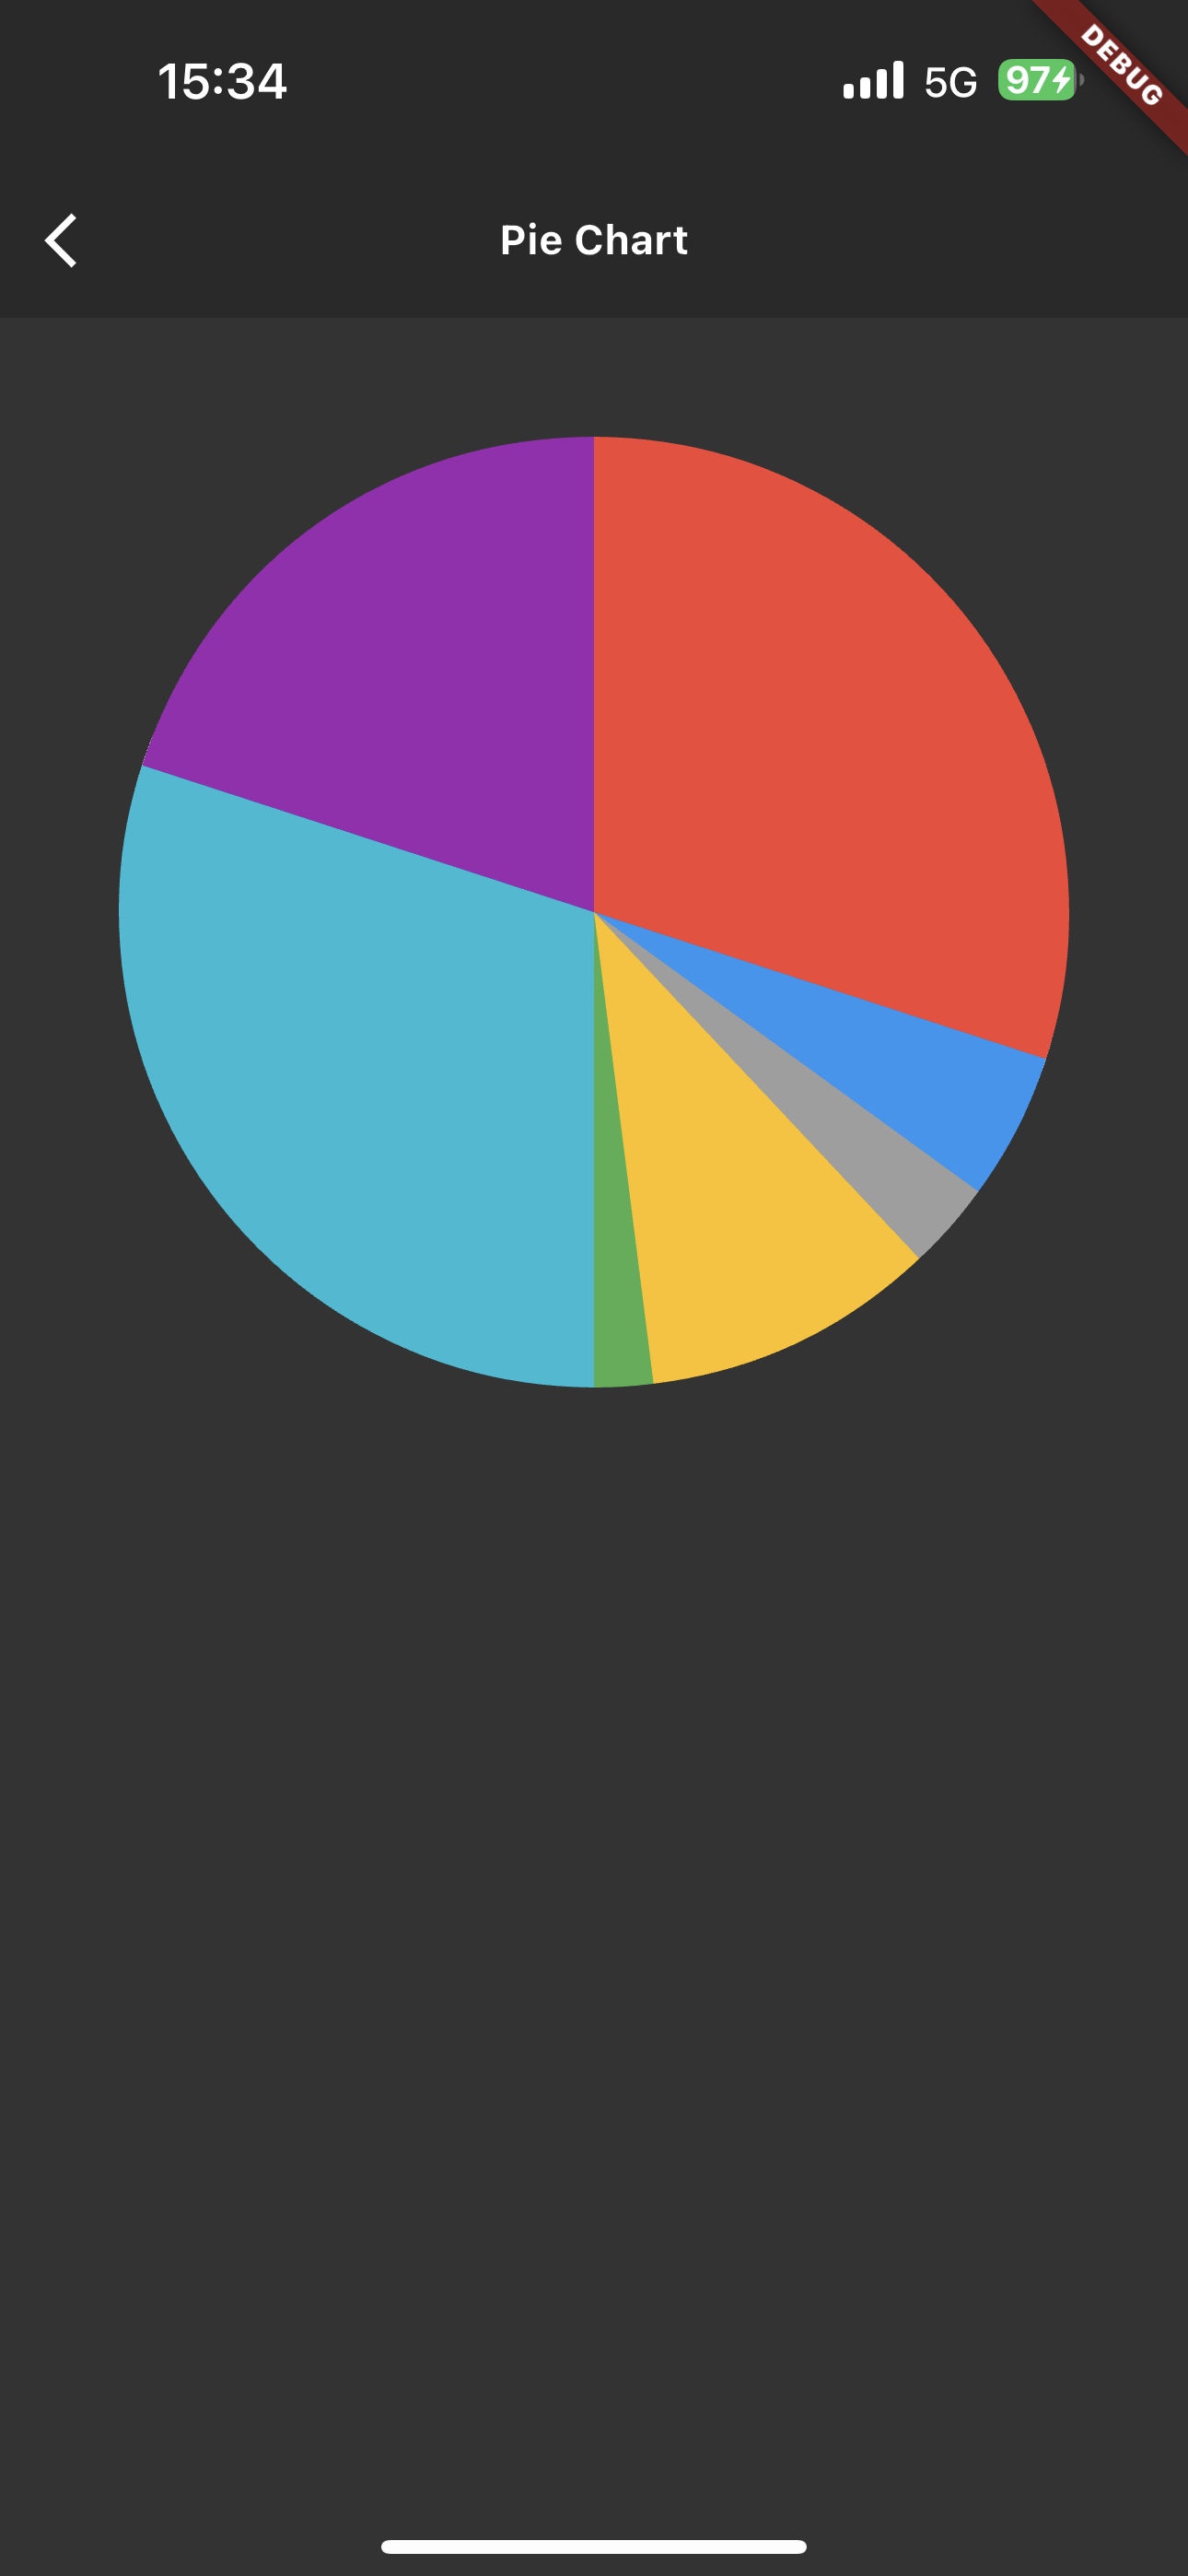 |
Pie Chart with Animation
class PainterAnimationPieChartScreen extends StatefulWidget {
const PainterAnimationPieChartScreen({super.key});
State<PainterAnimationPieChartScreen> createState() =>
_PainterAnimationPieChartScreenState();
}
class _PainterAnimationPieChartScreenState
extends State<PainterAnimationPieChartScreen>
with TickerProviderStateMixin {
late AnimationController animationController;
List<PieModel> model = [
PieModel(count: 12, color: Colors.red.withOpacity(1)),
PieModel(count: 18, color: Colors.blue.withOpacity(1)),
PieModel(count: 23, color: Colors.grey.withOpacity(1)),
PieModel(count: 31, color: Colors.amber.withOpacity(1)),
PieModel(count: 6, color: Colors.green.withOpacity(1)),
PieModel(count: 4, color: Colors.cyan.withOpacity(1)),
PieModel(count: 6, color: Colors.purple.withOpacity(1)),
];
void initState() {
super.initState();
animationController = AnimationController(
vsync: this,
duration: const Duration(seconds: 1),
);
animationController.forward();
}
void dispose() {
animationController.dispose();
super.dispose();
}
Widget build(BuildContext context) {
return Scaffold(
appBar: appBar(title: "Animation Pie Chart"),
body: Column(
children: [
AnimatedBuilder(
animation: animationController,
builder: (context, child) {
if (animationController.value < 0.1) {
return const SizedBox();
}
return CustomPaint(
size: Size(MediaQuery.of(context).size.width,
MediaQuery.of(context).size.width),
painter: _PieChart(model, animationController.value),
);
},
),
],
),
);
}
}
class _PieChart extends CustomPainter {
final List<PieModel> data;
final double value;
_PieChart(this.data, this.value);
void paint(Canvas canvas, Size size) {
Paint circlePaint = Paint()..color = Colors.white;
double radius = (size.width / 2) * 0.8;
double _startPoint = 0.0;
for (int i = 0; i < data.length; i++) {
double _count = data[i].count.toDouble();
_count = (_count * value + _count) - data[i].count;
double _startAngle = 2 * math.pi * (_count / 100);
double _nextAngle = 2 * math.pi * (_count / 100);
circlePaint.color = data[i].color;
canvas.drawArc(
Rect.fromCircle(
center: Offset(size.width / 2, size.width / 2), radius: radius),
-math.pi / 2 + _startPoint,
_nextAngle,
true,
circlePaint);
_startPoint = _startPoint + _startAngle;
}
}
bool shouldRepaint(covariant CustomPainter oldDelegate) => true;
}Result
 |
Doughnut Chart
class PainterDoughnutChartScreen extends StatefulWidget {
const PainterDoughnutChartScreen({super.key});
State<PainterDoughnutChartScreen> createState() =>
_PainterDoughnutChartScreenState();
}
class _PainterDoughnutChartScreenState extends State<PainterDoughnutChartScreen>
with TickerProviderStateMixin {
late AnimationController animationController;
List<PieModel> data = [
PieModel(count: 30, color: Colors.amber),
PieModel(count: 20, color: Colors.red),
PieModel(count: 10, color: Colors.blue),
PieModel(count: 20, color: Colors.green),
PieModel(count: 20, color: Colors.purple),
];
void initState() {
super.initState();
animationController = AnimationController(
vsync: this,
duration: const Duration(seconds: 1),
);
animationController.forward();
}
void dispose() {
animationController.dispose();
super.dispose();
}
Widget build(BuildContext context) {
return Scaffold(
appBar: appBar(title: "Doughnut Chart"),
body: Column(
children: [
AnimatedBuilder(
animation: animationController,
builder: (context, child) {
if (animationController.value < 0.1) {
return const SizedBox();
}
return SizedBox(
child: CustomPaint(
size: Size(MediaQuery.of(context).size.width,
MediaQuery.of(context).size.width),
painter: _DoughnutChart(data, animationController.value),
),
);
},
),
],
),
);
}
}
class _DoughnutChart extends CustomPainter {
final List<PieModel> data;
final double value;
_DoughnutChart(this.data, this.value);
void paint(Canvas canvas, Size size) {
Paint paint = Paint()..color = const Color.fromRGBO(61, 61, 61, 1);
Offset offset = Offset(size.width / 2, size.width / 2);
double radius = (size.width / 2) * 0.8;
canvas.drawCircle(offset, radius, paint);
paint.strokeWidth = 50;
paint.style = PaintingStyle.stroke;
paint.strokeCap = StrokeCap.round;
double _startPoint = 0.0;
for (int i = 0; i < data.length; i++) {
double _count = data[i].count.toDouble();
_count = (_count * value + _count) - data[i].count;
radius = ((size.width / 2) * 0.8) - 25;
double _nextAngle = 2 * math.pi * (_count / 100);
paint.color = data[i].color;
canvas.drawArc(
Rect.fromCircle(center: offset, radius: radius),
-math.pi / 2 + _startPoint,
_nextAngle,
false,
paint,
);
_startPoint = _startPoint + _nextAngle;
}
}
bool shouldRepaint(covariant CustomPainter oldDelegate) => true;
}Result
 |
Radial Chart
class PainterRadialChartScreen extends StatefulWidget {
const PainterRadialChartScreen({super.key});
State<PainterRadialChartScreen> createState() =>
_PainterRadialChartScreenState();
}
class _PainterRadialChartScreenState extends State<PainterRadialChartScreen>
with TickerProviderStateMixin {
late AnimationController animationController;
List<PieModel> data = [
PieModel(count: 30, color: Colors.amber),
PieModel(count: 20, color: Colors.red),
PieModel(count: 10, color: Colors.blue),
PieModel(count: 20, color: Colors.green),
PieModel(count: 20, color: Colors.purple),
];
void initState() {
super.initState();
animationController = AnimationController(
vsync: this,
duration: const Duration(seconds: 3),
);
animationController.forward();
}
void dispose() {
animationController.dispose();
super.dispose();
}
Widget build(BuildContext context) {
return Scaffold(
appBar: appBar(title: "Radial Chart"),
body: Column(
children: [
AnimatedBuilder(
animation: animationController,
builder: (context, child) {
if (animationController.value < 0.1) {
return const SizedBox();
} else {
return SizedBox(
child: CustomPaint(
size: Size(MediaQuery.of(context).size.width,
MediaQuery.of(context).size.width),
painter: _RadialChart(data, animationController.value),
),
);
}
},
),
],
),
);
}
}
class _RadialChart extends CustomPainter {
final List<PieModel> data;
final double value;
_RadialChart(this.data, this.value);
void paint(Canvas canvas, Size size) {
Paint paint = Paint()..color = const Color.fromRGBO(61, 61, 61, 1);
Offset offset = Offset(size.width / 2, size.width / 2);
double radius = (size.width / 2) * 0.8;
canvas.drawCircle(offset, radius, paint);
paint.strokeWidth = 10;
paint.style = PaintingStyle.stroke;
paint.strokeCap = StrokeCap.round;
for (int i = 0; i < data.length; i++) {
double _count = data[i].count.toDouble();
_count = (_count * value + _count) - data[i].count;
double position = double.parse("0.${8 - i}");
radius = ((size.width / 2) * position) - 5;
double _nextAngle = 2 * math.pi * (_count / 100);
paint.color = data[i].color;
canvas.drawArc(
Rect.fromCircle(center: offset, radius: radius),
-math.pi / 2,
_nextAngle,
false,
paint,
);
}
}
bool shouldRepaint(covariant CustomPainter oldDelegate) => true;
}Result
 |
마무리
이번에는 간단하게 다양한 원형 차트를 그려봤는데, 다음 번에는 좀 더 디테일하게 개발해서 공유하도록 하겠습니다.

Flutter Developer

차트를 직접 만드는 것이 이렇게 다양한 방법으로 가능하다니 신기하네요. 코드도 잘 정리되어 있어서 참고하기 좋아요. 잘 읽었습니다!