Graph Mininng
Fundamentals + Random Graph + Motif
Our further goals are focused on :
1. Bigdata Processing
⭐️ 2. Graph Mining
Why GRAPH?
Most data is structured from Network
Network - A Complex System Consisting of Interacting Entities
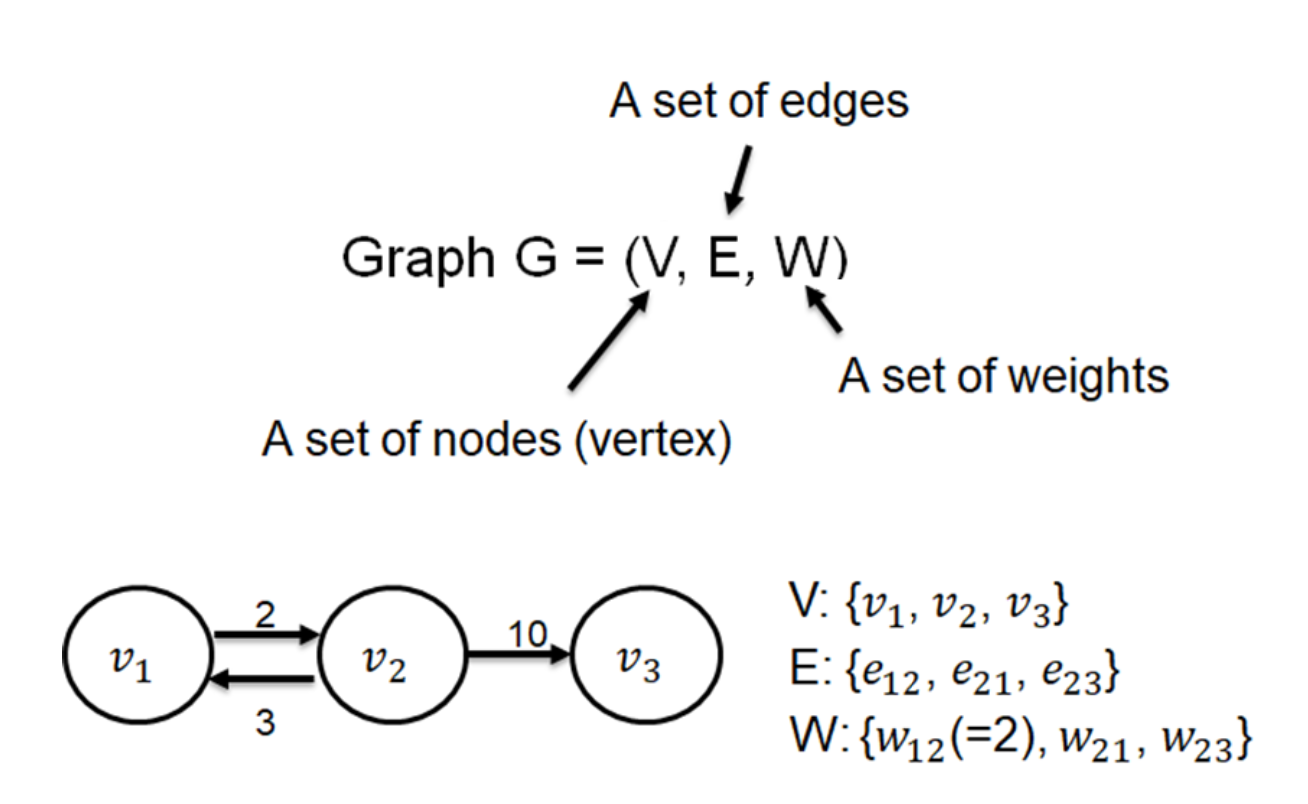
Nodes : v1, v2, v3
e12 : Edge of 1 to 2
Embedding - 수치에 대해 직접적인 관계는 없지만 다른 상호작용을 보고 연관성을 유추할 수 있다.
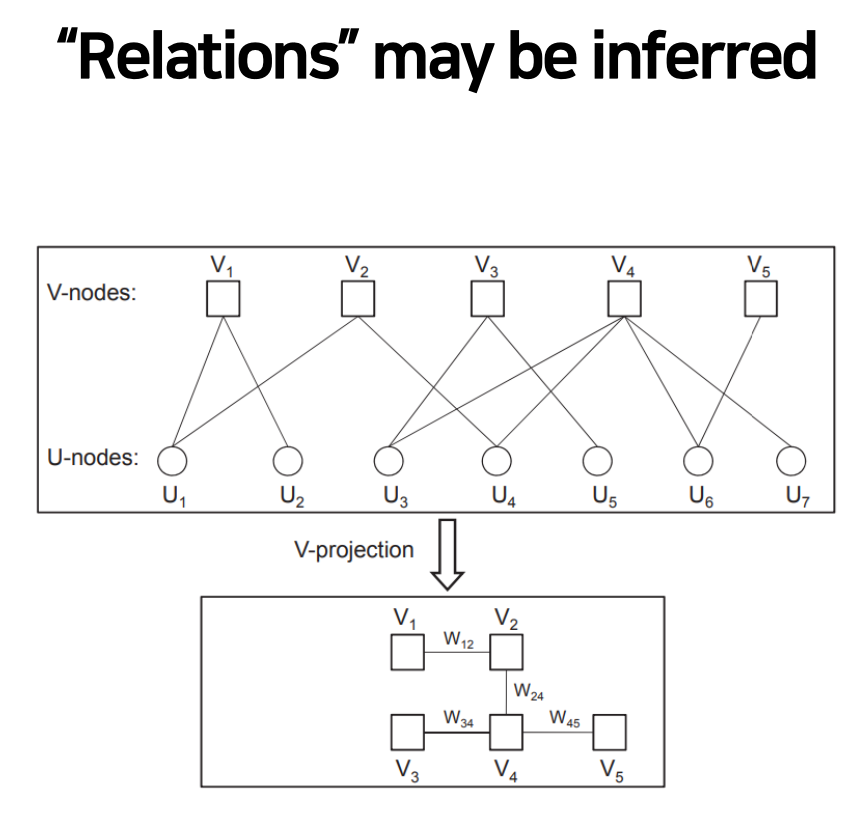
직접적인 v, u 노드 간의 연결은 없지만
ex) U1에 V1,V2가 연결되어 있는 것을 보고 관계를 유추할 수 있다.
Relation - 유사성을 보고 관계를 유추하고 W를 측정할 수 있다.
Why Networks (Graph)? And Why now?
- Universal language for describing complex data
- Networks from science, nature, and technology are more similar than one would expect
- Shared vocabulary between fields
- COmputaer Science, Social Science, Physics, Economics, Statistics, Biology
- Data availability & computational challenges
- Web/mobile, bio, health, and medical
- Impact!
- Social networking, Drug design, AI reasoning
- 복합형 인재,
Revisit : Graph Definition
Graph Types
- Undirected Graph
-
Directed Graph
- 방향성이 있으면 교환법칙 성립 X
-
Unweighted Graph
- 가중치가 있는 그래프
Degrees
In degree - 나에게 들어오는 노드의 개수
Out degree - 나에게서 나가는 노드의 개수
- In undirected graph
Repersenting a Graph : Adjeacent Matrix
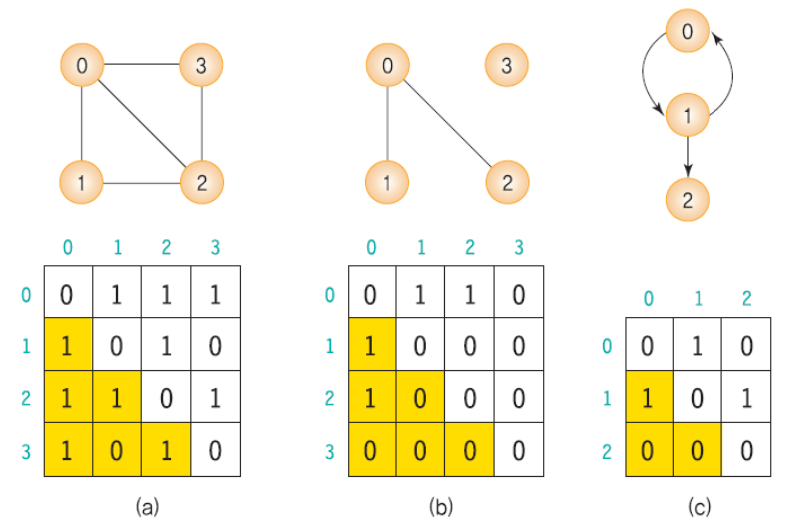
0이 많으면 메모리 공간 차지가 큼 이걸 줄이고 싶어함.
Tree
- A type
- All nodes are connected
- No cycles
Tools for Graph Modeling & Analysis
Graph analysis
Network visualization tools
- 시각화를 해봐라, 인사이트를 얻을 수 있다.
Network Properties : A first measure for graph
- Degree distribution
- Path length(Distance 거리)
- Clustering coefficient(나를 중심으로 얼마나 뭉처져 있는가)
- Connected components(연결성, 연결되어 있는/안되어 있는지)
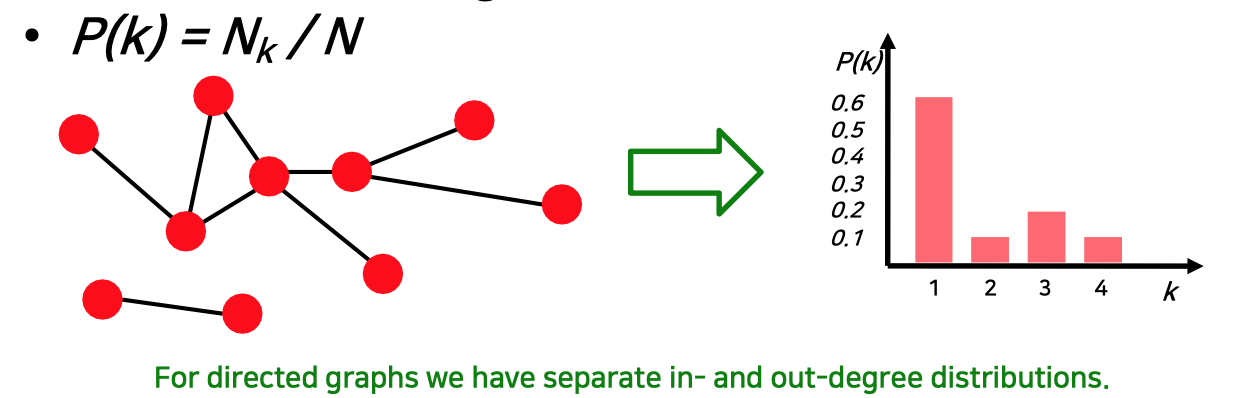
Degree Distribution
- Nomalized histogram :
Paths in a Graph
- 시작과 끝에 연결되어 있는 시퀀스
Shortest Path
- hop이 최소로 되는 최단 경로
Diameter & APL
APL - path length의 평균 (Average Path Length)
Clustering Coefficient
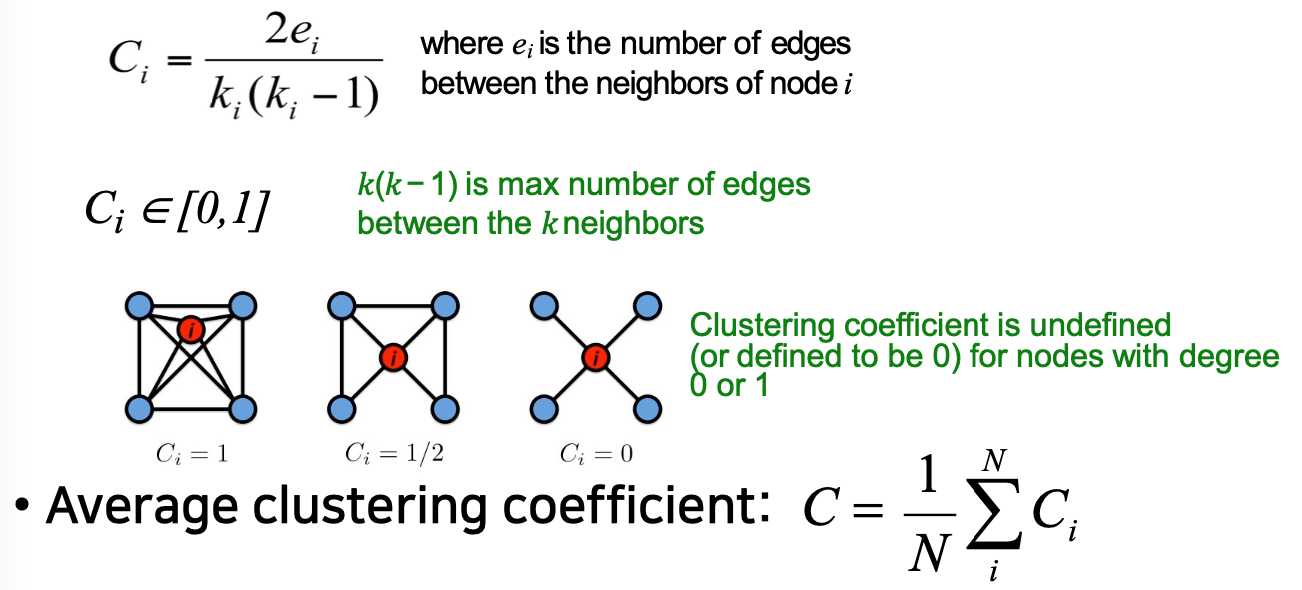
_n_C2로 나누는 것
Connectivity
Generating Random Graph (Erdos-Renyi)
똑같은 갯수의 노드와 엣지를 가지고 랜덤 그래프를 그려야 한다.
Simple Algorithm to Generate a Random Graph
Gnp : 노드와 확률을 주어짐
Gnm : 노드와 엣지의 개수가 주어짐
Random Graph Model
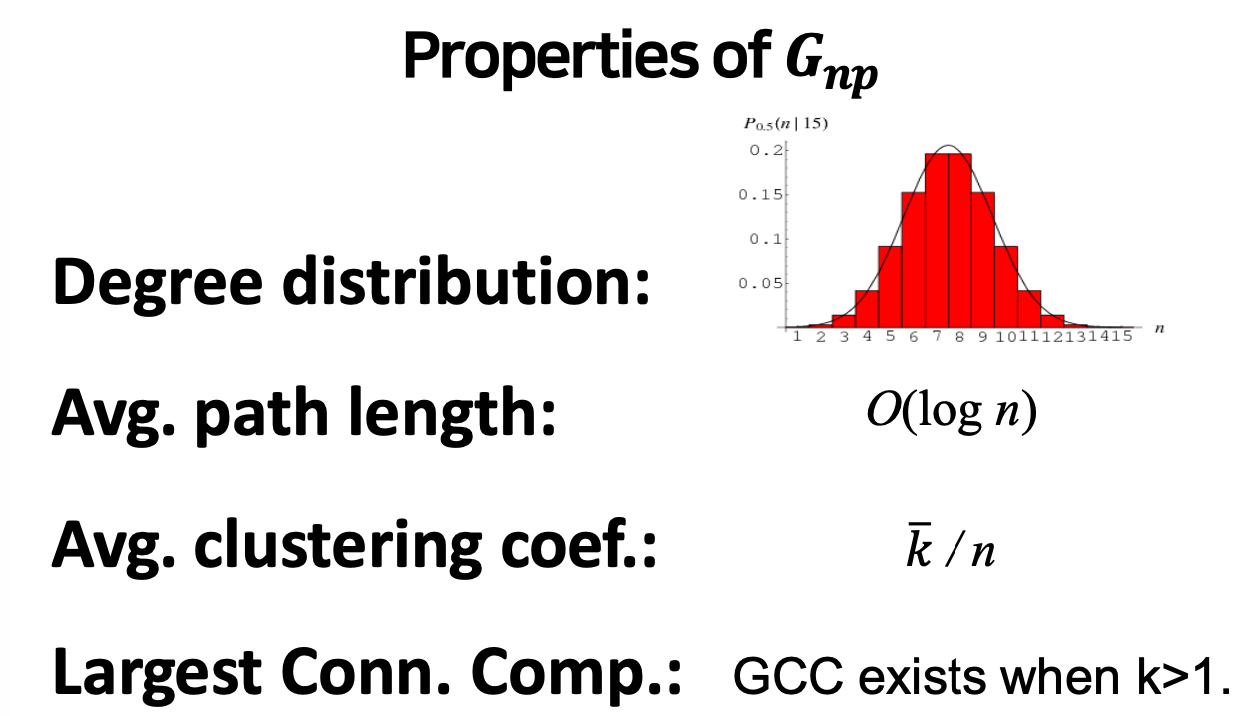
- Degree distribution 동일하게 뽑기 때문에 정규분포의 형태를 띈다.
Ramdom Graph Gnp Does NOT Reflect Real_World
- Degree distribution 모양이 다르다
- Avg.Clustering coef. 가 너무 낮다
THe Problem Comes from "Edge Locality"
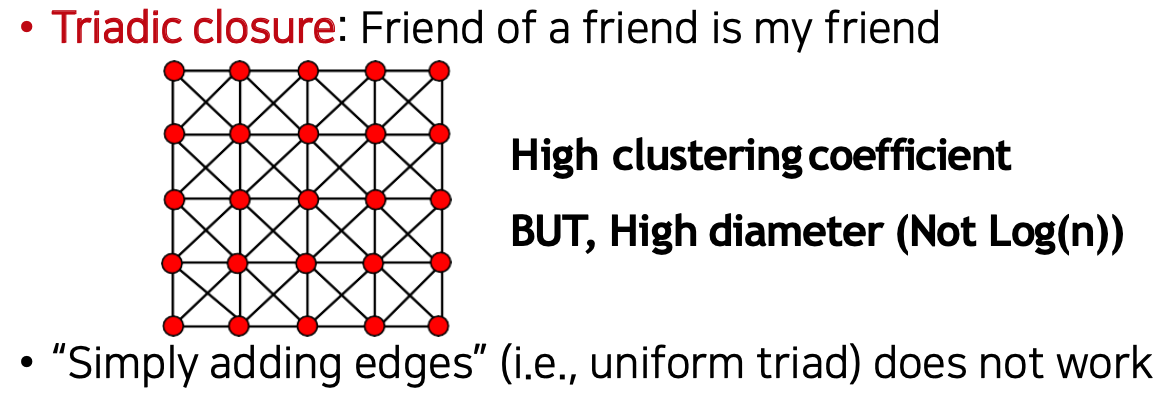
엣지가 존재하는 주변에 연결된 엣지가 존재할 확률이 높다.
diameter - (distance가 가장 높은 것) 또한 높다.

남을 위해(나를 위해) 글을 쓰는 Velog