Nvidia Triton Inference Server을 통해 사용할 수 있는 여러 기능을 정리한 글입니다.
전처리/모델/후처리 파이프라인을 제공하는 ENSEMBLE 기능
파이프라인 연결 방법
- ensemble config.pbtxt에서
ensemble_scheduling > step에 각 부분을 연결하는 파이프라인 정의. 각 모델의 input_map / output_map의 key-value 값 설정으로 정의 할 수 있음key는 각 모델의 input/output 이름으로 설정value는 해당 ensemble 모델 config.pbtxt 에서 작성한 input / output 이름으로 설정- 다른 모델의 output이나 input 이름이 겹쳐도 됨. 대신
model_name을 설정해주어야 함
- 예시
# config.pbtxt

name: "ensemble_python_resnet50"
platform: "ensemble"
max_batch_size: 256
input [
  {
    name: "INPUT"
    data_type: TYPE_UINT8
    dims: [ -1 ]
  }
]
output [
  {
    name: "OUTPUT"
    data_type: TYPE_FP32
    dims: [ 1000 ]
  }
]
ensemble_scheduling {
  step [
    {
      model_name: "preprocess"
      model_version: -1
      input_map {
        key: "INPUT_0"
        value: "INPUT"
      }
      output_map {
        key: "OUTPUT_0"
        value: "preprocessed_image"
      }
    },
    {
      model_name: "resnet50_trt"
      model_version: -1
      input_map {
        key: "input"
        value: "preprocessed_image"
      }
      output_map {
        key: "output"
        value: "OUTPUT"
      }
    }
  ]
}
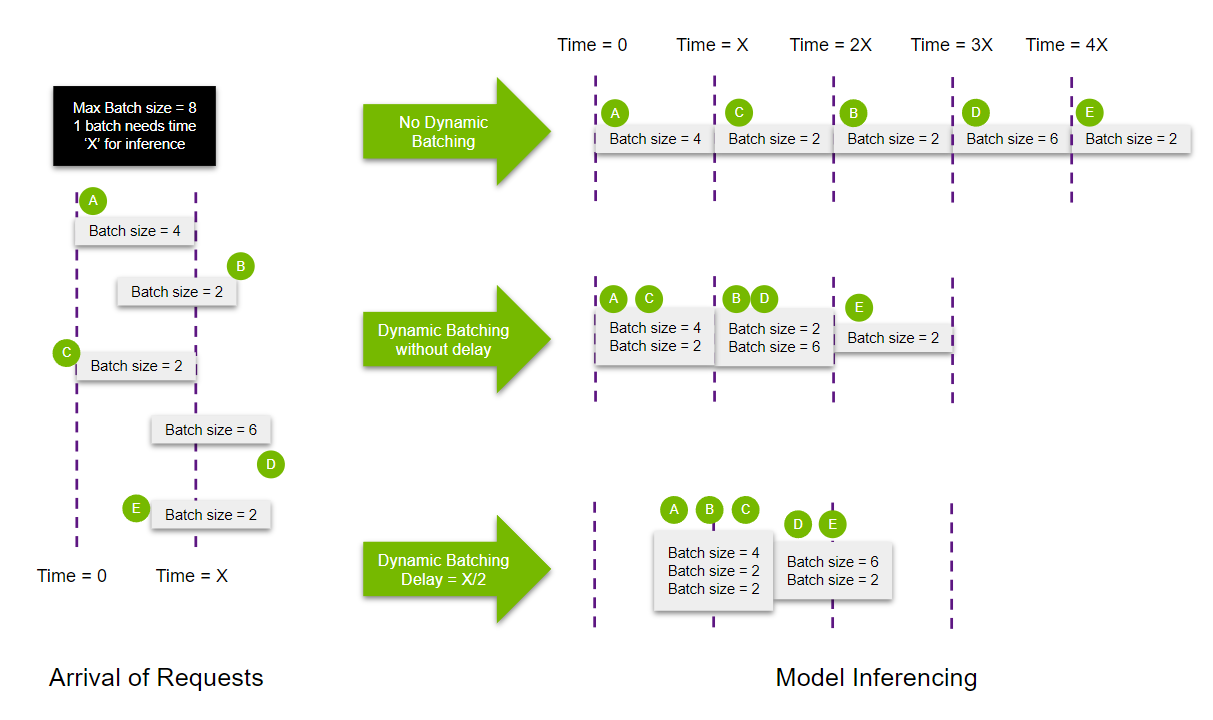
여러 요청을 한번에 추론할 수 있는 Dynamic Batching
개념

- 서버에서 받은 요청을 합쳐서, 배치를 만듦 → throughput 향상
- stateless models인 경우에만 사용되어야 함
- 각 모델별로 ModelDynamicBatching property를 사용하여 설정 가능함
- batch preferred size(s), delay maximum time, queue properties(such a queue size), priorities, and time-outs 등 설정 가능
- 앙상블을 구성하는 모델에서도 dynamic batching 가능. (참고로 앙상블은 모델을 연결하는 역할을 하기에 (실제로 추론을 실행하는 모델과 달리), queueing 되는 시간이 다른 모델에 비해 굉장히 짧음)
the models composing the ensemble may also have dynamic batching enabled. Since ensemble models are just routing the data between composing models, Triton can take requests into an ensemble model without modifying the ensemble's configuration to exploit the dynamic batching of the composing models. (참고자료)
- 함께 보면 좋을 자료
방법
- 해당 모델의 config.pbtxt에서 정의
- 예시
dynamic_batching {
  preferred_batch_size: [ 4 ]
  max_queue_delay_microseconds: 3000000  # microseconds임을 유의
}
여러개의 모델 인퍼런스를 띄울 수 있는 Concurrent Model Execution
개념
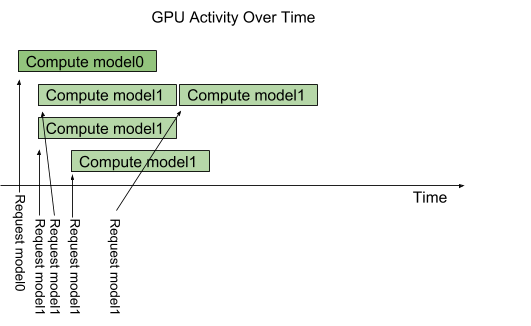
- 한 모델에 여러 요청이 들어오면, 일반적으로 하나를 처리하고 다음 하나를 처리할 수 있음
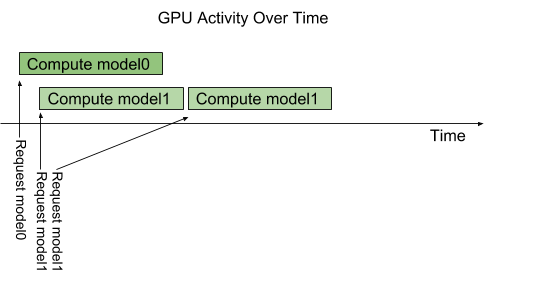
- 하지만 model configuration option called instance-group을 이용하면 같은 모델을 여러 개 띄울 수 있고, 이를 통해 병렬적으로 여러 요청을 처리할 수 있음. 아래 그림처럼, 모델1의 instance가 3개이고 모델1의 요청이 4개가 들어왔다면 동시에 처리할 수 있는 요청은 3개이고, 하나의 요청이 끝나면 4번째 요청도 처리될 수 있음
방법
- 해당 모델의 config.pbtxt 에서 정의
- 예시
# 예시1
instance_group [
  {
    count: 2
    kind: KIND_GPU
  }
]

# 예시2
instance_group [
	{
	  count: 1
	  kind: KIND_GPU
	  gpus: [ 0 ]
	},
	{
	  count: 2
	  kind: KIND_GPU
	  gpus: [ 1, 2 ]
	}
]
모델의 첫 인퍼런스 요청 시간 지연을 막는 Model Warmup
개념
어떤 모델은 첫번째 추론 요청(또는 처음 몇개의 추론요청)을 받을때 초기화를 마저 완료하기도 한다. 이런 경우 첫번째 추론 요청을 처리할때 상당히 응답 시간이 길다.
→ 이런 문제를 해결하기 위해 model이 “warmed up” 할 수 있도록 기능을 지원. 모델을 로드한 후, 자동으로 임의의 요청을 실행하여 모델 초기화가 완전히 완료되도록 한다. 이를 통해 실사용자가 첫 요청을 날리기 전에 모델 초기화를 완전히 끝내도록 하는 것이다.
ModelWarmup 설정을 통해, 각 모델 인스턴스를 warm-up할 inference requests을 정의 할 수 있다. 이 inference requests이 완전히 완료되면, model 인스턴스가 serving이 가능한 상태가 된다.
방법
- 해당 모델의 config.pbtxt 에서 정의
- 예시
model_warmup [
{
  name : "sample text"
  batch_size: 1
  inputs {
    key: "query"
    value: {
        data_type: TYPE_STRING
        dims: [1]
        zero_data: true  # 문자열(TYPE_STRING) zero_data로 설정하면 빈문자열('') 쿼리를 날림
    }
  }
}]
모델의 추론 성능(latency와 throughtput)을 측정할 수 있게 하는 Performance Analyzer
개념
- 정해진 time window 동안 요청을 날려서, latency와 throughput 측정
--pefcentile를 통해, 설정한 confidence level만큼의 결과를 도출할 수도 있음- For example, if –percentile=95 is used the results will be stabilized using the 95-th percentile request latency.
--pefcentitle을 95로 설정한 경우 결과 예시*** Measurement Settings *** Batch size: 1 Using "time_windows" mode for stabilization Measurement window: 5000 msec Using synchronous calls for inference Stabilizing using p95 latency Request concurrency: 1 Client: Request count: 26376 Throughput: 5275.2 infer/sec p50 latency: 108 usec p90 latency: 421 usec p95 latency: 465 usec p99 latency: 500 usec Avg HTTP time: 180 usec (send/recv 17 usec + response wait 163 usec) Server: Inference count: 32842 Execution count: 32842 Successful request count: 32842 Avg request latency: 90 usec (overhead 11 usec + queue 6 usec + compute input 6 usec + compute infer 63 usec + compute output 4 usec) Inferences/Second vs. Client p95 Batch Latency Concurrency: 1, throughput: 5275.2 infer/sec, latency 465 usec--percentile을 설정하지 않은 경우 결과 예시*** Measurement Settings *** Batch size: 1 Using "time_windows" mode for stabilization Measurement window: 5000 msec Using synchronous calls for inference Stabilizing using average latency Request concurrency: 1 Client: Request count: 19739 Throughput: 3947.8 infer/sec Avg latency: 252 usec (standard deviation 155 usec) p50 latency: 199 usec p90 latency: 467 usec p95 latency: 491 usec p99 latency: 518 usec Avg HTTP time: 253 usec (send/recv 24 usec + response wait 229 usec) Server: Inference count: 23346 Execution count: 23346 Successful request count: 23346 Avg request latency: 130 usec (overhead 14 usec + queue 9 usec + compute input 9 usec + compute infer 92 usec + compute output 6 usec) Failed to obtain stable measurement within 10 measurement windows for concurrency 1. Please try to increase the --measurement-interval. Inferences/Second vs. Client Average Batch Latency Concurrency: 1, throughput: 3947.8 infer/sec, latency 252 usec
- 예를 들어
p 90latency 결과가 404라면, 요청의 90%가 404 sec 안에 응답이 반환된다는 의미 - for dev용 API
방법
# 랜덤 input 데이터 넣음
perf_analyzer -m <model name> -u <url> --concurrency-range 2  --shape QUERY:1 --measurement-interval=10
000 --measurement-mode=time_windows
결과 output
- 참고로, GRPC 보다는 HTTP 결과가 좀 더 정확하다고 함
- sever latency는 요청을 받는 순간부터 응답을 할때까지로 측정. 크게 아래 2가지 요소로 측정
- queue : The average time spent in the inference schedule queue by a request waiting for an instance of the model to become available. →
server queue - compute: The average time spent performing the actual inference, including any time needed to copy data to/from the GPU. →
server compute input/infer/output
- queue : The average time spent in the inference schedule queue by a request waiting for an instance of the model to become available. →
- client latency는 HTTP and GRPC에 따라 구별됨
- HTTP : send/recv indicates the time on the client spent sending the request and receiving the response. response wait indicates time waiting for the response from the server. →
client send/rev - GRPC : (un)marshal request/response indicates the time spent marshalling the request data into the GRPC protobuf and unmarshalling the response data from the GRPC protobuf. response wait indicates time writing the GRPC request to the network, waiting for the response, and reading the GRPC response from the network. →
client request/response
- HTTP : send/recv indicates the time on the client spent sending the request and receiving the response. response wait indicates time waiting for the response from the server. →
- 이때, execution count = infer count / batch size (참고문서)
그 외 옵션
Request Concurrency
개념
By default perf_analyzer measures your model’s latency and throughput using the lowest possible load on the model. To do this perf_analyzer sends one inference request to Triton and waits for the response. When that response is received, the perf_analyzer immediately sends another request, and then repeats this process during the measurement windows. The number of outstanding inference requests is referred to as the request concurrency, and so by default perf_analyzer uses a request concurrency of 1. (본문)
방법
--concurrency-range옵션으로 설정할 수 있음
Visualizing Latency vs. Throughput
-f를 이용해서 csv output 파일 생성한 후, this spreadsheet에 데이터를 넣으면 Visualizing 됨- 자세한 방법은 링크 참조
Real Input Data
- input data이 파일에 담긴 경우, 아래와 같이
--input-data옵션에 해당 파일명을 넣으면 파일 내 데이터를 이용해 평가 가능# --input-data 파라미터 사용 perf_analyzer -m <model name> -u localhost:8000 --concurrency-range 4 --input-data realinputdata.json- 이때 파일은 json 파일이어야 한다.
gpu와 요청 지표를 확인 할 수 있는 Metrics
트리톤은 gpu와 요청 지표를 확인 할 수 있는 Prometheus metrics를 제공
- metrics 조회 (
curl localhost:8002/metrics) 결과 예시# HELP nv_inference_request_success Number of successful inference requests, all batch sizes # TYPE nv_inference_request_success counter nv_inference_request_success{model="ensemble",version="1"} 981.000000 nv_inference_request_success{model="opt",version="1"} 981.000000 nv_inference_request_success{model="preprocess",version="1"} 1000.000000 # HELP nv_inference_request_failure Number of failed inference requests, all batch sizes # TYPE nv_inference_request_failure counter nv_inference_request_failure{model="ensemble",version="1"} 0.000000 nv_inference_request_failure{model="opt",version="1"} 0.000000 nv_inference_request_failure{model="preprocess",version="1"} 0.000000 # HELP nv_inference_count Number of inferences performed (does not include cached requests) # TYPE nv_inference_count counter nv_inference_count{model="ensemble",version="1"} 981.000000 nv_inference_count{model="opt",version="1"} 981.000000 nv_inference_count{model="preprocess",version="1"} 1000.000000 # HELP nv_inference_exec_count Number of model executions performed (does not include cached requests) # TYPE nv_inference_exec_count counter nv_inference_exec_count{model="ensemble",version="1"} 981.000000 nv_inference_exec_count{model="opt",version="1"} 325.000000 nv_inference_exec_count{model="preprocess",version="1"} 314.000000 # HELP nv_inference_request_duration_us Cumulative inference request duration in microseconds (includes cached requests) # TYPE nv_inference_request_duration_us counter nv_inference_request_duration_us{model="ensemble",version="1"} 1709628307.000000 nv_inference_request_duration_us{model="opt",version="1"} 975163426.000000 nv_inference_request_duration_us{model="preprocess",version="1"} 788530845.000000 # HELP nv_inference_queue_duration_us Cumulative inference queuing duration in microseconds (includes cached requests) # TYPE nv_inference_queue_duration_us counter nv_inference_queue_duration_us{model="ensemble",version="1"} 50.000000 nv_inference_queue_duration_us{model="opt",version="1"} 492059181.000000 nv_inference_queue_duration_us{model="preprocess",version="1"} 578120857.000000 # HELP nv_inference_compute_input_duration_us Cumulative compute input duration in microseconds (does not include cached requests) # TYPE nv_inference_compute_input_duration_us counter nv_inference_compute_input_duration_us{model="ensemble",version="1"} 40594.000000 nv_inference_compute_input_duration_us{model="opt",version="1"} 25458.000000 nv_inference_compute_input_duration_us{model="preprocess",version="1"} 15287.000000 # HELP nv_inference_compute_infer_duration_us Cumulative compute inference duration in microseconds (does not include cached requests) # TYPE nv_inference_compute_infer_duration_us counter nv_inference_compute_infer_duration_us{model="ensemble",version="1"} 693276368.000000 nv_inference_compute_infer_duration_us{model="opt",version="1"} 483013914.000000 nv_inference_compute_infer_duration_us{model="preprocess",version="1"} 210313689.000000 # HELP nv_inference_compute_output_duration_us Cumulative inference compute output duration in microseconds (does not include cached requests) # TYPE nv_inference_compute_output_duration_us counter nv_inference_compute_output_duration_us{model="ensemble",version="1"} 138354.000000 nv_inference_compute_output_duration_us{model="opt",version="1"} 61916.000000 nv_inference_compute_output_duration_us{model="preprocess",version="1"} 77698.000000 # HELP nv_cache_num_entries Number of responses stored in response cache # TYPE nv_cache_num_entries gauge # HELP nv_cache_num_lookups Number of cache lookups in response cache # TYPE nv_cache_num_lookups gauge # HELP nv_cache_num_hits Number of cache hits in response cache # TYPE nv_cache_num_hits gauge # HELP nv_cache_num_misses Number of cache misses in response cache # TYPE nv_cache_num_misses gauge # HELP nv_cache_num_evictions Number of cache evictions in response cache # TYPE nv_cache_num_evictions gauge # HELP nv_cache_lookup_duration Total cache lookup duration (hit and miss), in microseconds # TYPE nv_cache_lookup_duration gauge # HELP nv_cache_util Cache utilization [0.0 - 1.0] # TYPE nv_cache_util gauge # HELP nv_cache_num_hits_per_model Number of cache hits per model # TYPE nv_cache_num_hits_per_model counter nv_cache_num_hits_per_model{model="ensemble",version="1"} 0.000000 nv_cache_num_hits_per_model{model="opt",version="1"} 0.000000 nv_cache_num_hits_per_model{model="preprocess",version="1"} 0.000000 # HELP nv_cache_hit_lookup_duration_per_model Total cache hit lookup duration per model, in microseconds # TYPE nv_cache_hit_lookup_duration_per_model counter nv_cache_hit_lookup_duration_per_model{model="ensemble",version="1"} 0.000000 nv_cache_hit_lookup_duration_per_model{model="opt",version="1"} 0.000000 nv_cache_hit_lookup_duration_per_model{model="preprocess",version="1"} 0.000000 # HELP nv_gpu_utilization GPU utilization rate [0.0 - 1.0) # TYPE nv_gpu_utilization gauge nv_gpu_utilization{gpu_uuid="GPU-55d4-21c2-83f9-2c620551ea46"} 0.870000 # HELP nv_gpu_memory_total_bytes GPU total memory, in bytes # TYPE nv_gpu_memory_total_bytes gauge nv_gpu_memory_total_bytes{gpu_uuid="GPU-55d4-21c2-83f9-2c620551ea46"} 8589934592.000000 # HELP nv_gpu_memory_used_bytes GPU used memory, in bytes # TYPE nv_gpu_memory_used_bytes gauge nv_gpu_memory_used_bytes{gpu_uuid="GPU-55d4-21c2-83f9-2c620551ea46"} 4989124608.000000 # HELP nv_gpu_power_usage GPU power usage in watts # TYPE nv_gpu_power_usage gauge nv_gpu_power_usage{gpu_uuid="GPU-55d4-21c2-83f9-2c620551ea46"} 87.707000 # HELP nv_gpu_power_limit GPU power management limit in watts # TYPE nv_gpu_power_limit gauge nv_gpu_power_limit{gpu_uuid="GPU-55d4-21c2-83f9-2c620551ea46"} 240.000000 # HELP nv_energy_consumption GPU energy consumption in joules since the Triton Server started # TYPE nv_energy_consumption counter nv_energy_consumption{gpu_uuid="GPU-55d4-21c2-83f9-2c620551ea46"} 4846806.151000
설정
| 옵션 설명 | 옵션 명령 |
|---|---|
| metrics 사용 유무 | tritonserver --allow-metrics=true/false |
| gpu metrics 끄기 | tritonserver --allow-gpu-metrics=false |
| cpu metrics 끄기 | tritonserver --allow-cpu-metrics=false |
| port 설정 | --metrics-port |
| specific address (http servier) 설정 | --http-address |
| 지표 조회 기간 설정 | --metrics-interval-ms |