1. k3s 설치
앞서 설정한 vm에 원격접속 후 진행
# 1. 방화벽 확인
sudo ufw status
#inactive라고 나오는 경우 바로 3번으로, active라고 나오면 2번 방화벽 설정하기

# 2. 방화벽 설정
sudo ufw allow 6443/tcp
sudo ufw allow from 10.42.0.0/16
sudo ufw allow from 10.43.0.0/16

# 3. 스왑 메모리 끄기 (쿠버네티스 필수 작업)
sudo swapoff -a
sudo sed -i '/swap/s/^/#/' /etc/fstab

# 4. K3s 올인원 설치
curl -sfL https://get.k3s.io | sh -
2.ArgoCD
2-1. 설치
### 1. 설치  ###
# ArgoCD 네임스페이스 생성
kubectl create namespace argocd

# namespace 확인
kubectl get namespaces

# ArgoCD 설치
kubectl apply -n argocd -f https://raw.githubusercontent.com/argoproj/argo-cd/stable/manifests/install.yaml

# 확인
kubectl get all -n argocd


### 2. 초기 비밀번호 확인 -> 나중에 비밀번호 바꾸기 위해 기록해두기 ###
kubectl -n argocd get secret argocd-initial-admin-secret -o jsonpath="{.data.password}" | base64 -d


### 3.argocd 접속을 위한 포트포워딩  ###
nohup kubectl port-forward --address 0.0.0.0 svc/argocd-server -n argocd 8089:443 > /dev/null 2>&1 &
2-2. 접속
(1) k3s 서버와 같은 네트워크인 경우
아래 url를 통해 브라우저로 argocd 페이지 접속
https://{k3s서버ip}:8089
(2) k3s 서버와 다른 네트워크인 경우
현재 저는 아래와 같은 환경으로 이루어져 있으므로
[외부]
   └─ 내 노트북 (https://localhost:8089)
         │
         ▼ (SSH Tunneling-> 공인IP:30022)
[집 내부망 - Gateway]
   └─ 외부 접속용 서버 (A 네트워크 공인 IP)
         │
         ▼ (내부 사설망 통신-> 사설IP:8089)
[Proxmox VM]
   └─ k3s 서버 (A 네트워크 사설 IP)
         │
         ▼ (kubectl port-forward 8089 -> 443)
[k3s Cluster]
   └─ ArgoCD Pod (최종 목적지)
아래 명령어로 외부 네트워크에서 ssh 터널링을 유지하여
ssh -p 30022 root@{게이트웨이ip} -L 8089:{k3s서버ip}:8089https://localhost:8089 url를 통해 argocd 페이지 접속
2-3. 비밀번호 수정
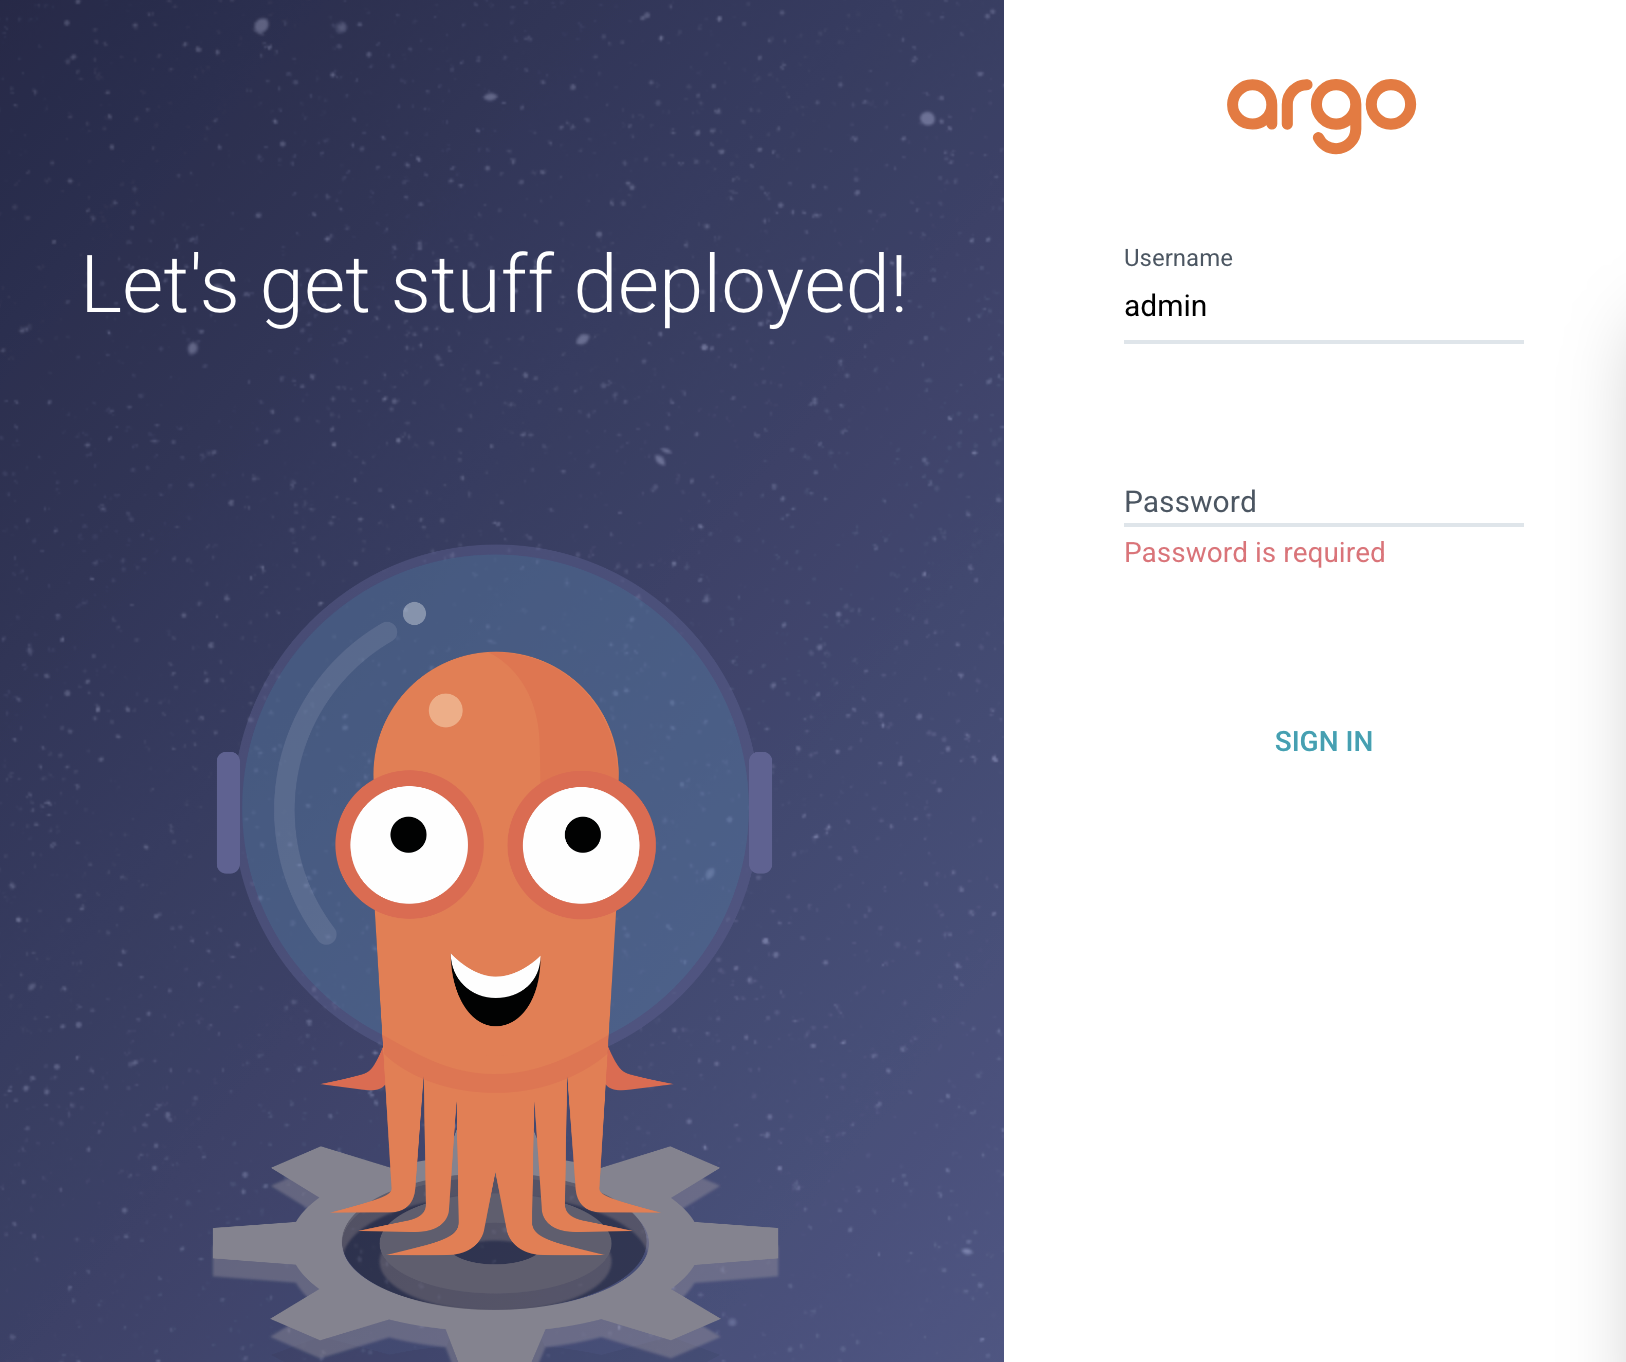
(1) 초기 로그인
username: admin
password: 앞서 2-1에서 확인한 비밀번호
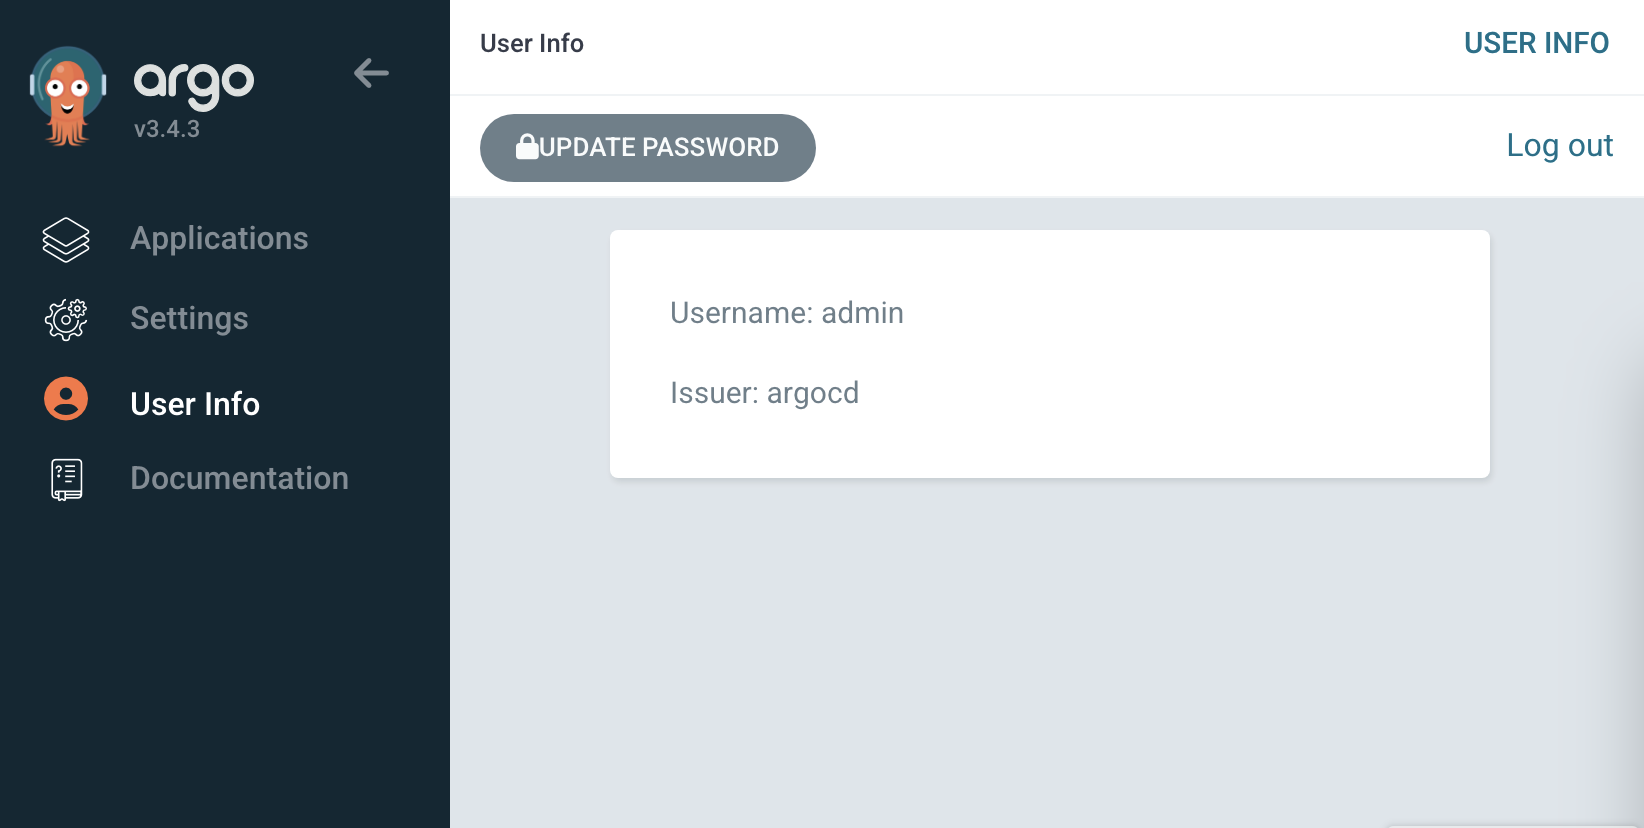
User Info - Update Password에서 비밀번호 수정
3.grafana, prometheus
3-1. helm으로 grafana, prometheus 설치
# 1. helm 설치
curl https://raw.githubusercontent.com/helm/helm/main/scripts/get-helm-3 | bash

# 2. grafana, prometheus 레포지토리 추가
helm repo add prometheus-community https://prometheus-community.github.io/helm-charts
helm repo update

# 3. 네임스페이스 및 환경변수 추가
kubectl create namespace monitoring

# root 사용자의 bash 설정 파일 끝에 환경 변수 추가
echo 'export KUBECONFIG=/etc/rancher/k3s/k3s.yaml' >> ~/.bashrc

# 변경사항 바로 새로고침
source ~/.bashrc

# 4. 설치 (kube-prometheus-stack이 prometheus와 grafana가 묶여있는 세트)
helm install monitoring prometheus-community/kube-prometheus-stack \
  --namespace monitoring \
  --create-namespace \
  --set grafana.adminPassword=패스워드 \
  --set grafana.service.type=NodePort \
  --set grafana.service.nodePort=30000 \
  --set prometheus.service.type=NodePort \
  --set prometheus.service.nodePort=30001
3-2. 접속
(1) k3s 서버와 같은 네트워크인 경우
아래 url를 통해 브라우저로 페이지 접속
grafana -> https://{k3s서버ip}:30000
prometheus -> https://{k3s서버ip}:30001
(2) k3s 서버와 다른 네트워크인 경우
현재 저는 아래와 같은 환경으로 이루어져 있으므로
[외부]
   └─ 내 노트북
         │
         ▼ (SSH Tunneling-> 공인IP:30022)
[집 내부망 - Gateway]
   └─ 외부 접속용 서버 (A 네트워크 공인 IP)
         │
         ▼
[Proxmox VM]
   └─ k3s 서버 (A 네트워크 사설 IP)
         │
         ▼
[k3s Cluster]
   └─ (최종 목적지)
아래 명령어로 외부 네트워크에서 ssh 터널링을 유지하여
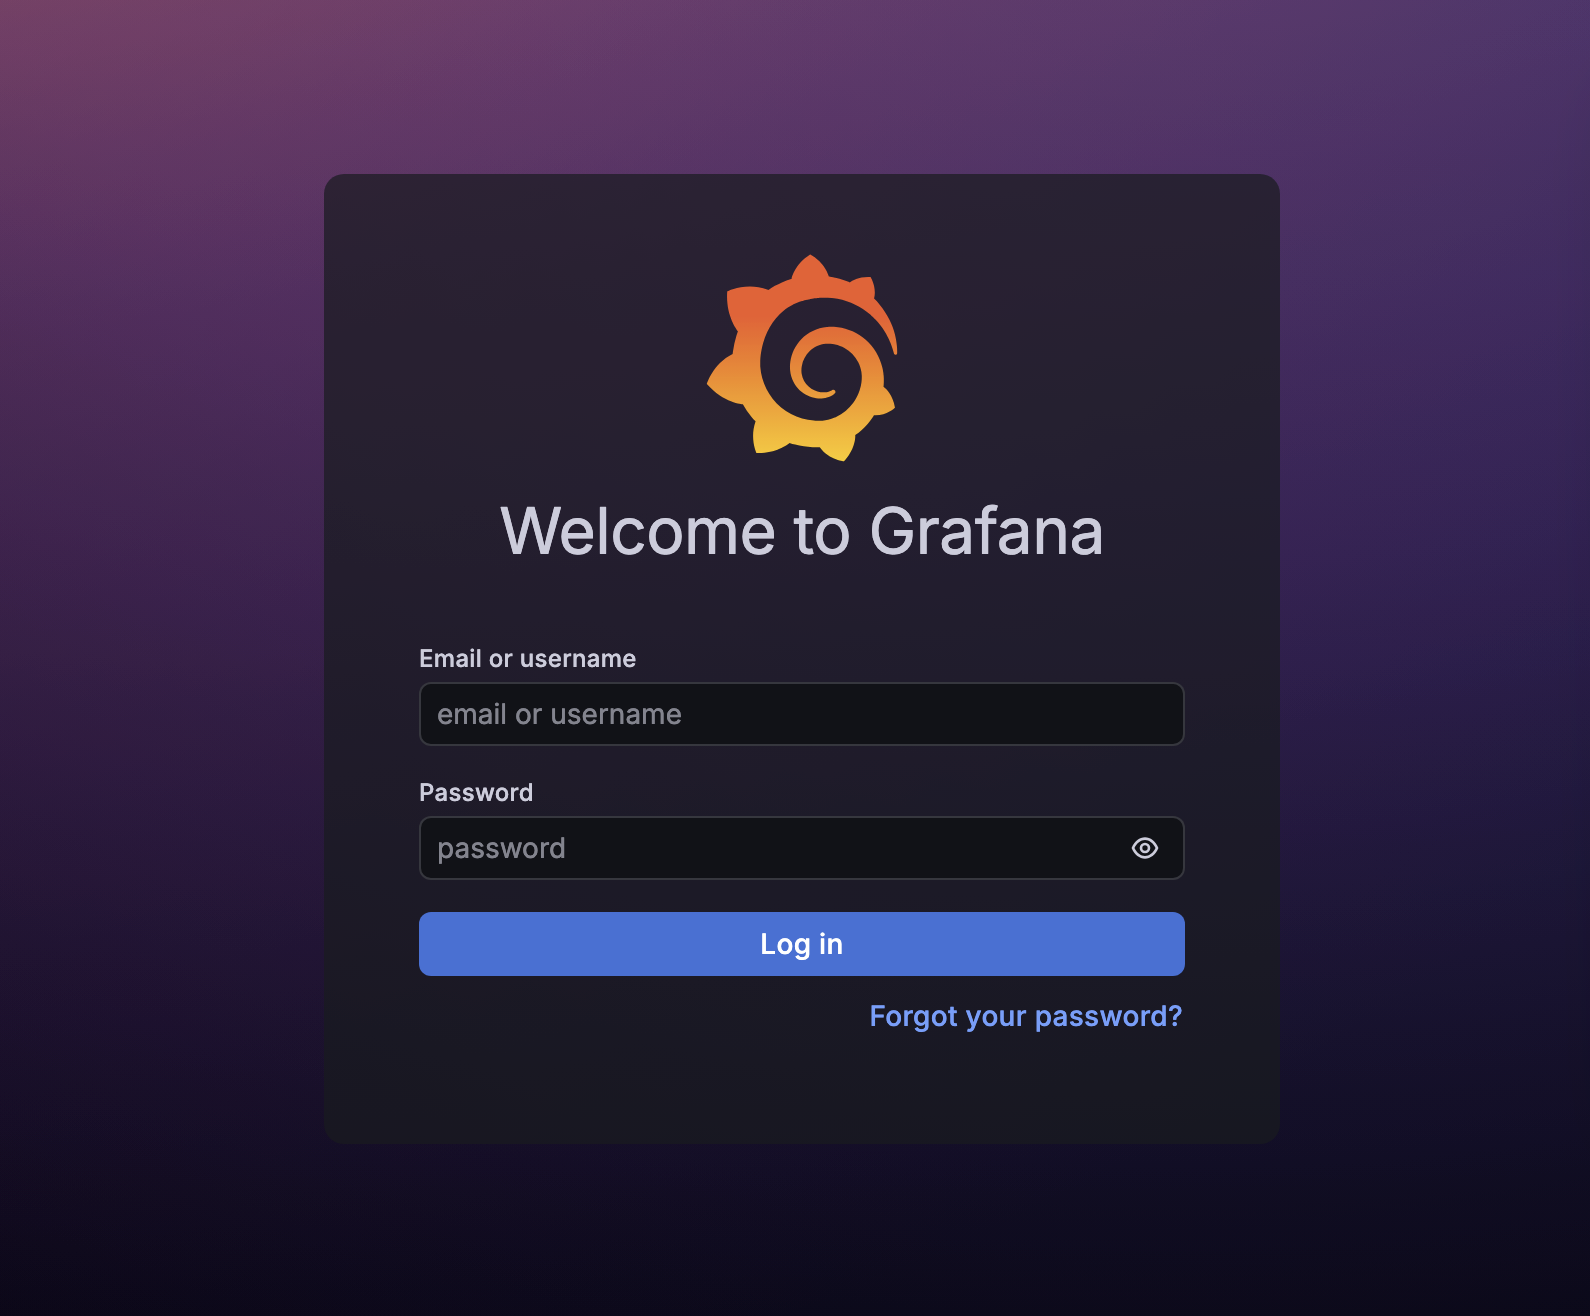
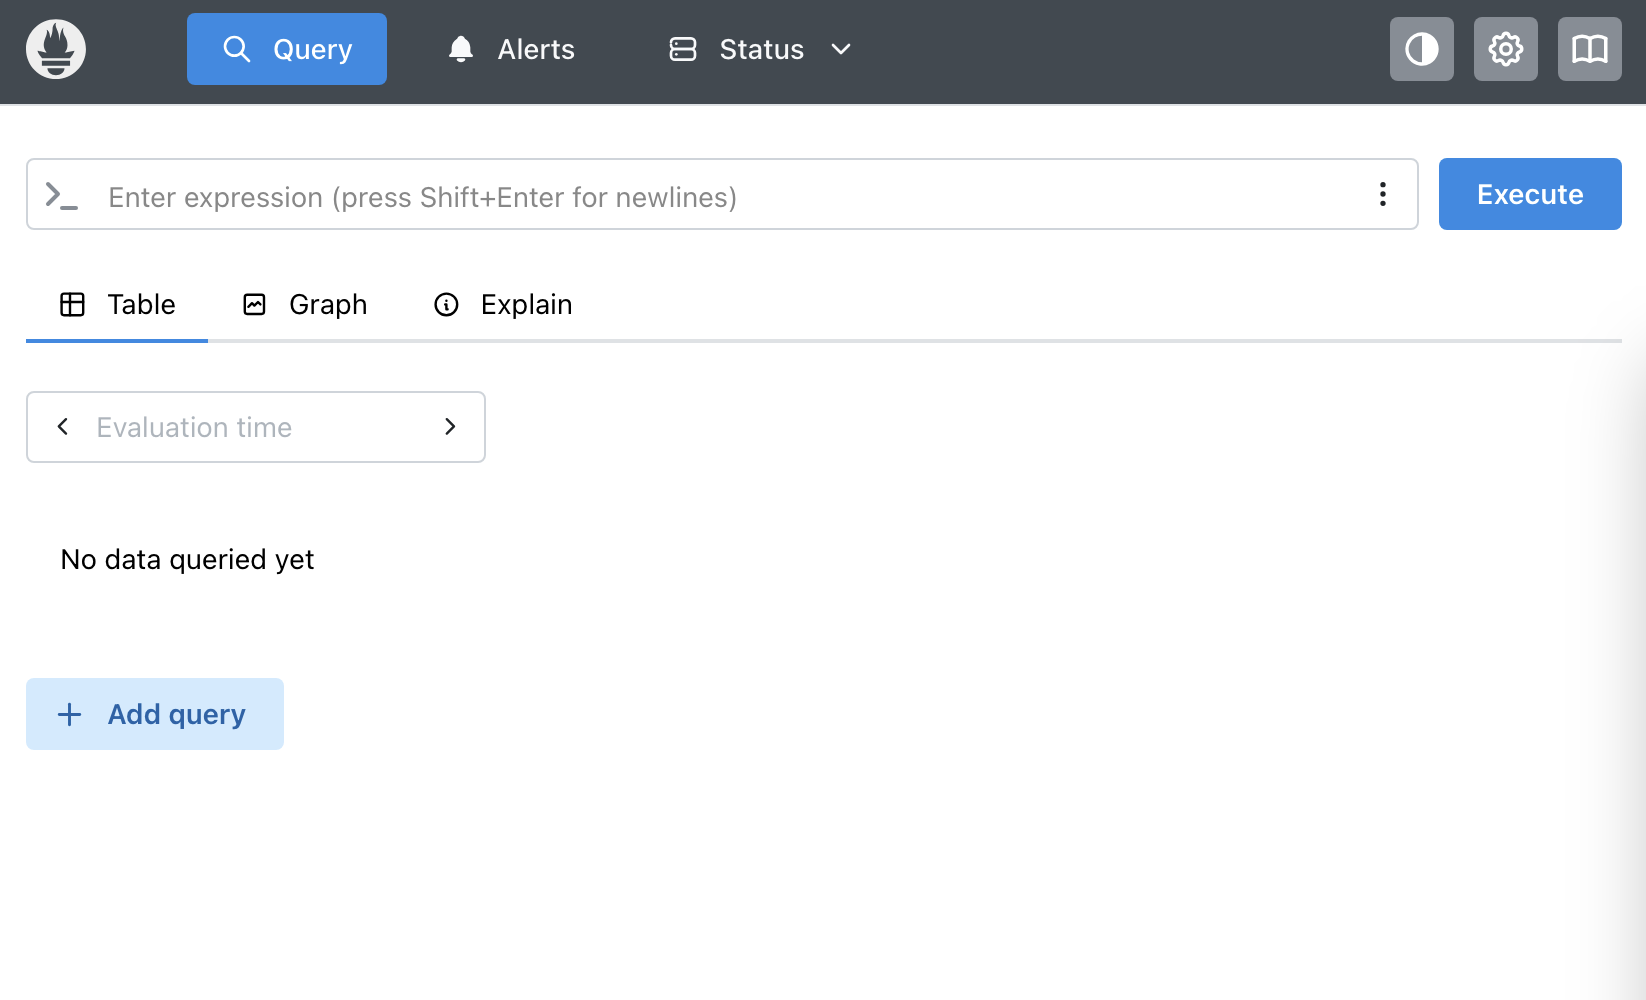
ssh -p 30022 root@{게이트웨이ip} -L 30000:{k3s서버ip}:30000 -L 30001:{k3s서버ip}:30001https://localhost:30000과 https://localhost:30001 url를 통해 grafana와 prometheus 페이지 접속

하루살이