chart.js y축 기준 가로 bar
23.11.21.(화)
이전에 bar 디자인 가로와 세로가 있어서 나는 가로기준 세로바(x축 기본)로 했다. 동료가 세로기준 가로바(y축) bar 설정했는데 어떻게 다른지 비교해보았다.
저의 기억을 정리하기 위함입니다.
코드 일부와 변경해서 가져오는 거라 빠진 부분이 많아 참고가 잘 안 될 겁니다.
이 모든 정보는 chart.js 공식 문서에 다 있습니다.
//기존 나의 코드
const bar = () => {
// 그래프 옵션
const option = {
const barDataTotal = {
plugins: [ChartDataLabels],
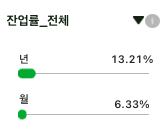
labels: ["년", "월"],
// 그래프 데이터
datasets: [
{
color: "#fff",
label: "잔업률",
data: [100, 30],
backgroundColor: isDark ? ["rgb(252, 235, 79)", "rgb(234, 59, 46)"] : ["rgb(245, 188, 65)", "rgb(234, 66, 56)"],
borderColor: isDark ? ["rgb(252, 235, 79)", "rgb(234, 59, 46)"] : ["rgb(245, 188, 65)", "rgb(234, 66, 56)"],
barThickness: 20,
maxBarThickness: 22,
minBarThickness: 10,
},
],
};
// Select 옵션
const OPTIONS = [
{ value: "전체", name: "전체" },
{ value: "1조", name: "1조" },
{ value: "2조", name: "2조" },
];
}
return(
<Bar type="bar" options={option} data={currentData} plugins={currentData.plugins} />
<div>
<select onChange={handleChange} value={isSelectValue}>
{OPTIONS.map((option, index) => (
<option key={index} value={option.value}>
{option.name}
</option>
))}
</select>
<div>
)
}bar 안에 option을 줘야한다. return문에 options을 넘기기 위함이다. barDataTotal과 barDataFirst, barDataSecond dropdown 3가지가 있다. 예를 들어 Total만 가져왔다. plugin 플러그인은 차트의 기본 동작을 사용자 정의하거나 변경하는 가장 효율적인 방법이다. 드롭다운 바꿀 때마다 최근 플러그인 사용. 난 option안에 (x, y축)와 데이터(년, 월)를 넣었는데 동료분은 option 안에 options(x, y축)와 데이터(년, 월) 상수로 줬다. 나는 OPTIONS라는 dropdown 항목을 줬다. 동료는 handle event를 주었다.
//변경 동료 코드
const bar = () => {
 // State
    const [selectedOption, setSelectedOption] = useState('');
    // Select 옵션
    const handleSelectChange = (e) => {
        setSelectedOption(e.target.value);
    };

    // 그래프 데이터
    const data = {
        labels: ['년', '월'],
        datasets: [
            {
                data: [isFilterDetailData?.Y_RATIO, isFilterDetailData?.M_RATIO, 100],
                backgroundColor: isDark ? ['#0aff00'] : ['#00b437'],
                maxBarThickness: 22,
                minBarThickness: 10,
                barThickness: 10,
                borderRadius: 20,
                borderSkipped: false,
            },
        ],
    };
        // 그래프 옵션
    const options = {
        indexAxis: 'y',
        responsive: true,
        maintainAspectRatio: false,
        animation: {
            animationRotate: true,
            duration: 2000,
        },
      }
      return(
                                  <div>
                                <select value={selectedOption} onChange={handleSelectChange}>
                                    <option value={dataa[0].SCLASS_ID}>잔업률_전체</option>
                                    <option value={dataa[1].SCLASS_ID}>잔업률_4직 1조</option>
                                    <option value={dataa[2].SCLASS_ID}>잔업률_4직 2조</option>
                                </select>
                            </div>
      <div className={styles['chart-bar']}>
                                <p className={styles['year-text']}>년</p>
                                <p className={styles['year-text-percent']}>{isFilterDetailData?.Y_RATIO}%</p>
                                <Bar data={data} options={options}></Bar>
                                <p className={styles['month-text-percent']}>{isFilterDetailData?.M_RATIO}%</p>
                                <p className={styles['month-text']}>월</p>
                            </div>
      )
 }
data 년, 월도 하나만 했다. useState 사용하고, return문에
<select>tag 이용! 나는 map 함수로 돌렸다.
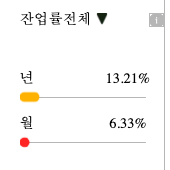
indexAxis: 'y'가 세로기준 가로로 바가 펼쳐지는 옵션이다.
2024.01.24.(수)
어느새 해가지나 2024년이 되었다. 이번엔 내가 다시 만들면서 또 가로 바를 만지게 되는 때가 되었다.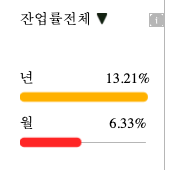
100기준으로 bar가 채워지면 좋겠다.
//기존 코드

  const data = {
    labels: ['', '년', '월'],
    datasets: [
      {
        data: [0, isBar, isBar2],
        backgroundColor: ['transparent', '#ffba00', '#ff2929'],
        borderColor: ['transparent', '#ffba00', '#ff2929'],
        maxBarThickness: 22,
        minBarThickness: 10,
        barThickness: 10,
        borderRadius: 20,
        borderSkipped: false,
      },
    ],
  };
  // 변경 코드
  const data = {
    labels: ['', '년', '월'],
    datasets: [
      {
        data: [0, isBar, isBar2, 100],
        backgroundColor: ['transparent', '#ffba00', '#ff2929'],
        borderColor: ['transparent', '#ffba00', '#ff2929'],
        maxBarThickness: 22,
        minBarThickness: 10,
        barThickness: 10,
        borderRadius: 20,
        borderSkipped: false,
      },
    ],
  };
5번째 줄 data 끝에 100을 넣어주면 된다!!